My Account
My Slides
Search by Category
Templates
Leave Feedback
Login
Logout
Get Started
Browse all Slides
Browse all Slides
Create a FREE Account
Instant access to 1,000+ real slides from top companies like McKinsey, BCG, Goldman Sachs, Google and many more!
First Name
Last Name
Email
Password
I agree to all
Terms & Privacy Policy
Thank you! Your submission has been received!
Oops! Something went wrong while submitting the form.
Have an account?
Sign in
Saved Slides
Visually segmented grid layout with four numbered blocks on a digital-tech style background.
Organizational Structure and Change
Healthcare & Pharmaceuticals
Lists four main sections of a report related to metabolic health and strategic planning. Each box provides section title and page range. Provides a clear overview for navigating the document.
table of contents, strategy, healthcare, metabolic health, report
Agenda
McKinsey
Saved
A two-column slide listing the advantages and risks of engaging with quantum technologies. Icons symbolize positive and negative aspects on each side.
Strategic Planning
Technology & Software
The slide is a continuation of the strategic considerations for leaders in quantum technology, detailing the potential benefits of early adoption and the uncertainties involved, aiming to guide decision-making processes.
Quantum Technology, Leadership, Strategy, Risks
Header Horizontal
McKinsey
Saved
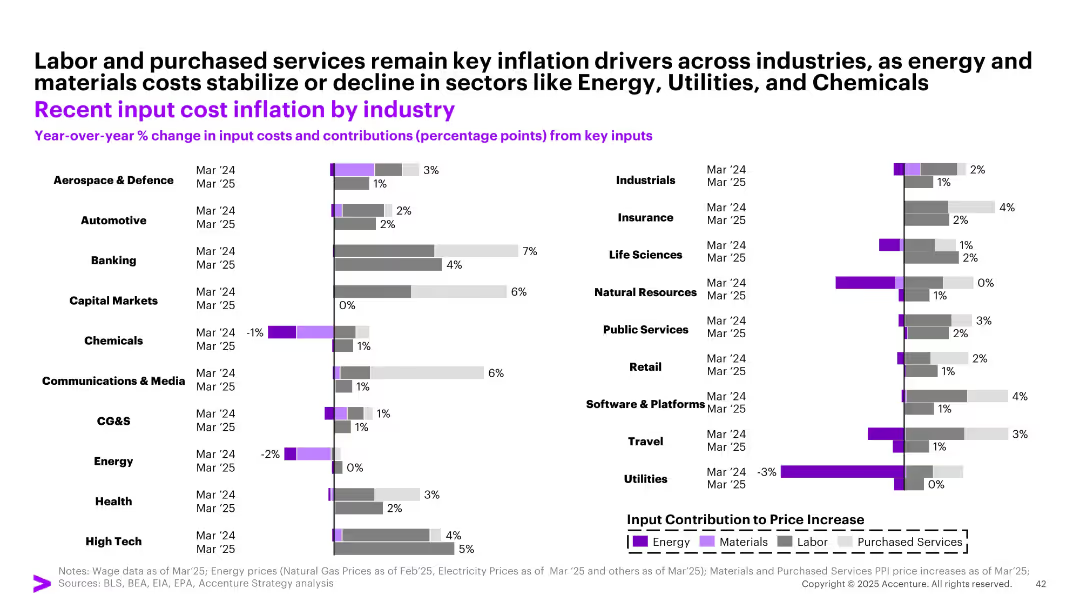
Horizontal bar chart segmented by industry and key cost drivers (Energy, Materials, Labor, Services); two bars per industry (Mar ‘24/’25)
Operational Efficiency
Industrial & Manufacturing
The slide details year-over-year changes in input costs for different industries as of March 2024 and March 2025. Key inflation drivers such as labor and purchased services remain dominant, while energy and materials costs have declined in sectors like Utilities, Chemicals, and Energy.
input costs, inflation, labor, services, industries, 2025, chemicals, utilities, manufacturing
Single Chart
Accenture
Saved
The slide includes a line chart showing the global supply chain pressure index over time, with key events annotated and a commentary section explaining the trends.
Risk Assessment and Management
Transportation & Logistics
The slide discusses the normalization of global supply chain pressures to pre-pandemic levels and identifies potential future risks.
supply chain, pressure, index, global, trends
Mixed Chart
Accenture
Saved
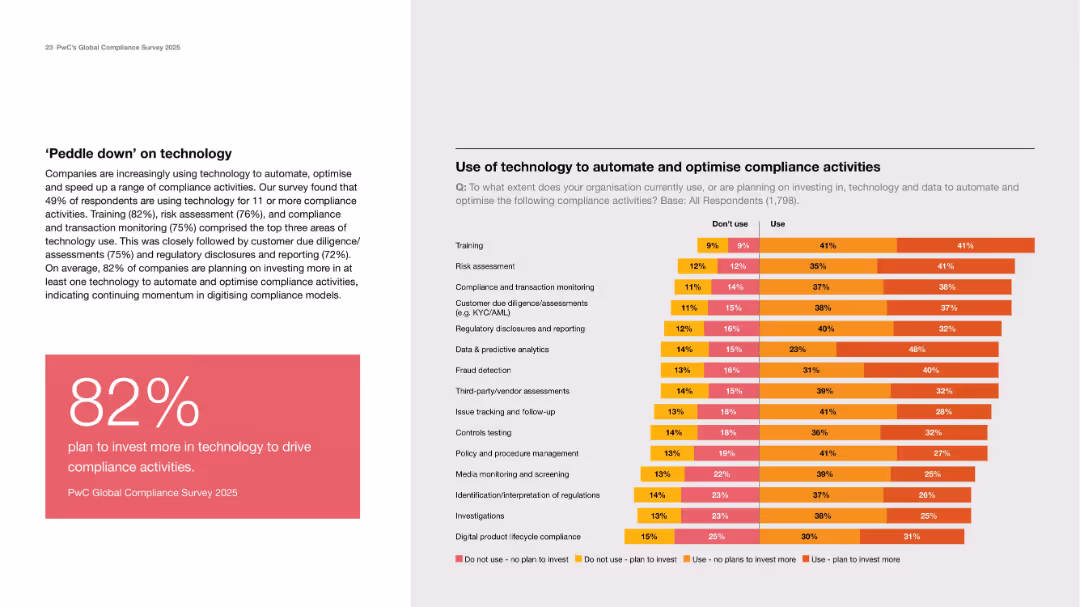
Left text and stat box; right side stacked bar chart on tech use in compliance by activity type.
Technology and Digital Transformation
Technology & Software
Emphasizes increasing tech investment in compliance, with 82% planning more investment. Training, risk assessment, and monitoring are most common use cases. The chart shows current and planned adoption levels.
automation, compliance tech, investment, risk, reporting, AI
Mixed Chart
PwC/Strategy&
Saved
The slide features multiple column charts comparing sustainability influence across generations.
Market Analysis and Trends
Environmental Services & Sustainability
Examines how sustainability influences purchasing behaviors across different generations globally.
sustainability, generations, influence, global, purchasing behavior
Multiple Chart
BCG
Saved
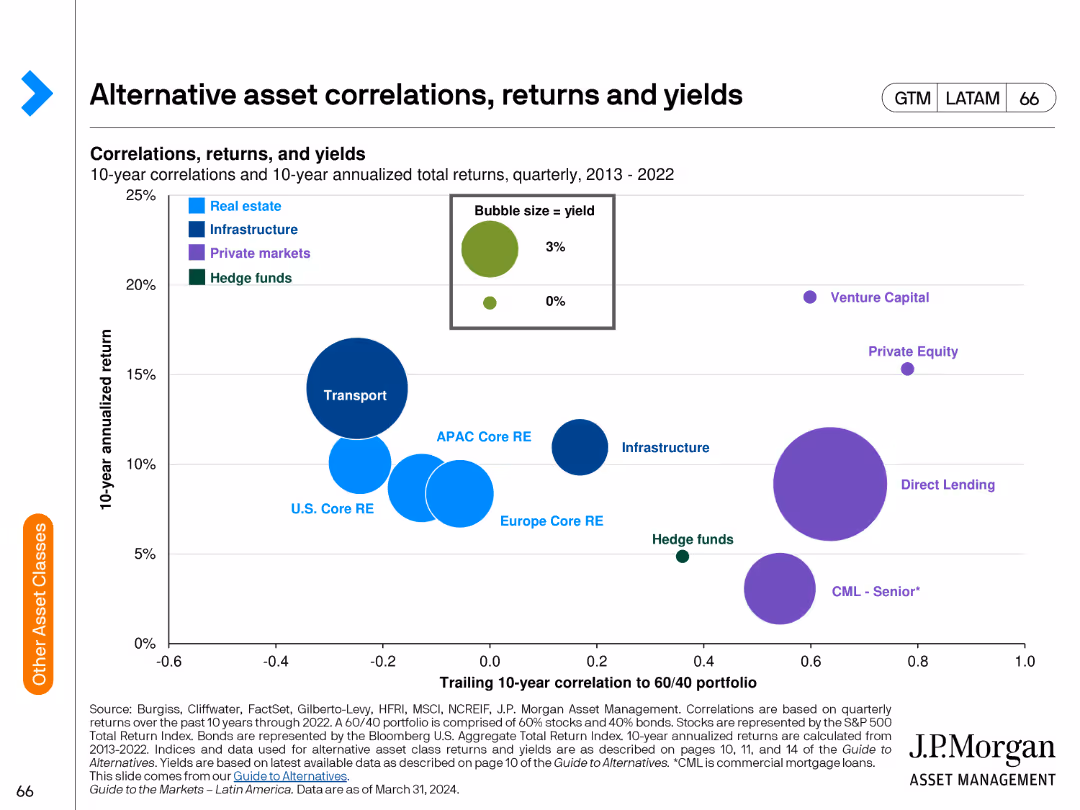
The slide includes a bubble chart showing correlations and returns of alternative assets over a 10-year period. Bubbles are color-coded by asset type.
Investment Analysis
Financial Services
The slide examines the correlations, returns, and yields of various alternative asset classes over a decade, used for evaluating investment strategies.
alternative assets, correlations, returns, yields, investment analysis, financial performance, risk assessment, asset comparison
Single Chart
JP Morgan
Saved
The slide features a balanced layout with a text section on the left and a column chart on the right. The text section explains strategic choices driven by technology. The column chart shows disruption levels increasing over time.
Strategic Planning
Technology & Software
The slide discusses how tech-forward companies accelerate strategy cycle times using real-time data. It highlights disruption forces with a chart showing disruption index growth.
strategy, disruption, technology, cycle times, real-time data
Mixed Chart
Accenture
Saved
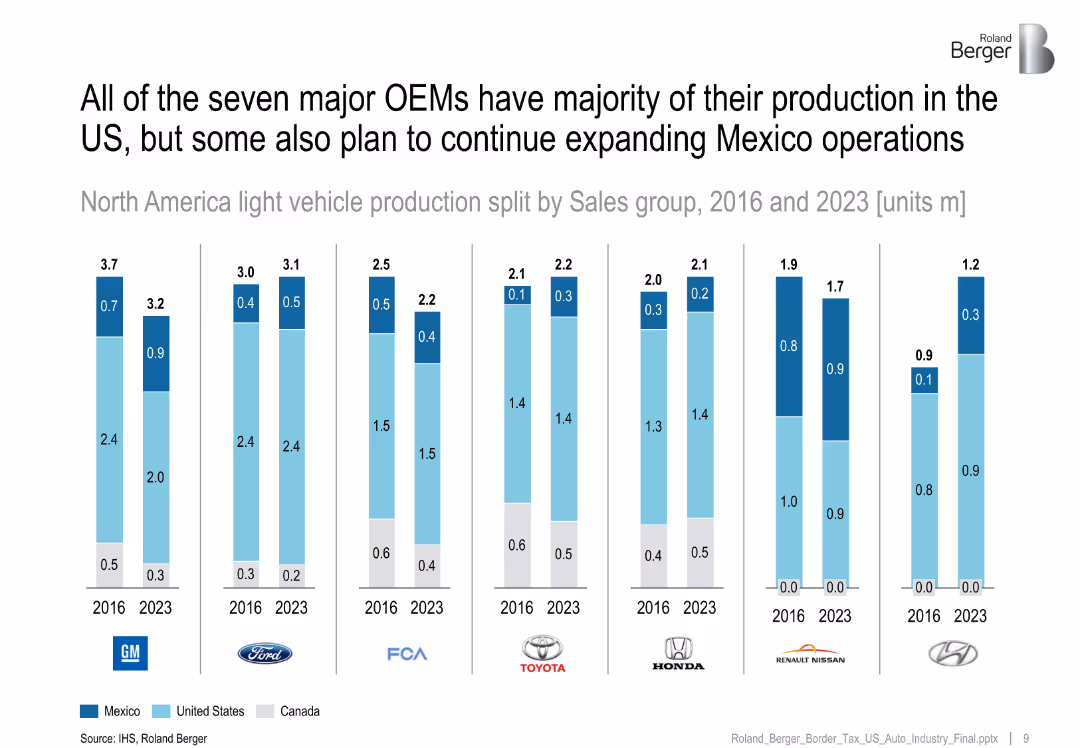
Multiple stacked bar charts per OEM (GM, Ford, etc.) showing vehicle production split (2016 vs 2023).
Strategic Planning
Industrial & Manufacturing
Compares North American production plans of major OEMs, showing most intend to keep majority production in the US, though Mexico's share is projected to grow for some brands.
OEMs, Mexico production, 2023 forecast, US dominance, vehicle production
Single Chart
Roland Berger
Saved
Comparative scatter plots examining the relationship between lockdown speed, strictness, and the length of the COVID-19 outbreak.
Risk Assessment and Management
Government & Public Sector
Evaluates the effectiveness of early and strict lockdown measures in controlling the COVID-19 outbreak.
Lockdown Effectiveness, COVID-19, Outbreak Control, Government Policy
Multiple Chart
BCG
Saved
The slide uses column charts to compare labor availability issues in France from 2022 to 2023 across all industries, with contextual insights from industry professionals about regional recruitment challenges.
Human Resources and Talent Management
Professional Services
Explores the labor shortage crisis in France, detailing sector-specific challenges and geographic disparities in labor availability, and assessing the impact on industries such as logistics and high-tech.
labor shortage, France, industry impact, recruitment challenges, regional analysis
Mixed Chart
Bain
Saved
A stacked column chart shows historical and projected emissions for selected countries, segmented by technological interventions like renewable electricity, efficiency improvements, and carbon capture. Each segment's potential impact on emissions is visually differentiated.
Regulatory and Compliance
Environmental Services & Sustainability
Outlines the technological solutions available for reducing emissions in key countries, emphasizing the role of innovation and technology in meeting climate goals. Useful for discussions on integrating new technologies in national policies and strategies to reduce greenhouse gas emissions.
Emissions, Technology, Renewable energy, Carbon capture, 2050
Single Chart
BCG
Saved
Text-heavy, detailing the benefits of integrating different GBS functions across a unified platform and a column chart
Operational Efficiency
Professional Services
Discusses cross-functional improvements, data integrity, and reduced handoffs in GBS operations.
cross-functional, GBS, improvements, data integrity, efficiency
Mixed Chart
Deloitte
Saved
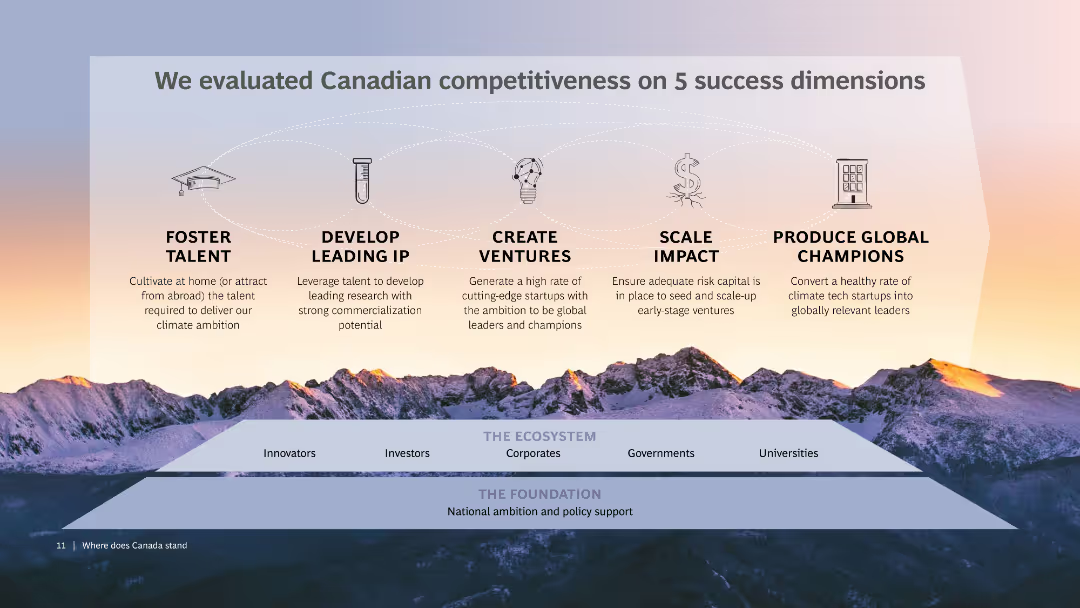
The slide shows five icons representing key success dimensions: talent, IP, ventures, impact, and champions, over a backdrop of a mountain range at sunset. Below the icons, there is a diagram linking "The Ecosystem" and "The Foundation" with various stakeholders like innovators and government.
Strategic Planning
Professional Services
Evaluates Canadian competitiveness based on talent, leading IP, venture creation, scaling impact, and producing global champions. Provides a framework connecting various stakeholders within the ecosystem and foundation.
Competitiveness, Canada, Success dimensions, Talent, IP
Pillar
BCG
Saved
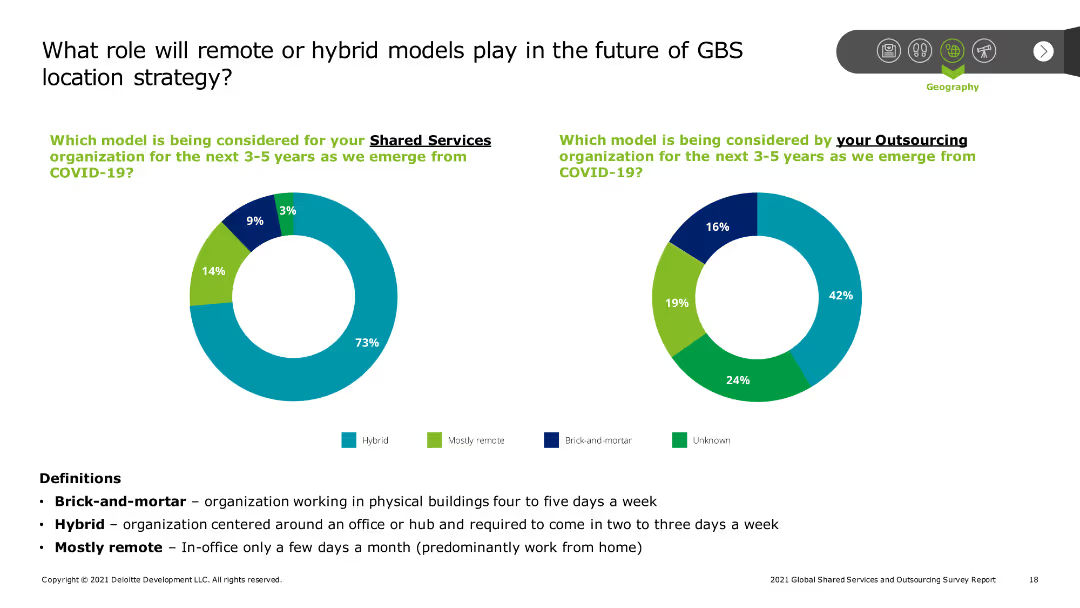
This slide presents two pie charts comparing models considered for shared services and outsourcing organizations post-COVID-19, including hybrid, remote, and brick-and-mortar models. Text provides definitions and key points.
Technology and Digital Transformation
Professional Services
The slide explores the role of remote or hybrid work models in the future of GBS location strategy, showing the distribution of preferred models for shared services and outsourcing organizations.
Remote work, hybrid models, GBS, location strategy, post-COVID-19
Multiple Chart
Deloitte
Saved
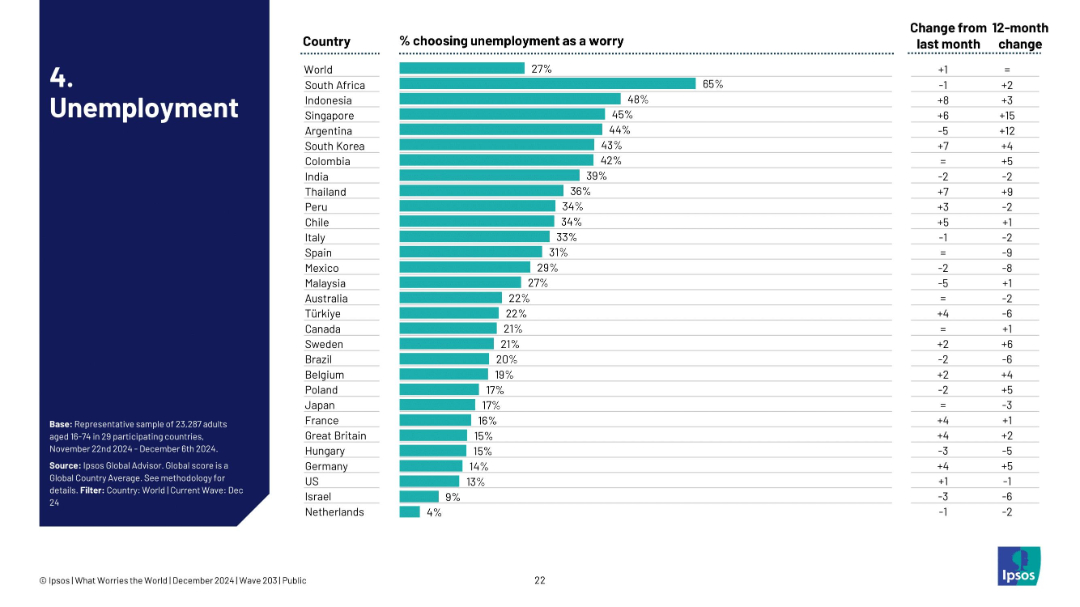
Bar chart of countries with highest concern over unemployment, includes trend comparison to last month and last year.
Performance Metrics and KPIs
Financial Services
The slide reveals 27% globally worry about unemployment. South Africa tops at 65%. It offers insight into short-term and long-term shifts, with notable concern increases in Singapore and Argentina.
unemployment, labor market, joblessness, global survey, economic trends
Single Chart
IPSOS
Saved
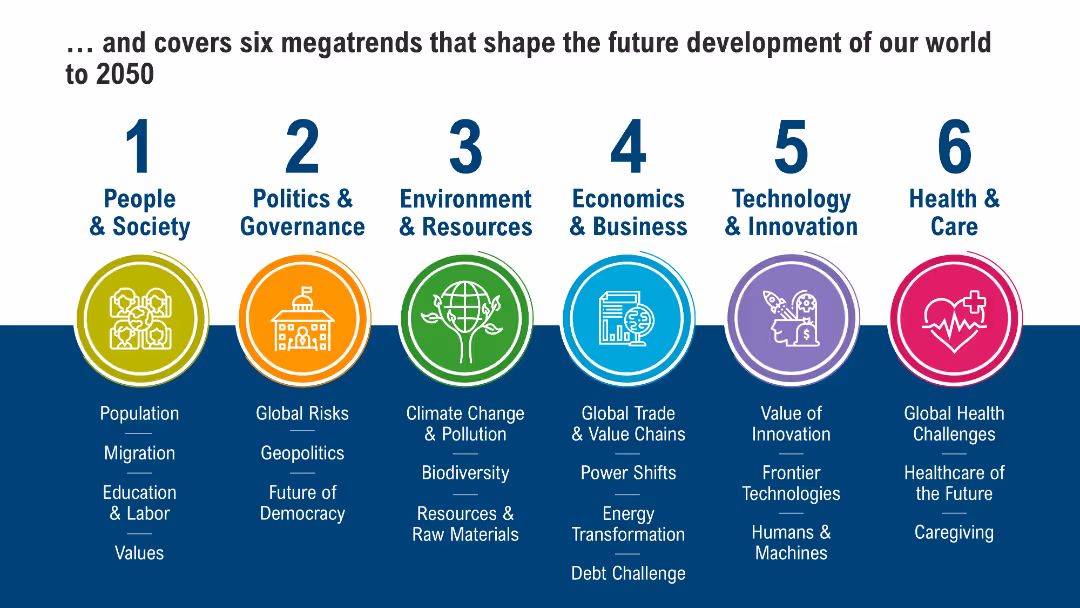
Infographic-style layout with icons and color-coded sections representing six global megatrends (People, Politics, Environment, Business, Tech, Health)
Strategic Planning
Professional Services
This slide presents six global megatrends projected to shape societal and economic development through 2050, spanning demographics, governance, climate, business, innovation, and healthcare. Each trend is categorized and visually represented.
Megatrends, Society, Environment, Governance, Innovation, Future, Global Trends, 2050
Pillar
Roland Berger
Saved
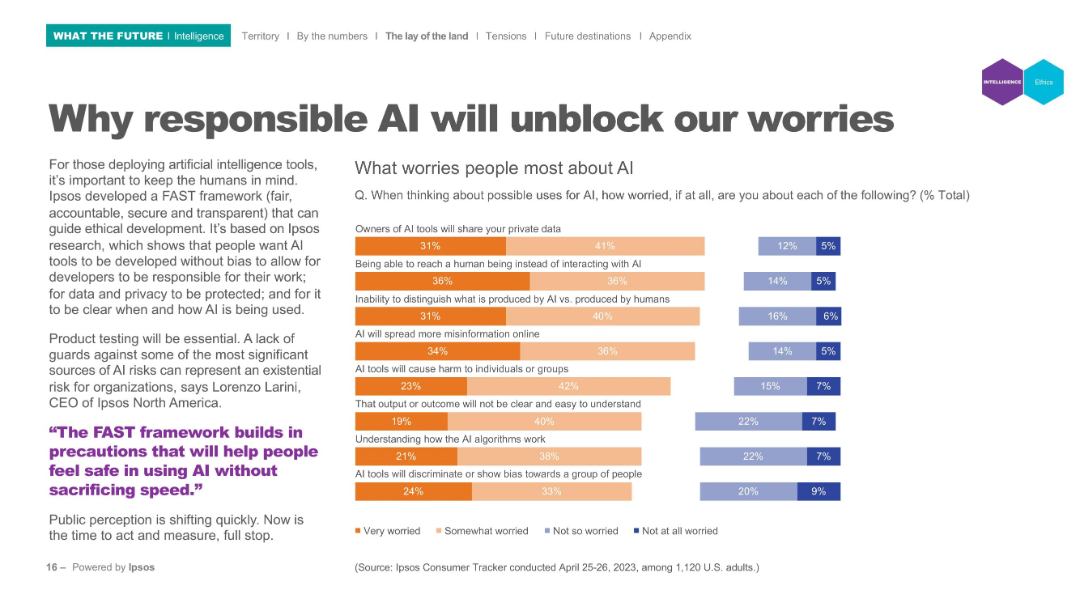
Left panel text; right panel horizontal bar chart indicating worry levels; categories use color-coded segments.
Risk Assessment and Management
Artificial Intelligence
Lists top public concerns regarding AI (e.g., privacy, bias, misinformation). Visual data shows levels of worry using segmented bar charts to represent varying degrees of concern from "Very worried" to "Not worried". Tied to Ipsos' FAST (fair, accountable, secure, transparent) framework.
AI ethics, public concerns, privacy, misinformation, bias, accountability, FAST framework
Mixed Chart
IPSOS
Saved
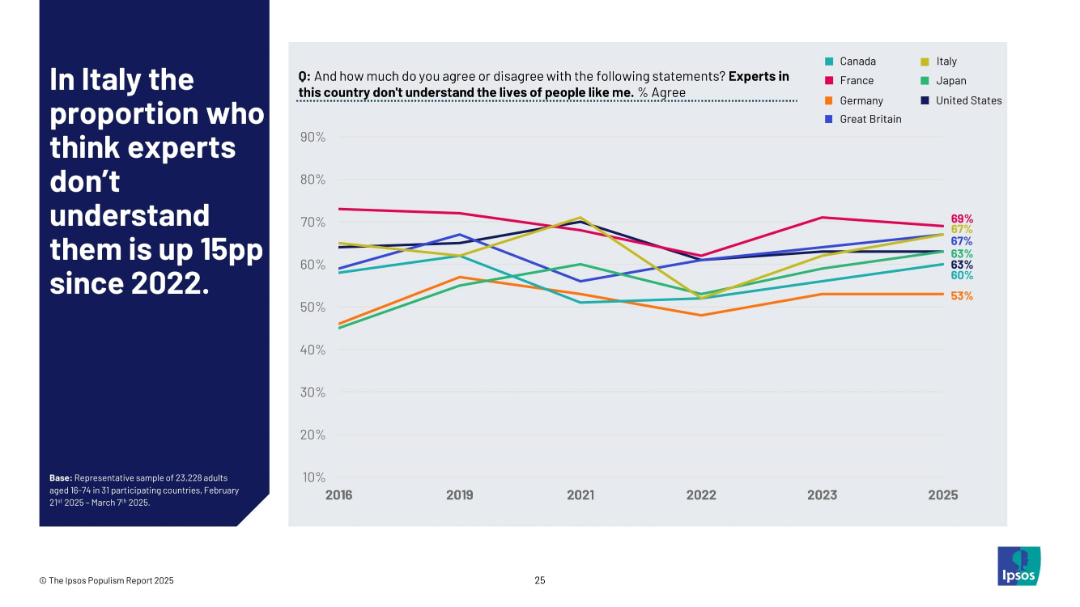
Left-aligned title on blue; right side has a multi-country line chart visualizing agreement with the expert disconnect statement from 2016–2025.
Market Analysis and Trends
Government & Public Sector
This slide tracks how various populations perceive experts’ understanding of citizens' lives. Italy shows a 15 percentage point increase since 2022, signaling a rise in expert distrust or disconnect perception.
Italy, experts, disconnect, opinion trends, 2025, Ipsos, populism, global sentiment, distrust, perception shift
Mixed Chart
IPSOS
Saved
This slide features a column chart on the left showing EBITDA uplift from Digital & Analytics, and a list of top 5 challenges on the right.
Operational Efficiency
Industrial & Manufacturing
The slide explains how steel companies face challenges in digital transformation, highlighting issues in business, organization, and technology.
digital transformation, pilot trap, EBITDA, challenges, steel industry
Pillar
McKinsey
Saved
A column chart and a table showing global distribution of skilled workforce and top countries by skilled workforce.
Human Resources and Talent Management
Education & Training
Highlights global distribution and forecast of skilled workers, focusing on growth in Asia Pacific, Africa, and Latin America.
Skilled workforce, global distribution, Asia Pacific, Africa, Latin America, workforce forecast
Mixed Chart
Accenture
Saved
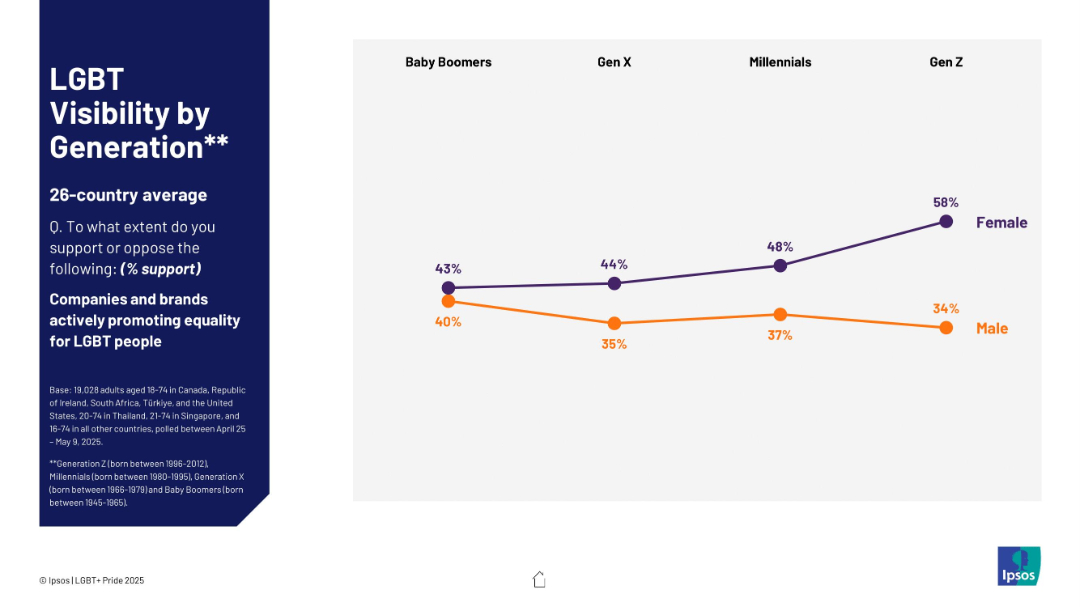
Line chart on the right displaying generational support trends by gender; dark blue text panel on left.
Market Analysis and Trends
Government & Public Sector
Generational support for corporate advocacy of LGBT equality is displayed, with Gen Z women showing the highest support (58%). Male support declines slightly with younger generations.
equality, companies, LGBT, support, generational trends, corporate activism
Mixed Chart
IPSOS
Saved
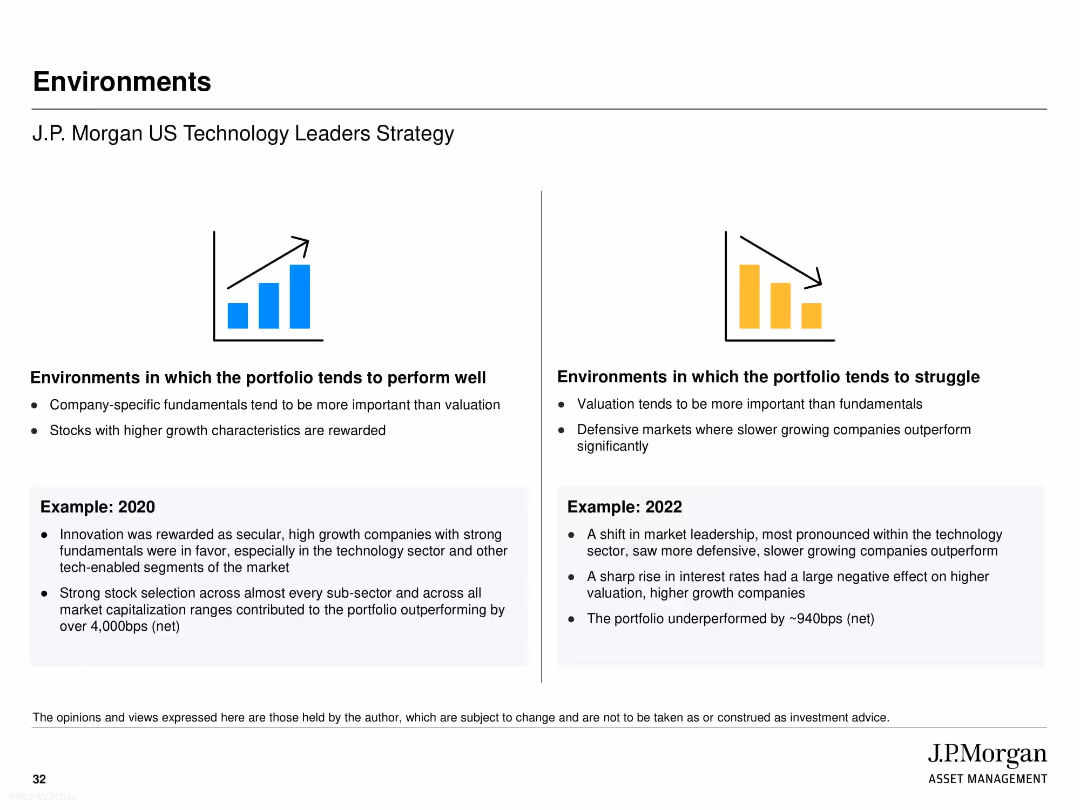
Split into two columns: favorable vs. unfavorable environments for portfolio performance. Icons show upward/downward trends. Includes examples from 2020 and 2022. Clean text-heavy layout with large headings and bullets.
Risk Assessment and Management
Financial Services
The slide outlines market conditions where the J.P. Morgan US Technology Leaders Strategy tends to perform well or struggle. Favorable environments reward high-growth stocks and fundamentals, while struggles arise in valuation-driven or defensive markets. Examples from 2020 (strong outperformance) and 2022 (significant underperformance) offer historical context for risk sensitivity.
market environment, portfolio performance, risk, valuation, fundamentals, J.P. Morgan, 2020, 2022, strategy performance, tech investing
Pillar
JP Morgan
Saved
The slide features three sets of vertical column charts, color-coded in blue and yellow to distinguish between merchants’ anticipated usage increase and maintenance in digital services and tools in Indonesia.
Market Analysis and Trends
Technology & Software
Depicts Indonesian digital merchants' reliance on digital platforms, financial services, and tools, anticipating increased tech adoption.
Indonesia, Digital Merchants, Tech-Savvy, Future Trends, Digital Tools, Usage Increase, Financial Services
Multiple Chart
Bain
Saved
Contains a flowchart summarizing the steps taken to identify and implement eco-design options for ground stations, from brainstorming to evaluation of solutions.
Product and Service Analysis
Environmental Services & Sustainability
Describes the methodology used in reducing environmental impacts of ground stations through eco-design, involving multiple stakeholders and solution assessments.
eco-design, environmental impact, ground stations, mitigation, flowchart, brainstorming, solution assessment, sustainability
Linear Flow
Deloitte
Saved
Previous
Next
If nothing, comes up, please save your slides first
Create a FREE account to continue browsing
Receive Instant Access to 1,000+ slides from companies like McKinsey, Google, and Goldman Sachs
First Name
Last Name
Email
Password
I agree to all
Terms & Privacy Policy
Thank you! Your submission has been received!
Oops! Something went wrong while submitting the form.
Have an account?
Sign in
Column Chart
Heatmap
Chevron
Org Chart
Infographic
Callouts
Timeline
List
Graphic
Picture
Process Flow
Diagram
Paragraph
Map
Table
Framework
Subtitle
Takeaway Box
Icon
Other Chart
Radar Chart
Waterfall Chart
Mekko Chart
Pie Chart
Scatter Plot
Line Chart
Bar chart
Bullet points