My Account
My Slides
Search by Category
Templates
Leave Feedback
Login
Logout
Get Started
Browse all Slides
Browse all Slides
Create a FREE Account
Instant access to 1,000+ real slides from top companies like McKinsey, BCG, Goldman Sachs, Google and many more!
First Name
Last Name
Email
Password
I agree to all
Terms & Privacy Policy
Thank you! Your submission has been received!
Oops! Something went wrong while submitting the form.
Have an account?
Sign in
Saved Slides
The slide has stacked bar graphs representing leaders' economic outlook and expectations for the year ahead, including revenue, profit, and capital expenditure projections.
Financial Performance
Financial Services
Displays business leaders' sentiments on the global and national economic prospects and their company’s performance, indicating general optimism for sales and profits amidst a cautious economic view.
Economic Outlook, Performance, Profit, Sales
Multiple Chart
JP Morgan
Saved
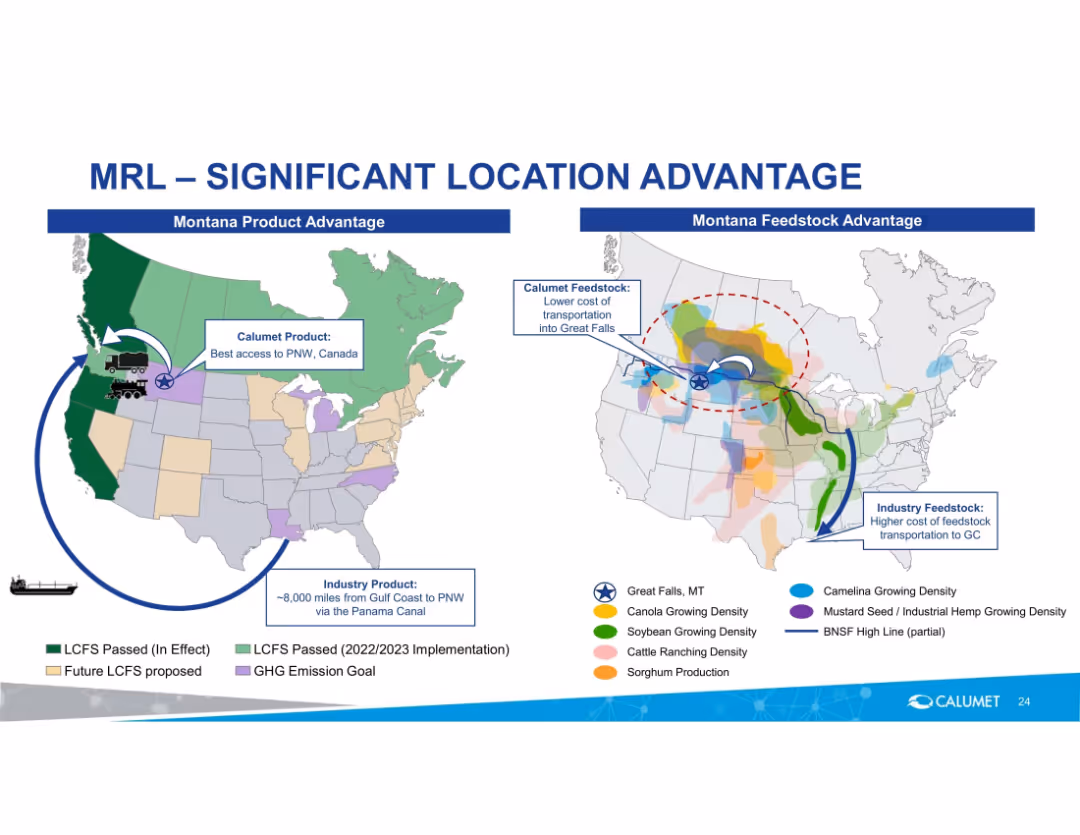
Side-by-side U.S. maps with product and feedstock advantage overlays; icons for transport/logistics.
Strategic Planning
Energy & Utilities
Shows Montana Renewables’ locational advantage in product distribution and feedstock sourcing. Highlights shorter routes, cost advantages, and favorable policy zones for the company versus competitors.
logistics, feedstock, Montana, PNW access, Calumet, LCFS, renewable fuel, location advantage, transport cost
Multiple Chart
Goldman Sachs
Saved
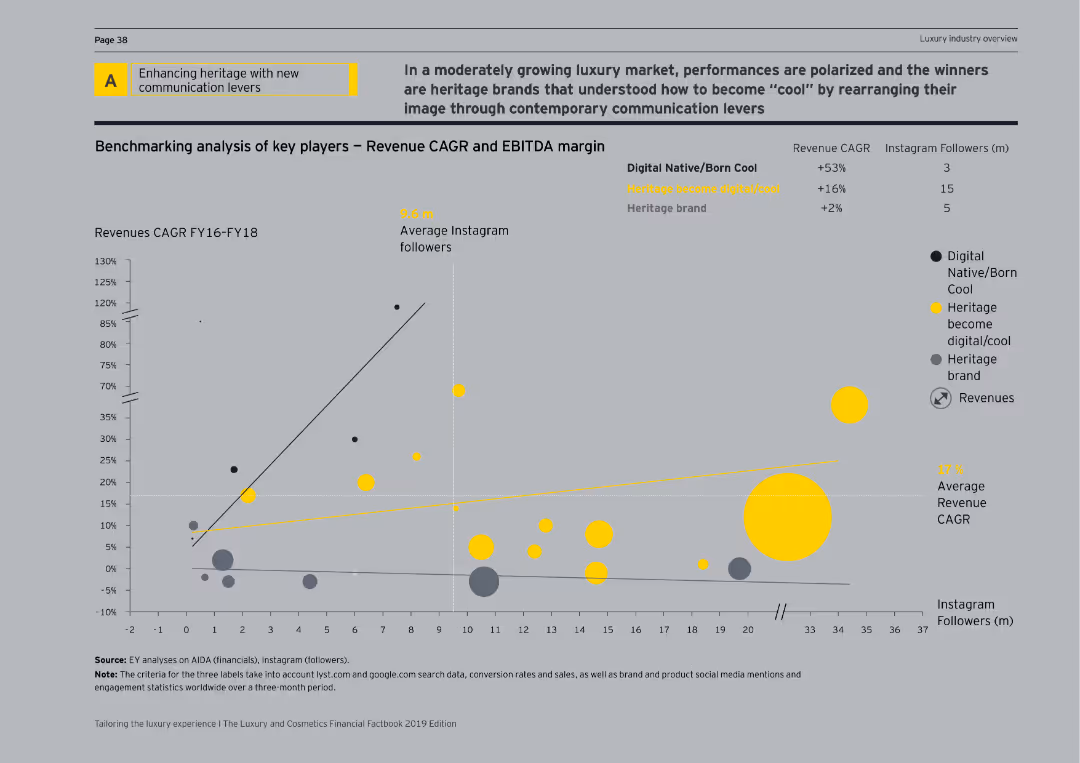
Contains a scatter plot showing revenue CAGR and EBITDA margin, along with Instagram followers for digital native, heritage, and hybrid brands.
Strategic Planning
Media & Entertainment
Analyzes key players in the luxury market, comparing their revenue growth, EBITDA margins, and social media influence to drive strategic planning.
benchmarking, revenue CAGR, EBITDA margin, Instagram followers, digital native, heritage brand, hybrid brand, scatter plot, strategic planning
Single Chart
EY
Saved
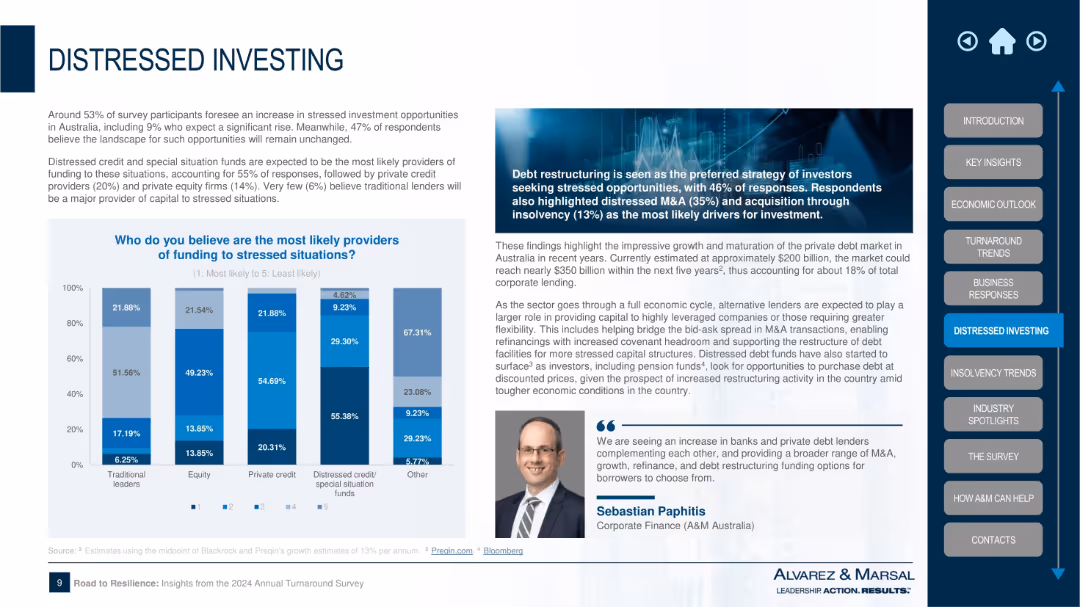
Left-aligned bar chart with funding sources, right-aligned text box with insights and expert quote; image banner and dark theme box top
Investment Analysis
Financial Services
This slide examines likely sources of funding in distressed situations, with distressed credit and private credit as key providers. It highlights debt restructuring as a major investment strategy, with M&A and acquisitions also playing a role. Commentary underscores the growth in private credit markets.
distressed investing, debt restructuring, private credit, M&A, insolvency, funding sources, investment strategy, special situation funds, capital
Mixed Chart
Alvarez & Marsal
Saved
This slide uses a table format to present examples of industry players in Web3, with a column for industry, example, and description. The design is straightforward with a white background and colored icons for visual differentiation.
Industry Overview
Technology & Software
Provides examples of influential companies and initiatives within various industries that are leveraging Web3 technologies, such as the USDF consortium in financial services and Nike's acquisition in gaming.
Industry Players, Web3, Innovation, Case Studies
Header Vertical
McKinsey
Saved
The slide includes multiple data visualizations and text blocks explaining population trends towards 2050, with a focus on changes in global demographics, emphasizing less developed countries.
Market Analysis and Trends
Government & Public Sector
This slide elaborates on future population trends, emphasizing growth in less developed countries and aging populations in developed ones. It includes specific projections for regions like Sub-Saharan Africa and demographic shifts by 2050.
population, aging, development, Africa, demographics
Linear Flow
Roland Berger
Saved
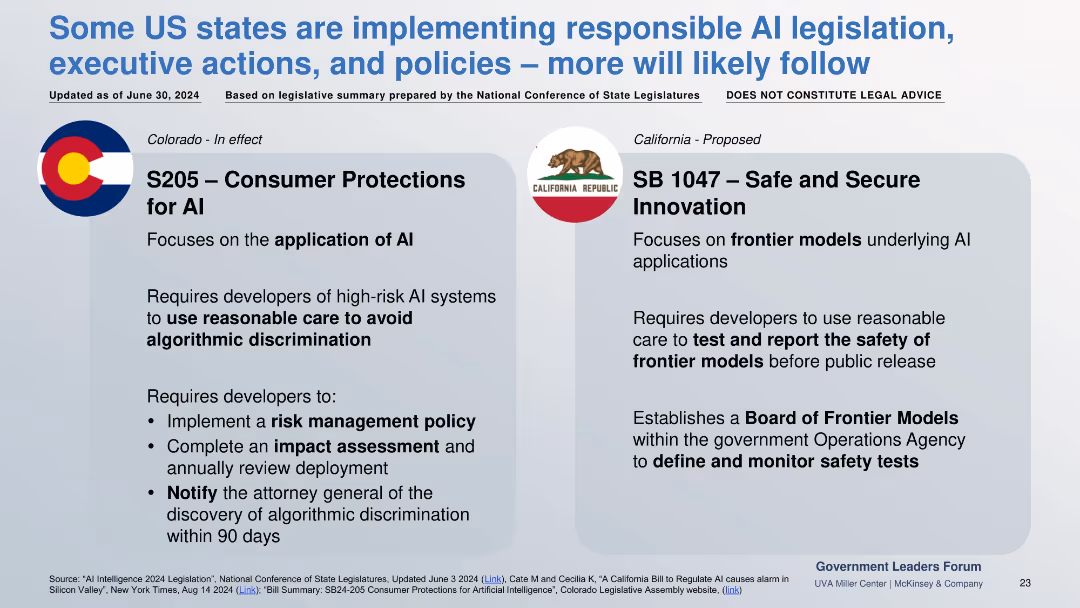
Two-column comparison of enacted (Colorado) and proposed (California) AI laws, each with regulatory focus and developer requirements.
Regulatory and Compliance
Government & Public Sector
Focuses on U.S. state-level AI laws. Colorado mandates discrimination risk controls in AI applications; California proposes safety testing and oversight for frontier models.
US AI law, frontier models, algorithmic bias, risk policy, S205, SB1047
Pillar
McKinsey
Saved
Contains a large column chart detailing the yearly trends in mortgage inquiries.
Market Analysis and Trends
Financial Services
Analyzes the trends in mortgage inquiries over the years, highlighting significant decreases and their implications for the market.
Mortgage, Trends, Market, Analysis, Inquiries
Single Chart
Barclays
Saved
This slide features no visual data but offers a text-heavy approach with bulleted lists for clarity on recommendations related to gender equality in the workplace.
Strategic Planning
Professional Services
Provides a summary of recommendations for organizations to improve gender equality, focusing on core enablers. It could be used as a closing slide in strategic meetings focused on diversity and inclusion or as a standalone reference in educational settings on corporate governance.
recommendations, gender equality, workplace, strategy
Multiple Chart
Deloitte
Saved
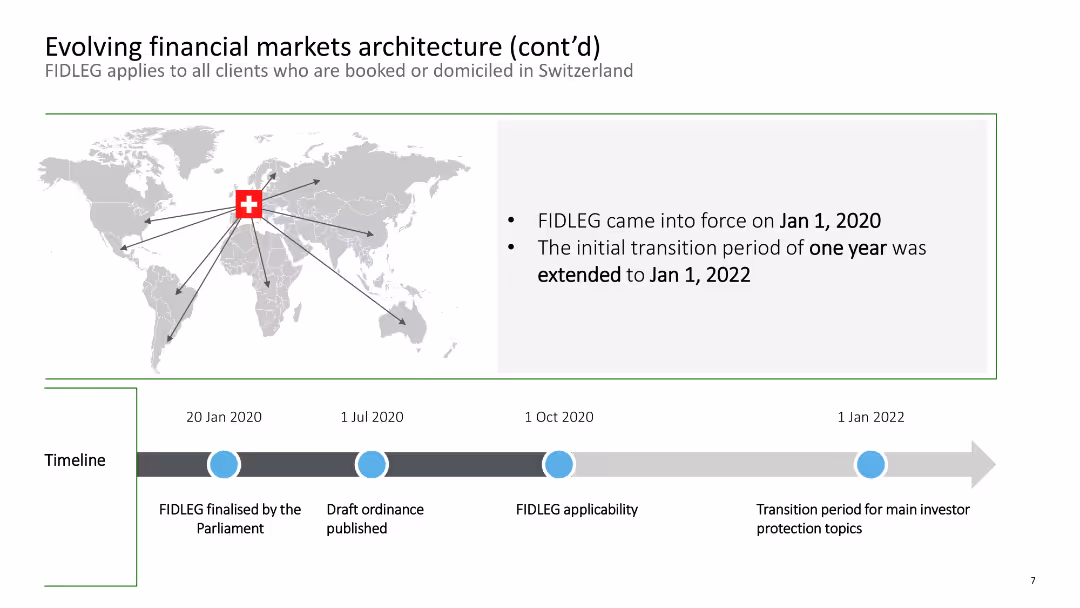
This slide features a world map with a timeline of the FIDLEG implementation phases affecting Swiss-domiciled clients.
Regulatory and Compliance
Financial Services
It provides a timeline of the FIDLEG regulatory changes impacting clients booked or domiciled in Switzerland, including key implementation dates from 2020 to 2022.
FIDLEG, timeline, regulatory, Swiss, financial markets
Linear Flow
Deloitte
Saved
The slide features a donut chart showing responses to a question about the relationship between interest rates and bond prices, with breakdowns of correct and incorrect answers. The layout is moderately complex.
Performance Metrics and KPIs
Financial Services
This slide assesses knowledge about the impact of interest rates on bond prices, showing mixed understanding among Canadians. It aims to evaluate public knowledge on financial concepts.
interest rates, bond prices, knowledge, financial, Canadians
Single Chart
IPSOS
Saved
A pie chart indicates client coverage across sectors and a parallel comparative table shows global league table rankings from 2010 to 2019. It's visually clean with a light blue theme and organized layout.
Market Analysis and Trends
Financial Services
This slide highlights Goldman Sachs' market leadership and consistent performance over time, contrasting rankings in various financing activities, aimed at market analysts or potential clients to demonstrate the firm's competitive positioning.
Market leadership, client coverage, financial rankings, performance, Goldman Sachs
Framework
Goldman Sachs
Saved
Slide is text-heavy with bullet-point recommendations for organizations on climate action. Features three circular green icons, representing different strategies like frameworks, plans, and education.
Strategic Planning
Environmental Services & Sustainability
Provides strategic recommendations for organizations aiming to enhance their environmental sustainability efforts, including planning, education, and framework adoption.
Climate Action, Strategic Recommendations, Sustainability, Organizational Planning, Education, Frameworks
Header Vertical
Deloitte
Saved
Slide shows a line chart with a stability in the integration effectiveness of customer data across channels, with industry comparisons.
Technology and Digital Transformation
Professional Services
Reviews the ongoing challenge of integrating customer data across channels, relevant for risk assessment and digital transformation in tech and healthcare.
customer data, integration, technology, healthcare, digital transformation, risk assessment, challenge, stability
Mixed Chart
Deloitte
Saved
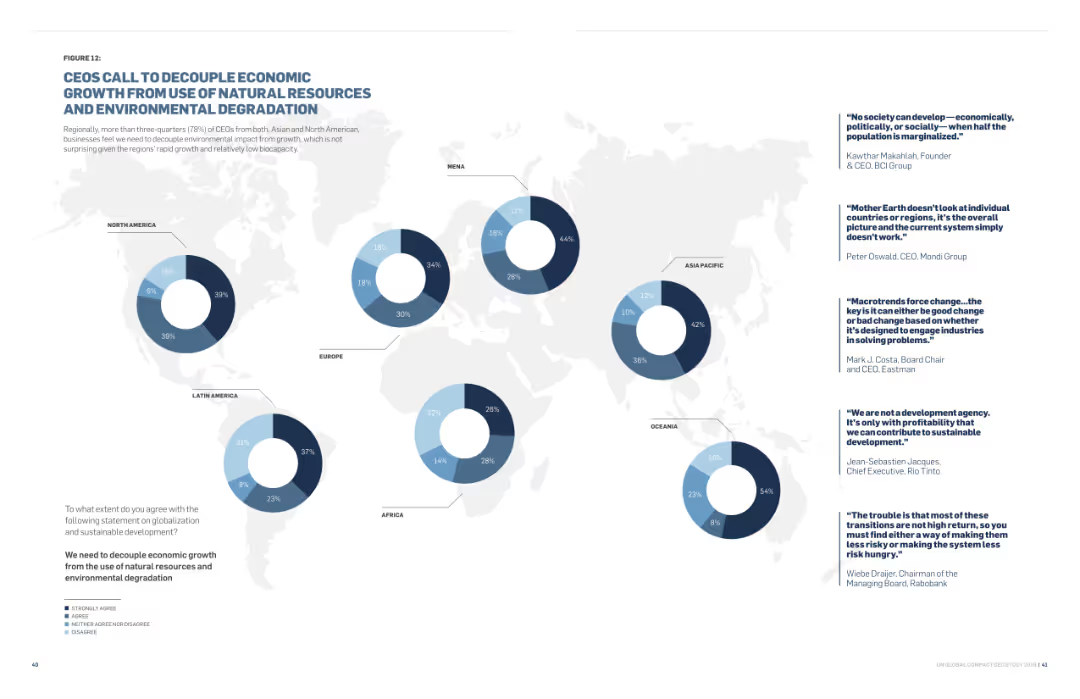
The slide features text and a world map with pie charts showing regional survey data. Quotes from various CEOs are also included.
Regulatory and Compliance
Environmental Services & Sustainability
This slide discusses CEOs' calls to decouple economic growth from environmental degradation, highlighting regional perspectives and CEO quotes on sustainability.
Economic Growth, Natural Resources, Environmental Degradation, Regional Data, Sustainability, CEOs
Multiple Chart
Accenture
Saved
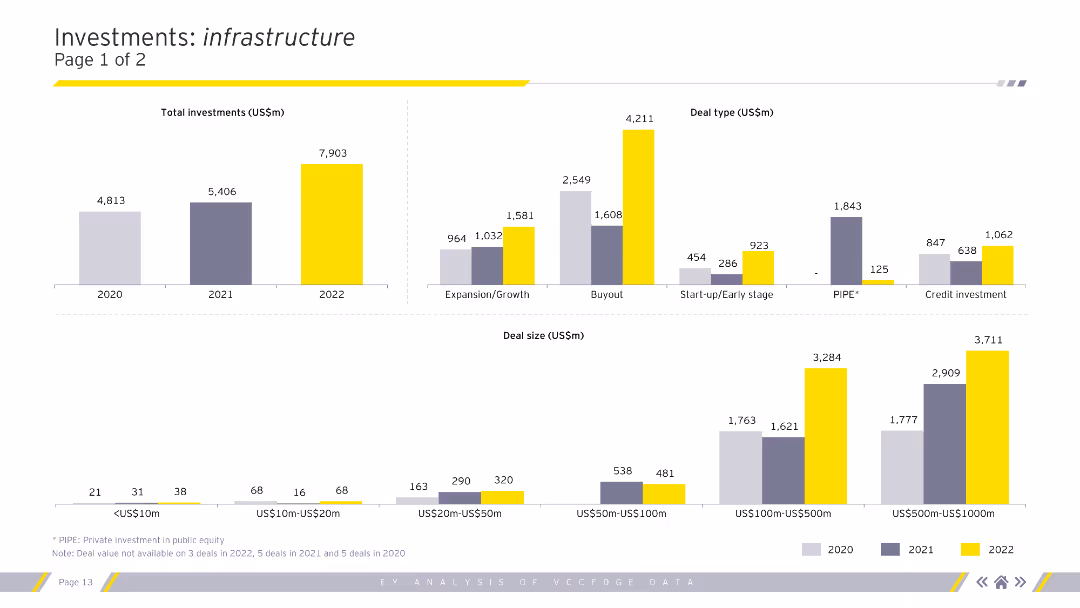
Column charts showing total investments, deal types, and deal sizes in the infrastructure sector for 2020-2022.
Market Analysis and Trends
Real Estate & Construction
Analysis of investment types, sizes, and segments within the infrastructure sector.
infrastructure, investments, deal types, deal sizes, analysis
Multiple Chart
EY
Saved
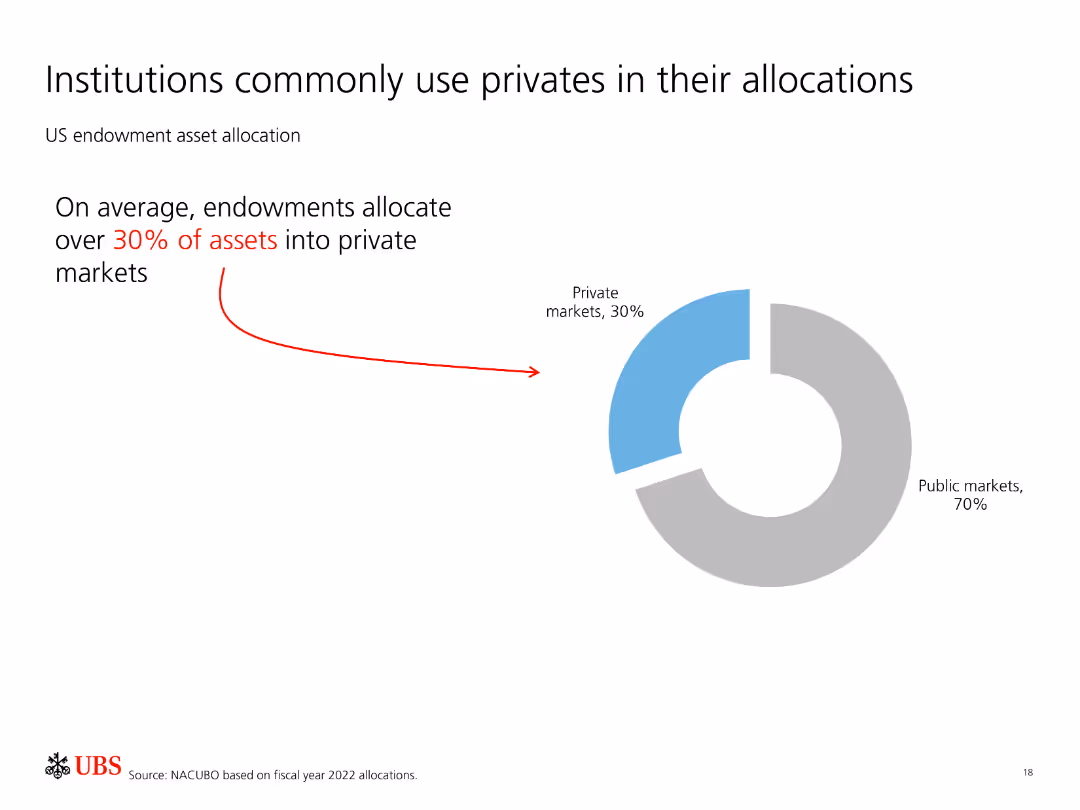
Features a pie chart showing US endowment asset allocation with 30% in private markets and 70% in public markets.
Investment Analysis
Financial Services
Indicates that institutions, particularly endowments, allocate a significant portion of their assets (30%) to private markets, demonstrating confidence in their performance.
Institutions, private markets, asset allocation, endowments, investment strategy
Mixed Chart
UBS
Saved
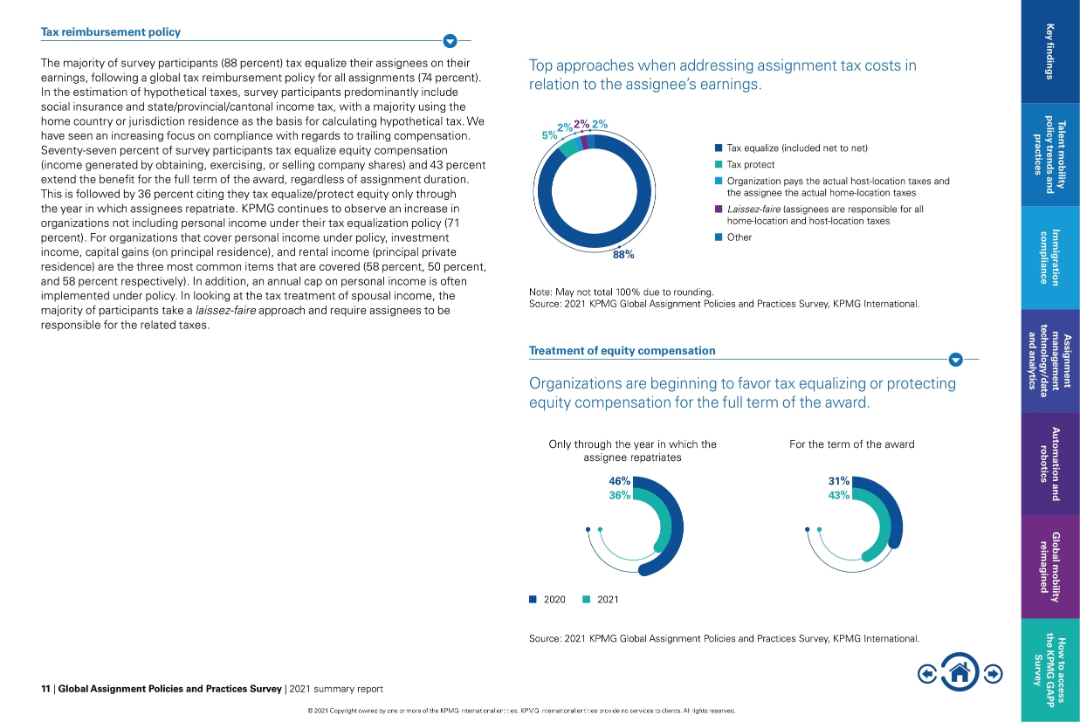
Left-heavy text panel with explanatory text; right side contains donut charts and dual-year bar charts.
Regulatory and Compliance
Financial Services
Describes how organizations manage tax reimbursement for assignees, showing 88% use tax equalization. Discusses equity compensation treatment trends and highlights a shift towards full-term protection of awards rather than just through repatriation.
tax equalization, equity compensation, global assignments, tax policy, compliance, KPMG, expat tax treatment
Multiple Chart
KPMG
Saved
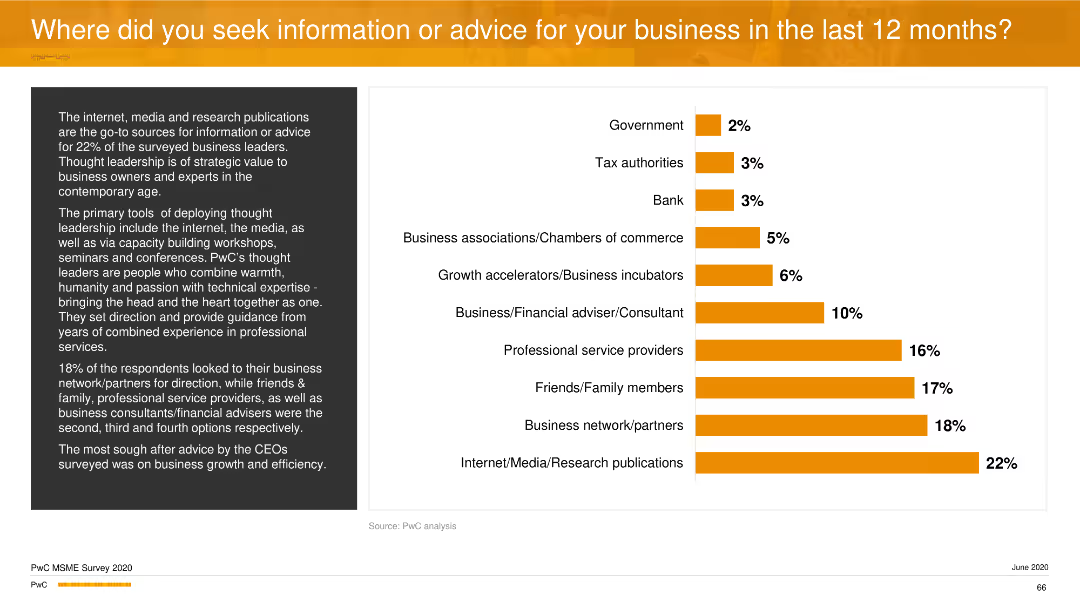
A column chart showing sources of information or advice sought by businesses, with categories like government, tax authorities, banks, and others. Orange bars indicate the percentage for each category.
Strategic Planning
Professional Services
This slide outlines the sources of advice or information that businesses relied on in the past year, with internet/media/research publications being the top sources, followed by business networks and partners.
information sources, strategic planning, advice, professional services, column chart
Mixed Chart
PwC/Strategy&
Saved
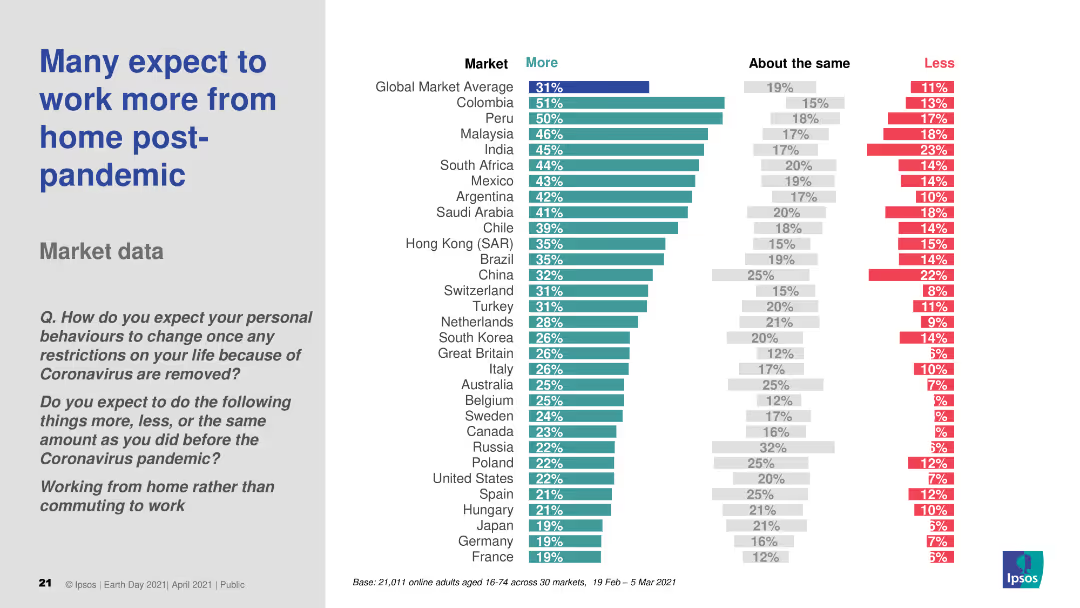
The slide features a column chart illustrating expected changes in work-from-home behavior across various markets post-pandemic. It uses three color bars for "More," "About the same," and "Less." The text includes a question and survey details.
Market Analysis and Trends
Professional Services
The slide shows survey results on the expected increase in work-from-home practices after pandemic restrictions are lifted, comparing responses across different global markets.
work-from-home, post-pandemic, market data, survey, behavior change
Multiple Chart
IPSOS
Saved
Bar graphs showing the average number of online purchases in various categories from 2021 to 2022 with a clear decline.
Market Analysis and Trends
Retail & E-commerce
Analyzes the decrease in online purchase frequency for various product categories, offset by an increase in categories like household appliances and beauty.
online purchases, frequency decline, product categories, household, beauty
Multiple Chart
Bain
Saved
Features icons representing various industries arranged in a grid format. Each icon is labeled, and the slide uses a minimalist design with light colors.
Competitive Landscape
Professional Services
Displays Alvarez & Marsal's industry expertise across multiple sectors such as healthcare, automotive, and financial services. This slide is useful for showcasing the firm's wide-ranging capabilities and areas of operation.
industry expertise, automotive, healthcare, financial services, consulting
Table
Alvarez & Marsal
Saved
A table outlines the top criteria LGBT+ talents consider when choosing an employer in various countries.
Human Resources and Talent Management
Professional Services
Prioritizes the aspects most important to LGBT+ talents in their employment decisions.
LGBT+, employment criteria, employer choice, top criteria
Table
BCG
Saved
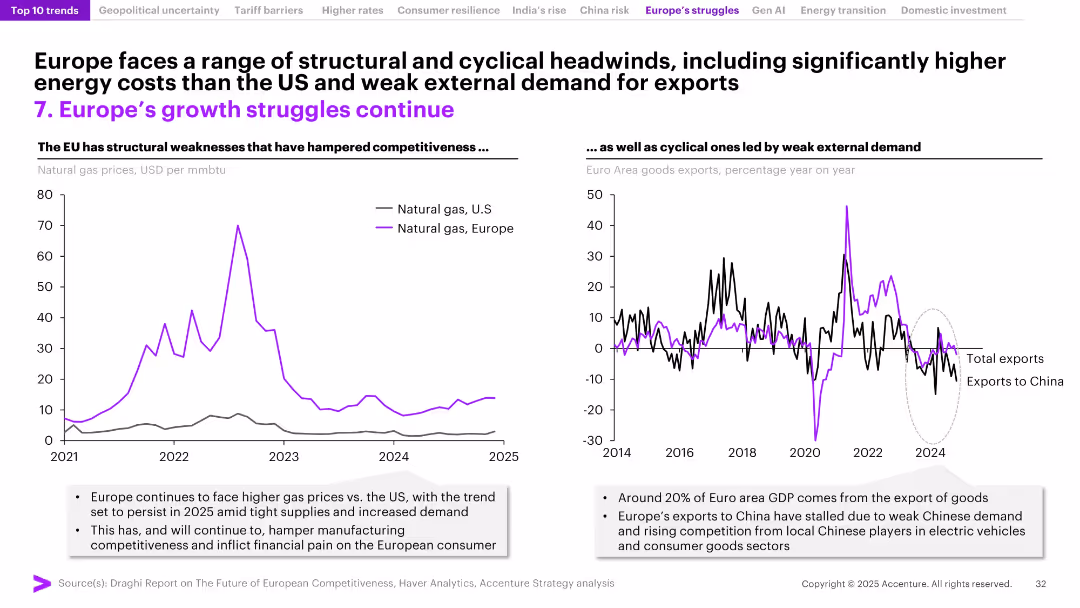
Two-panel layout: natural gas price comparison (US vs. Europe) and export trends chart (total vs. China); visual focus on cyclical and structural issues.
Market Analysis and Trends
Energy & Utilities
The slide outlines Europe's competitiveness challenges stemming from high energy costs and declining exports, particularly to China. It explains how structural inefficiencies, including energy price disparities with the US, undermine Europe’s manufacturing base and export performance.
Europe economy, energy prices, exports, competitiveness, manufacturing, natural gas, trade deficit, structural weakness, China, Eurozone
Multiple Chart
Accenture
Saved
Column chart displaying asset and liability composition. Layout is clean, with each chart and graph clearly labeled.
Financial Performance
Financial Services
Overview of company's assets and liabilities at the end of the year, useful for financial analysis and understanding company structure.
assets, liabilities, financial stability, balance sheet, equity
Multiple Chart
Deutsche Bank
Saved
Previous
Next
If nothing, comes up, please save your slides first
Create a FREE account to continue browsing
Receive Instant Access to 1,000+ slides from companies like McKinsey, Google, and Goldman Sachs
First Name
Last Name
Email
Password
I agree to all
Terms & Privacy Policy
Thank you! Your submission has been received!
Oops! Something went wrong while submitting the form.
Have an account?
Sign in
Column Chart
Heatmap
Chevron
Org Chart
Infographic
Callouts
Timeline
List
Graphic
Picture
Process Flow
Diagram
Paragraph
Map
Table
Framework
Subtitle
Takeaway Box
Icon
Other Chart
Radar Chart
Waterfall Chart
Mekko Chart
Pie Chart
Scatter Plot
Line Chart
Bar chart
Bullet points