My Account
My Slides
Search by Category
Templates
Leave Feedback
Login
Logout
Get Started
Browse all Slides
Browse all Slides
Create a FREE Account
Instant access to 1,000+ real slides from top companies like McKinsey, BCG, Goldman Sachs, Google and many more!
First Name
Last Name
Email
Password
I agree to all
Terms & Privacy Policy
Thank you! Your submission has been received!
Oops! Something went wrong while submitting the form.
Have an account?
Sign in
Saved Slides
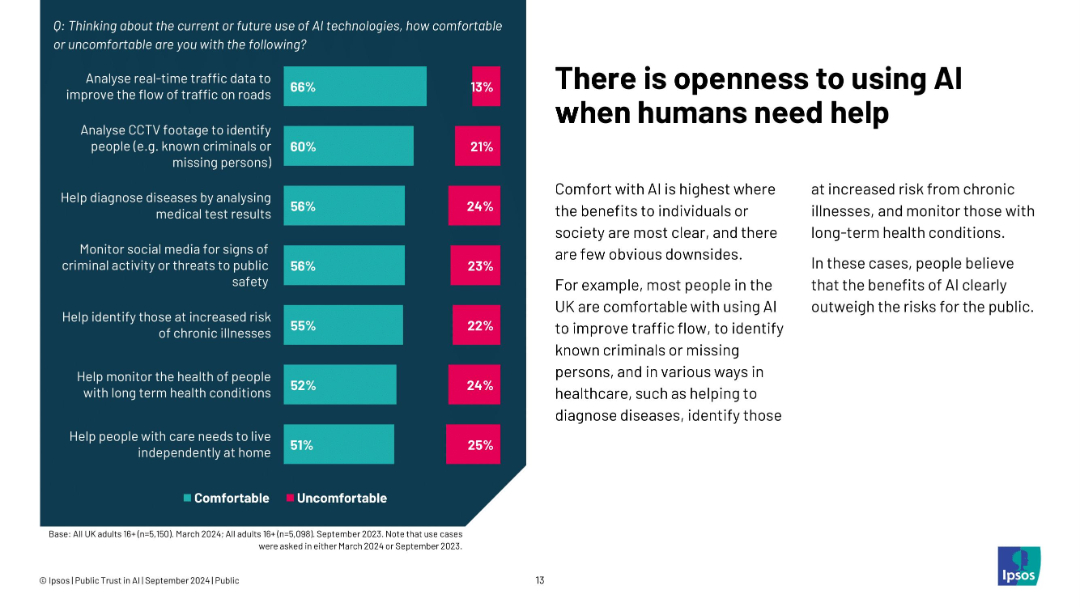
Two-column layout; left: chart showing comfort with specific AI uses; right: explanation of comfort reasons
Product and Service Analysis
Artificial Intelligence
The slide shows that the public is most open to AI applications where it provides tangible help—like health diagnostics, crime prevention, or traffic optimization. Public comfort increases when benefits clearly outweigh risks, particularly in healthcare and safety.
healthcare AI, public comfort, Ipsos, social value, diagnostic tools, AI applications, helpful technology
Mixed Chart
IPSOS
Saved
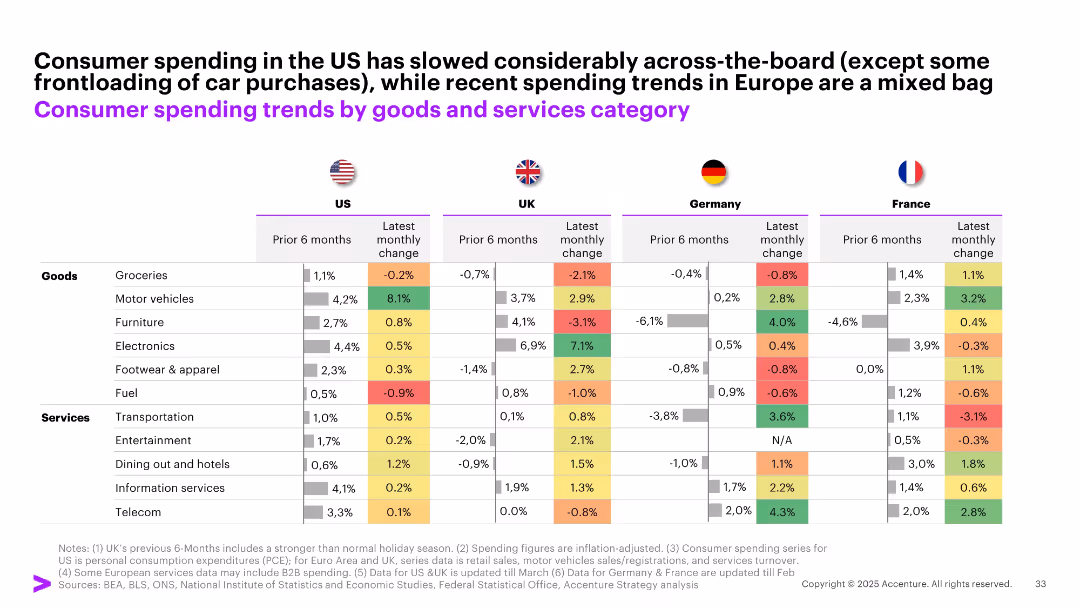
Comparative table with color-coded cells across 4 countries (US, UK, Germany, France), showing 6-month and latest monthly spending change by category.
Performance Metrics and KPIs
Consumer Goods
The slide offers a detailed breakdown of consumer spending shifts by category (goods vs. services) across the US and key European markets, highlighting mixed patterns and some volatility in recent monthly trends.
spending trends, goods vs services, US, UK, France, Germany, monthly change, consumption, inflation-adjusted
Single Chart
Accenture
Saved
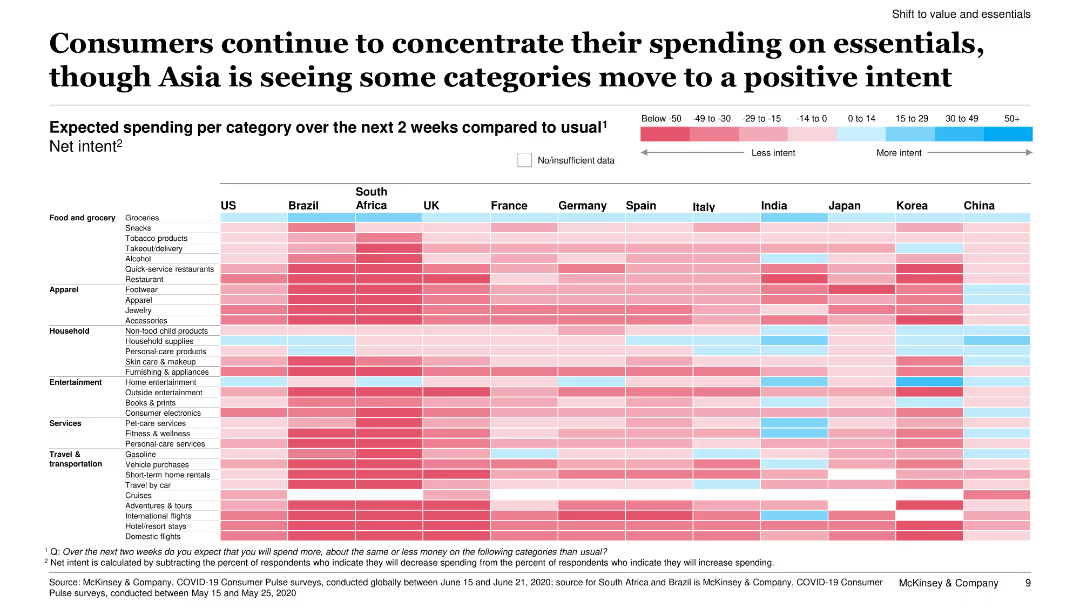
This slide features a heatmap chart showing expected spending per category over the next two weeks compared to usual, across various countries.
Market Analysis and Trends
Retail & E-commerce
The slide analyzes expected consumer spending by category over the next two weeks, noting a concentration on essentials and some positive intent in Asian countries.
consumer spending, essentials, Asia, positive intent, heatmap, spending categories, survey, next two weeks, comparison
Table
McKinsey
Saved
Features a bar graph and key numerical highlight with color coding to differentiate countries. The design is clean and focuses on data presentation.
Market Analysis and Trends
Technology & Software
This slide compares the percentage of internet users who have made purchases online across different SEA countries, useful for analyzing e-commerce trends.
digital consumers, SEA, online shopping, internet usage, country comparison, e-commerce trends
Single Chart
Bain
Saved
This slide displays a large, central pie chart with vibrant colors, surrounded by smaller high-quality images of buildings. The chart highlights the proportion of companies planning to invest in real estate despite market volatility, which is visually emphasized by the use of contrasting colors.
Investment Analysis
Real Estate & Construction
It captures the strategic decisions companies are making regarding real estate investments in light of inflation and interest rate changes. The chart is used to represent the distribution of different strategic choices, indicating a significant tilt towards investment, and is useful for discussions on market responses.
Investment Strategy, Real Estate, Inflation, Interest Rates, Market Trends
Single Chart
EY
Saved
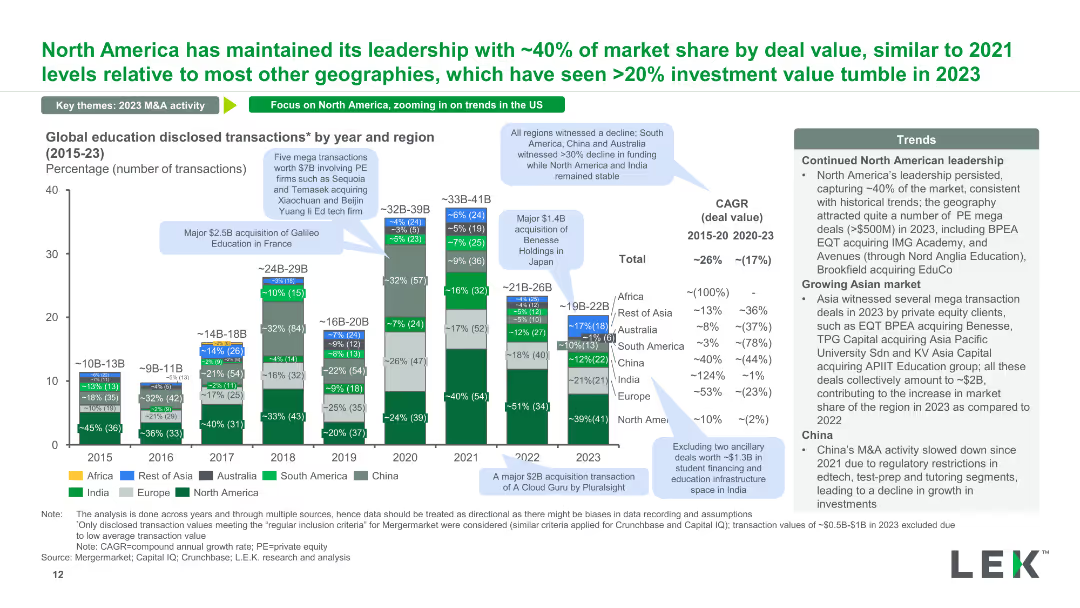
A stacked column chart displaying the number of global education disclosed transactions by year and region from 2015 to 2023. Annotations provide context on significant transactions and regional trends.
Market Analysis and Trends
Education & Training
This slide shows the distribution of disclosed transactions in the education sector across different regions over time, highlighting major deals and geographical trends in investment.
disclosed transactions, global education, regional trends, annual data, major deals
Mixed Chart
LEK
Saved
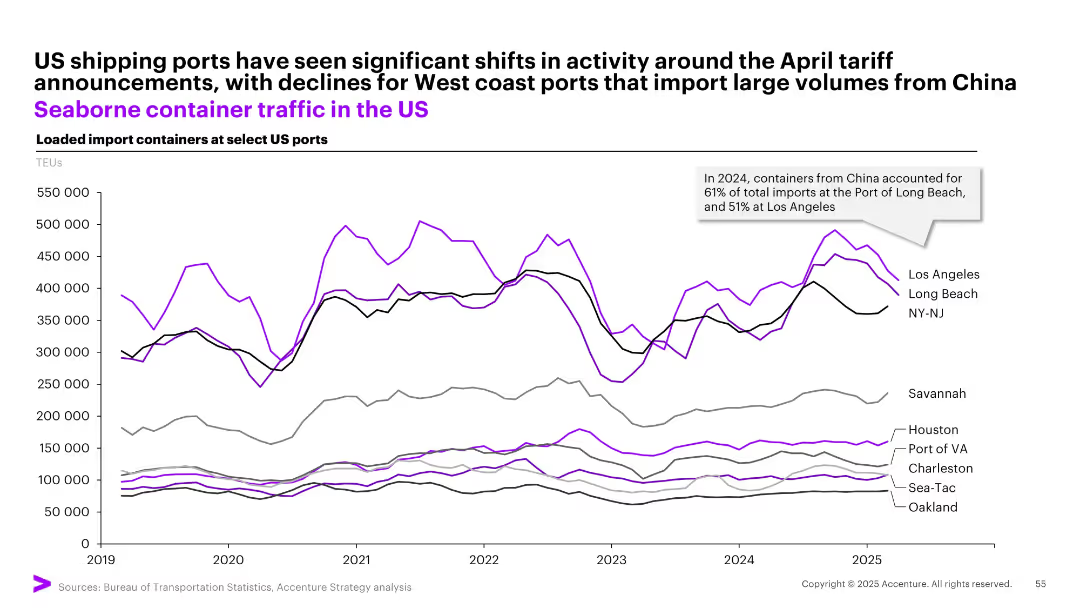
Multiline time-series graph showing TEUs of loaded imports at major US ports, color-coded by port.
Performance Metrics and KPIs
Transportation & Logistics
Depicts changes in import container volumes at key US ports from 2019–2025, noting a decline in West Coast ports due to April tariff shifts. Notes China's dominance in import origin volumes, with Long Beach and LA most affected.
shipping, TEU, tariffs, imports, China, ports, Long Beach, Los Angeles, NY-NJ, container traffic
Single Chart
Accenture
Saved
Three-column layout with icons and bold section titles, explaining strategies like data-driven planning and early risk identification.
Strategic Planning
Real Estate & Construction
Elaborates on the first action area from the previous slide: turning insight into foresight. It breaks down how organizations can improve planning through prioritizing risks, navigating uncertainty, and becoming data-driven.
foresight, early planning, risk mitigation, data-driven, uncertainty
Pillar
Accenture
Saved
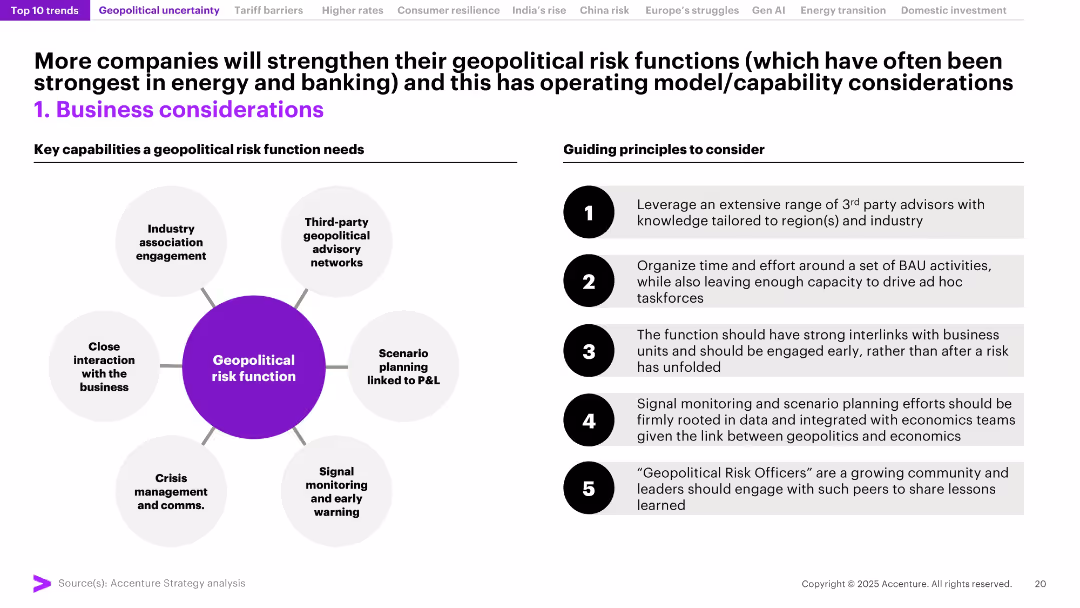
Split into two columns: left shows a circular diagram of risk function capabilities; right lists guiding principles in numbered blocks. Clean, process-oriented layout.
Risk Assessment and Management
Professional Services
The slide outlines the structure and best practices for building robust geopolitical risk functions in organizations. Emphasizes proactive scenario planning, crisis communication, and business integration, particularly relevant for banking and energy sectors.
Risk Management, Geopolitics, Scenario Planning, P&L, Crisis Comms, Business Strategy, Functions, Advisory Networks
Header Horizontal
Accenture
Saved
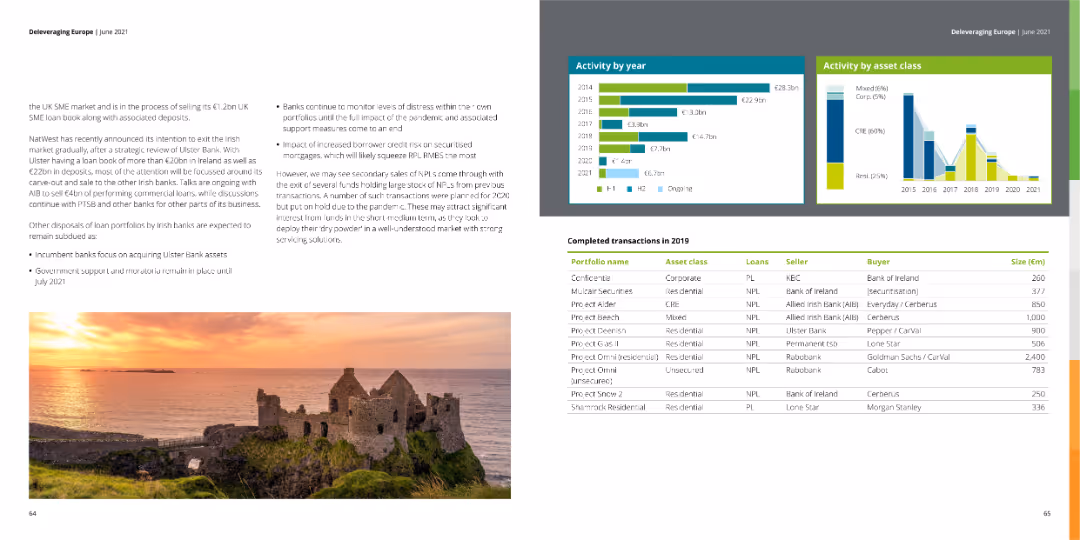
The slide shows column charts of activity by year and asset class, along with a table of completed transactions in 2019. An image of a scenic landscape is featured.
Market Analysis and Trends
Financial Services
This slide details the completed transactions in 2019 within the financial services industry, focusing on activity by year and asset class.
completed transactions, 2019, financial services
Multiple Chart
Deloitte
Saved
A slide with two sections identifying industries that could be most affected by space technology trends, with icons for visual emphasis.
Technology and Digital Transformation
Telecommunications
Identifies telecommunications and aerospace and defense as key industries affected by space tech, and explores emerging use cases across various sectors.
telecommunications, aerospace, defense, industry impact, space technology use cases
Boxed
McKinsey
Saved
Features an extensive flowchart diagram with different financial services offered by the firm, divided by client needs, and includes some numerical data points.
Organizational Structure and Change
Financial Services
Details the comprehensive offerings by the firm to support clients during IB transactions and the depth of relationships.
Collaboration, Franchise, Client Support, IB Transactions, Services Offering, Commercial Banking
Table
JP Morgan
Saved
This slide shows a combination of text and a column chart. The text explains the rationale for outsourcing, and the chart lists various capabilities being outsourced by percentage.
Operational Efficiency
Financial Services
The slide describes how APAC family offices are outsourcing capabilities like tax, risk, and technology to manage external demands and improve in-house capabilities.
outsourcing, capabilities, APAC, family offices, external expertise
Mixed Chart
EY
Saved
This slide shows a horizontal bar chart comparing the levelized cost of energy for renewable and conventional energy sources under different carbon pricing scenarios.
Regulatory and Compliance
Energy & Utilities
The slide evaluates the impact of carbon pricing on the cost competitiveness of various energy sources, highlighting the influence of carbon costs on renewable and conventional energy generation.
Carbon Pricing, Energy Costs, LCOE, Regulation, Comparison
Single Chart
Roland Berger
Saved
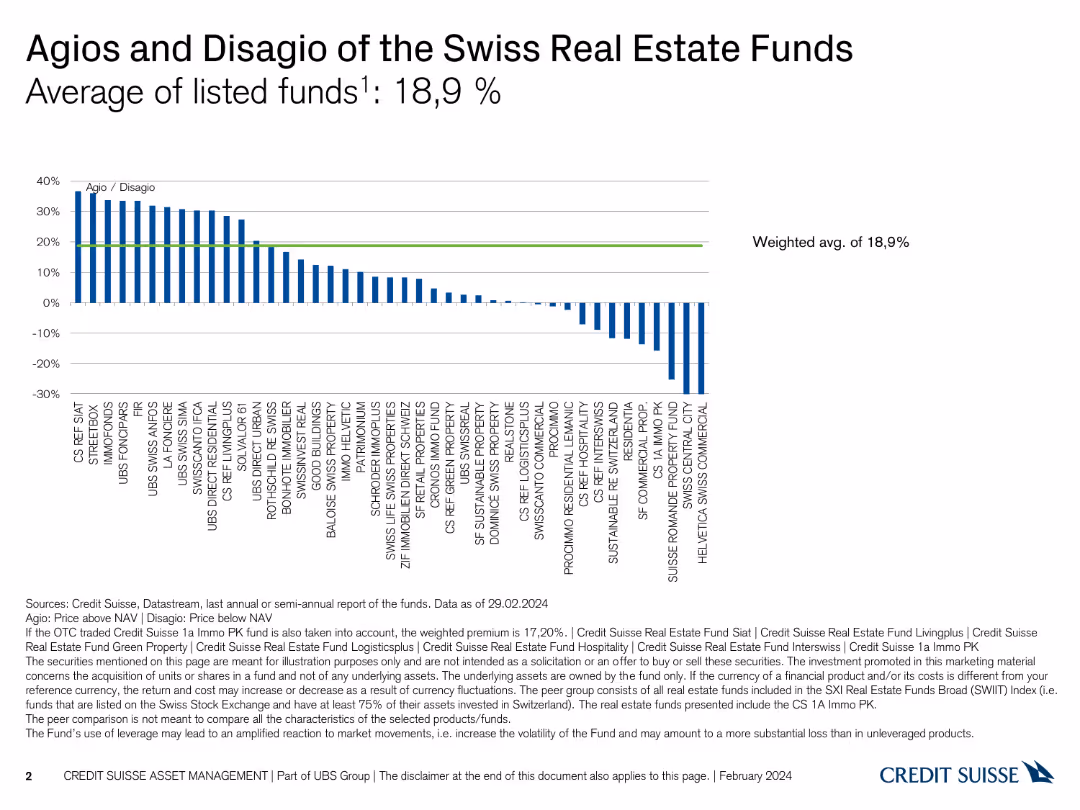
Column chart showing agios and disagios of various Swiss real estate funds, including a weighted average.
Market Analysis and Trends
Real Estate & Construction
Compares the premium and discount (agio/disagio) across listed Swiss real estate funds, providing a weighted average analysis.
Swiss real estate, agio, disagio, market analysis, funds
Single Chart
Credit Suisse
Saved
Contains a map of the U.S. with color-coded regions, table comparing the company to its peers, and a clear textual overview of assets, deposits, and loans.
Industry Overview
Financial Services
Overview of the company's financial standing, market position, and operational scope, suitable for introducing the company to stakeholders or for orientation purposes.
financial overview, market position, company scope, operational reach
Graphic
Goldman Sachs
Saved
Map visualization with icons and text describing a global survey of companies across various industries and regions.
Strategic Planning
Professional Services
Discusses the methodology behind a global survey aimed at evaluating company resilience across multiple regions and industries. It details the number of participants and the framework used in the survey.
global survey, methodology, industry analysis, resilience, market research
Graphic
Accenture
Saved
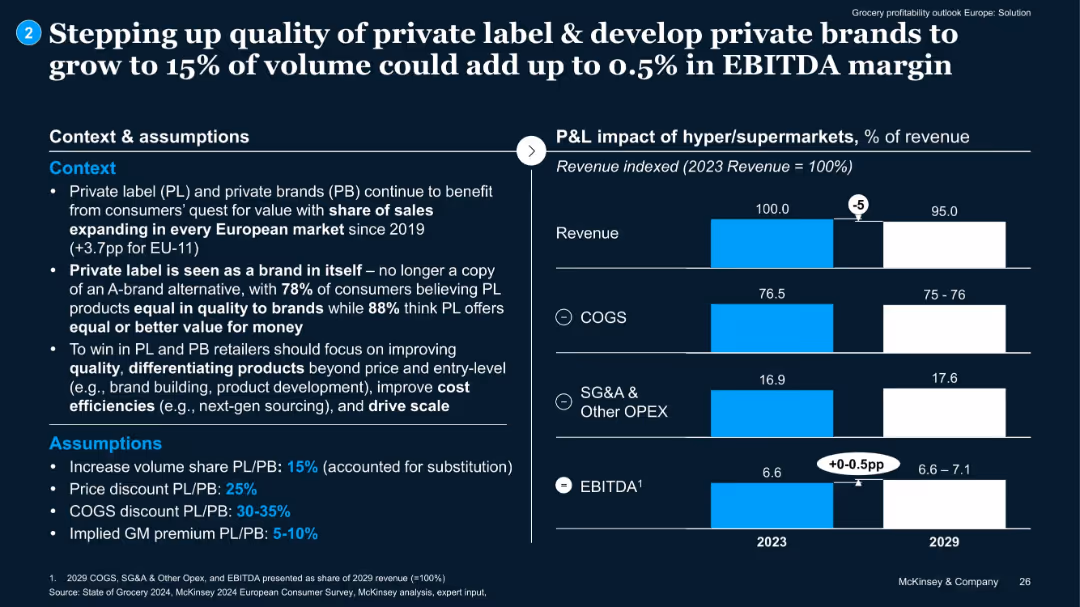
Split layout: text on left with context and assumptions; right side with bar chart comparing 2023 vs. 2029 P&L components.
Product and Service Analysis
Retail & E-commerce
Highlights that increasing private label share to 15% can add up to 0.5% EBITDA. Presents assumptions including discount rates and margin improvement. Emphasizes cost efficiency and quality improvements.
private label, EBITDA uplift, pricing, brand development, COGS
Mixed Chart
McKinsey
Saved
The slide features four icons representing different aspects of the future of transactions: Tokenization, Crypto (fiat), Separated (integrated), and Private (public).
Strategic Planning
Technology & Software
This slide outlines the vision for the evolution of transactions in a digital world, highlighting concepts such as tokenization, cryptocurrency, and the integration of public and private networks.
tokenization, cryptocurrency, public networks, digital evolution, strategic vision
Pillar
EY
Saved
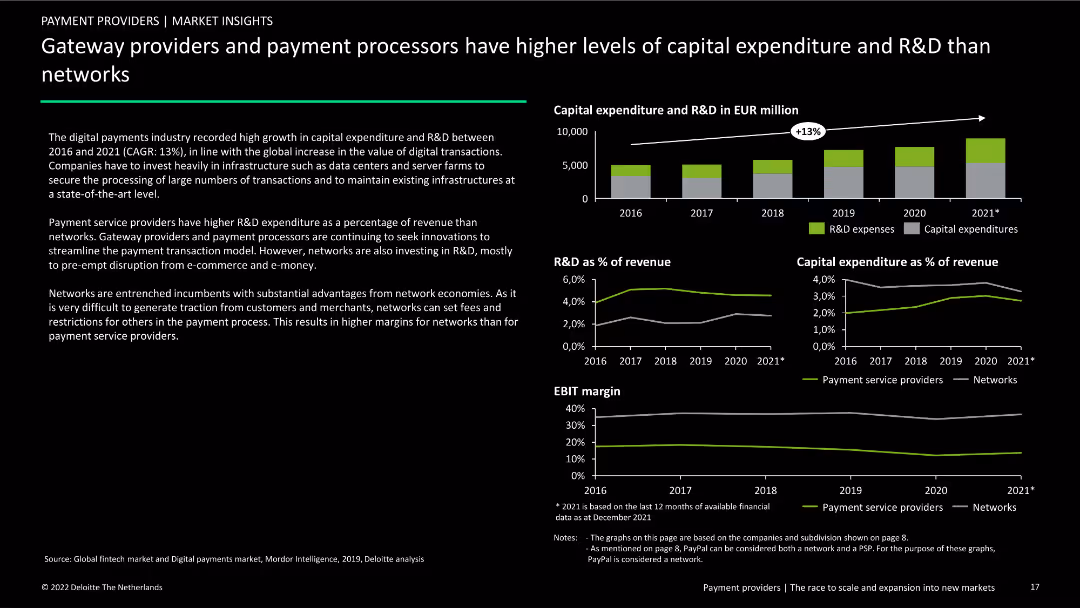
Contains three column charts and three line charts showing capital expenditure and R&D trends from 2016 to 2021. Includes text explaining differences between payment providers and networks.
Market Analysis and Trends
Financial Services
Analysis of capital expenditure and R&D trends in the digital payments industry, comparing gateway providers and payment processors to networks from 2016 to 2021.
capital expenditure, R&D, payment processors, gateway providers, networks, financial services, market analysis, trends, comparative analysis
Multiple Chart
Deloitte
Saved
The slide features a scatter plot showing growth rates for various IT segments, including infrastructure software, business process services, and consulting, with projected CAGR from 2020 to 2025.
Market Analysis and Trends
Technology & Software
The slide provides a comprehensive view of IT market growth, highlighting key segments such as infrastructure software and business process services, along with their projected growth rates.
IT market, growth, segments, infrastructure, software, business process, consulting, CAGR, 2020-2025
Single Chart
Gartner
Saved
The slide uses imagery of smartphones and a desktop to showcase digital banking tools, along with checklists and icons for services offered. It has a blue and white corporate design.
Product and Service Analysis
Financial Services
Details Chase's array of financial products and services tailored for small businesses, highlighting banking and cash management, lending, and merchant services. The slide is designed to analyze product offerings and digital banking services.
Financial products, Services, SMB, Chase, Digital banking, Cash management, Lending, Merchant services, Business tools, Analysis
Table
JP Morgan
Saved
Complex layout with flow charts and diagrams similar to slide 6091.
Market Analysis and Trends
Retail & E-commerce
Reiterates the methodology for retail sales calculations, combining various sources of revenue to assess total market sales.
retail, methodology, sales, market analysis, charts
Mixed Chart
Bain
Saved
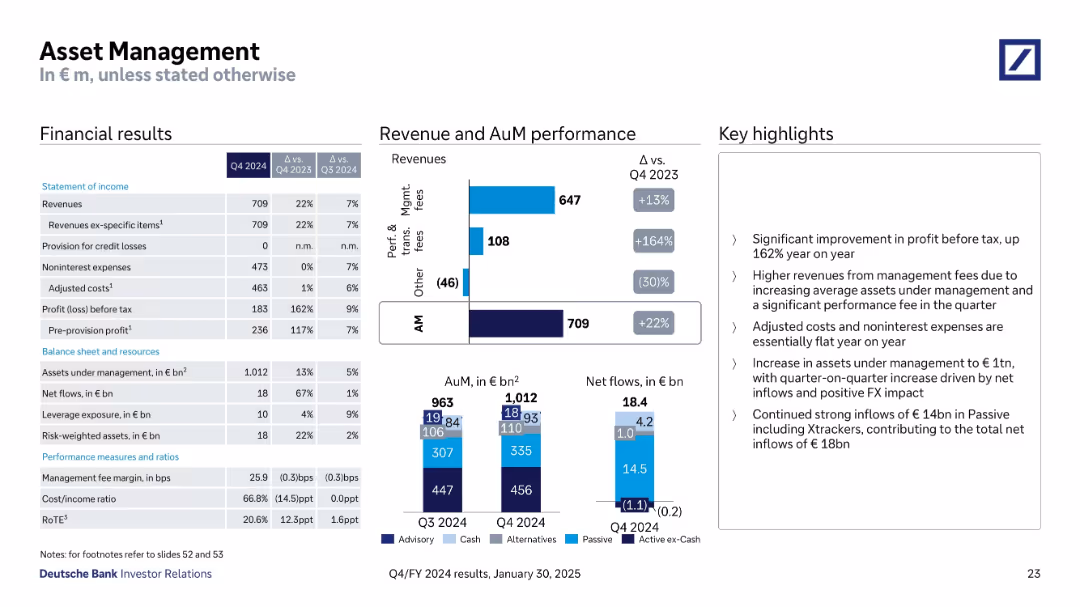
Structured with financial tables, stacked bar charts for AuM & net flows, and performance highlights
Financial Performance
Financial Services
The Asset Management division reported a 22% YoY increase in revenue, driven by strong net inflows and higher management and performance fees. Assets under management reached €1,012bn with inflows of €18.4bn. Adjusted costs remained flat, and profit before tax rose by 162% YoY.
Asset Management, AuM, Net Flows, Fees, Profit, Expenses, Inflows
Multiple Chart
Deutsche Bank
Saved
Displays a column chart plotting annual growth rates of the beauty market, using a gradient color scheme for visual clarity.
Market Analysis and Trends
Consumer Goods
Summarizes historical growth trends in the beauty industry and projects future growth rates.
beauty market, growth trends, historical data, future projections
Single Chart
Deutsche Bank
Saved
Previous
Next
If nothing, comes up, please save your slides first
Create a FREE account to continue browsing
Receive Instant Access to 1,000+ slides from companies like McKinsey, Google, and Goldman Sachs
First Name
Last Name
Email
Password
I agree to all
Terms & Privacy Policy
Thank you! Your submission has been received!
Oops! Something went wrong while submitting the form.
Have an account?
Sign in
Column Chart
Heatmap
Chevron
Org Chart
Infographic
Callouts
Timeline
List
Graphic
Picture
Process Flow
Diagram
Paragraph
Map
Table
Framework
Subtitle
Takeaway Box
Icon
Other Chart
Radar Chart
Waterfall Chart
Mekko Chart
Pie Chart
Scatter Plot
Line Chart
Bar chart
Bullet points