My Account
My Slides
Search by Category
Templates
Leave Feedback
Login
Logout
Get Started
Browse all Slides
Browse all Slides
Create a FREE Account
Instant access to 1,000+ real slides from top companies like McKinsey, BCG, Goldman Sachs, Google and many more!
First Name
Last Name
Email
Password
I agree to all
Terms & Privacy Policy
Thank you! Your submission has been received!
Oops! Something went wrong while submitting the form.
Have an account?
Sign in
Saved Slides
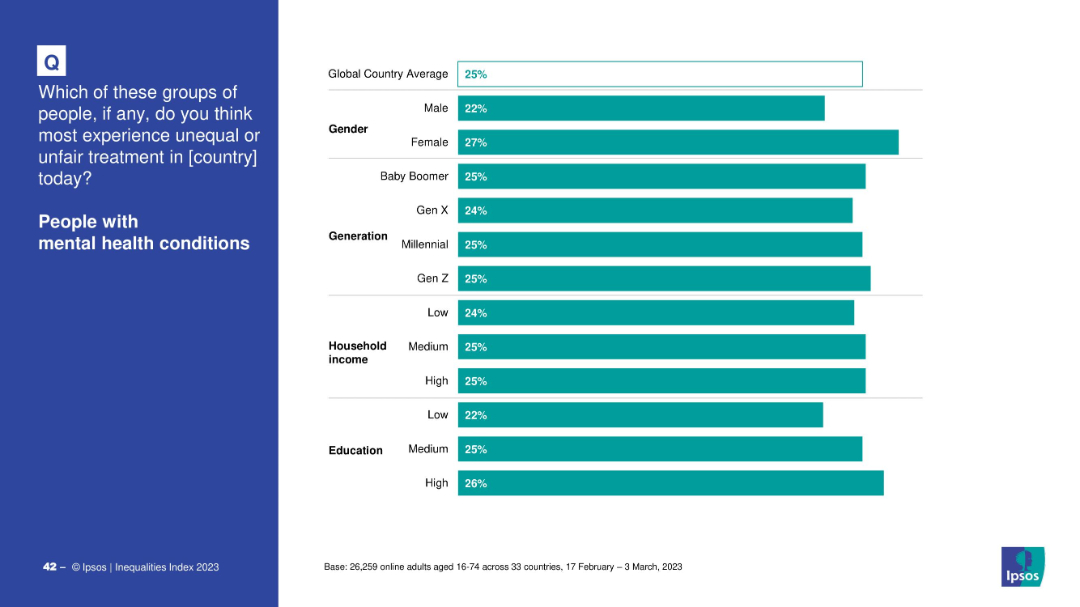
Same layout as others: demographic breakdown chart on right side.
Market Analysis and Trends
Healthcare & Pharmaceuticals
Survey responses are segmented by gender, generation, household income, and education to show varying perceptions of discrimination toward mental health issues.
mental health, demographics, income, gender, education, perception, inequality, Ipsos
Mixed Chart
IPSOS
Saved
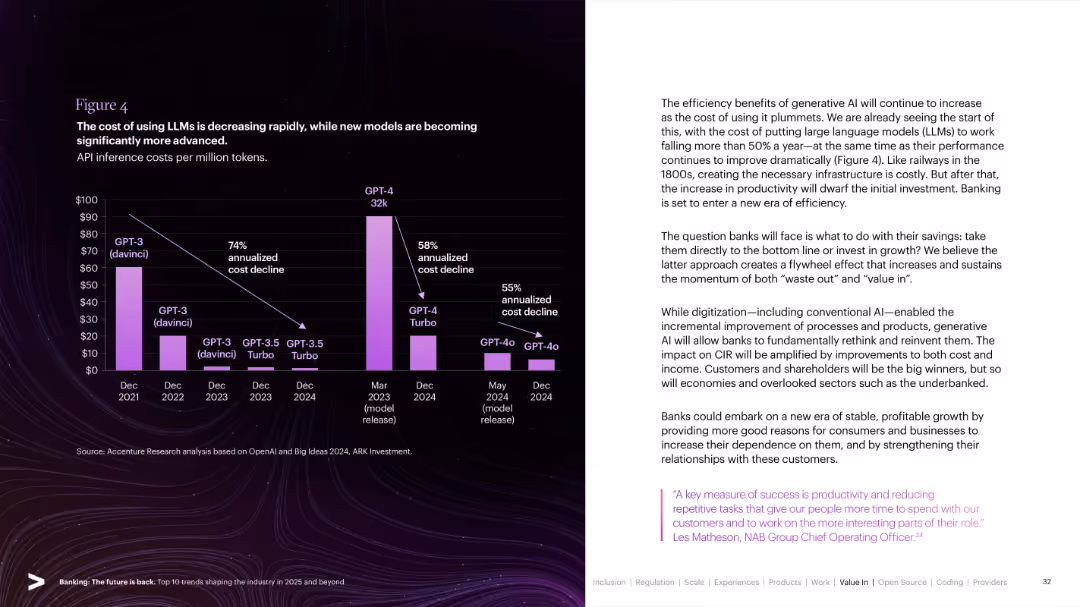
Bar chart over a dark background showing API cost decline of various LLMs (GPT-3, GPT-4 etc.). Explanatory text on the right.
Technology and Digital Transformation
Artificial Intelligence
Depicts the rapid reduction in API inference costs of large language models (LLMs) from 2021–2024, alongside advancements in model performance. Discusses how this cost efficiency drives productivity in banking and beyond.
LLM, GPT-4, Inference Cost, AI Efficiency, API Costs, AI Adoption, Banking Innovation, Digital Transformation
Mixed Chart
Accenture
Saved
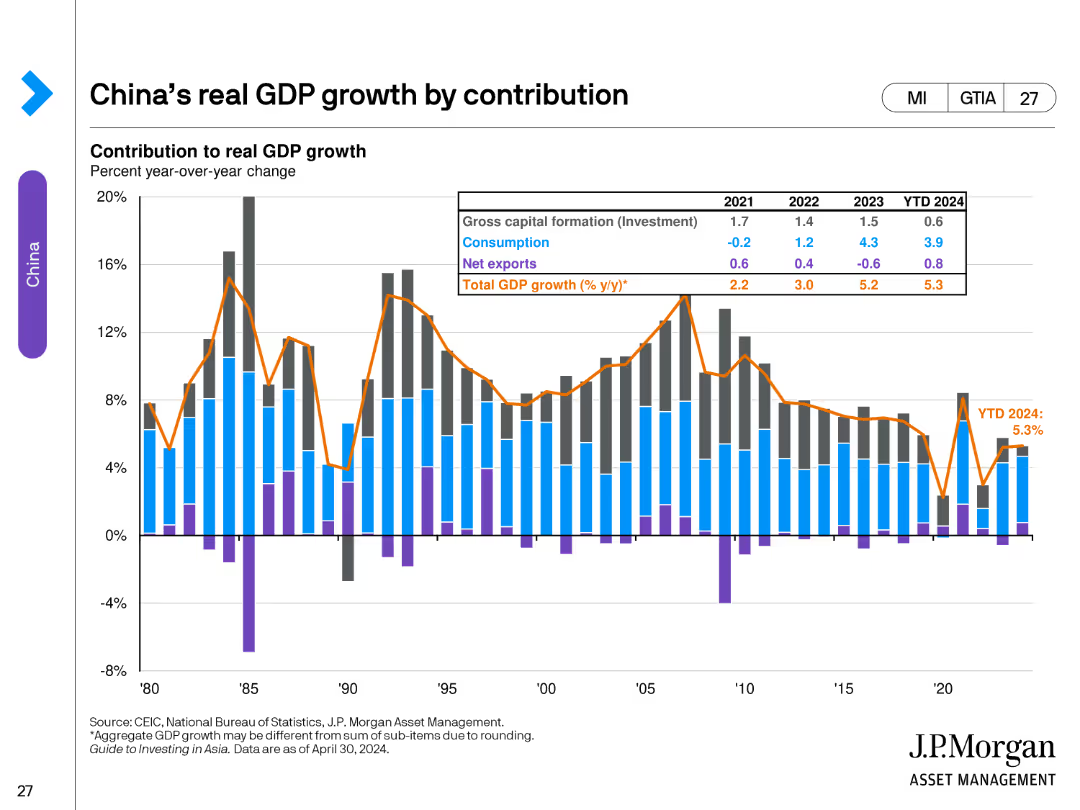
The slide contains a stacked bar chart showing the contribution to real GDP growth by gross capital formation, consumption, net exports, and total GDP growth from 1980 to 2024. A table summarizes year-over-year changes and projections for the near future.
Market Analysis and Trends
Financial Services
This slide analyzes the components of China's real GDP growth over several decades, highlighting the contributions of investment, consumption, and net exports. It provides a historical perspective and future projections of GDP growth rates.
China, GDP, growth, contribution, investment, consumption, net exports, projections, financial services, bar chart
Single Chart
JP Morgan
Saved
Contains a column chart of debt figures over time, another column chart of breakeven costs, with a line showing a reduction in breakeven rates due to strategic actions.
Financial Performance
Transportation & Logistics
Focuses on financial health by showing a reduction in debt and operational costs, positioning the company favorably within its industry.
debt reduction, financial health, breakeven rates, operational costs, industry comparison
Multiple Chart
Deutsche Bank
Saved
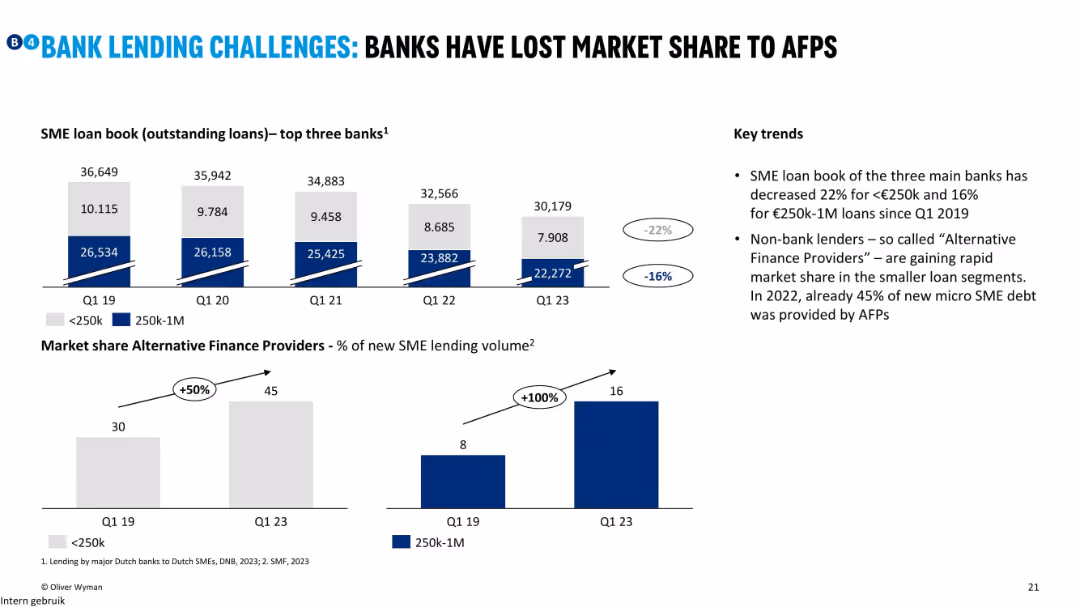
Bar charts showing declining SME loan book at major Dutch banks and rising AFP market share; annotations highlight % change.
Competitive Landscape
Financial Services
The slide tracks how Dutch banks have lost SME loan market share to Alternative Finance Providers (AFPs), especially in smaller loans. AFPs now provide 45% of new micro-SME loans, doubling their share since 2019.
AFP, SME loans, NL, banks, market share, non-bank lending, micro loans
Multiple Chart
Oliver Wyman
Saved
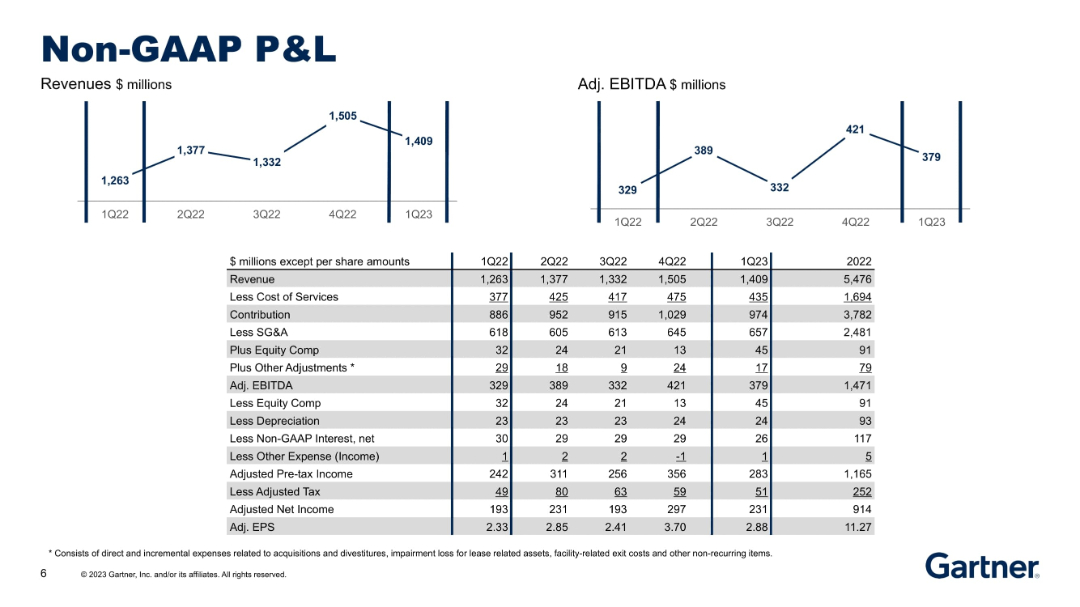
Two simple charts (Revenue, EBITDA) on top, detailed income statement table below showing adjustments to derive Non-GAAP metrics.
Financial Performance
Technology & Software
Illustrates a Non-GAAP profit and loss view with adjustments for SG&A, equity comp, and other items. Breaks down income from revenue to EPS, showing EBITDA as a key metric and providing a bridge to adjusted earnings.
non-GAAP, EBITDA, P&L, revenue, adjusted EPS, SG&A, financials
Multiple Chart
Gartner
Saved
The slide includes text on the left and a line graph on the right showing the revenue growth gap between leaders and laggards over several years.
Market Analysis and Trends
Financial Services
This slide contrasts the growth rates of leading and lagging organizations, illustrating how leaders have extended their revenue growth advantage over laggards.
revenue growth, leaders, laggards, financial performance, growth rates, post-pandemic recovery
Mixed Chart
Accenture
Saved
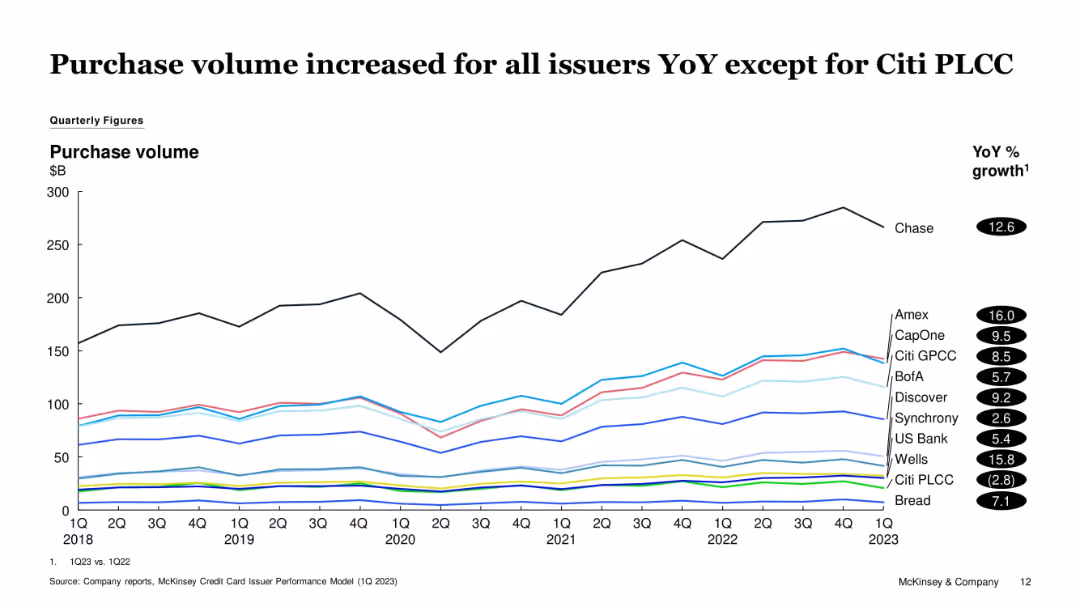
Line graph showing quarterly purchase volumes from 2018 to 1Q23. Different colored lines represent various issuers. YoY % growth is listed on the right.
Financial Performance
Financial Services
The slide tracks changes in credit card purchase volume over time, noting that all issuers except Citi PLCC experienced YoY growth. Chase and Amex show significant upward trends, while Citi PLCC declines slightly.
Purchase Volume, Credit Cards, Issuers, Amex, Citi PLCC, Chase, Trends
Single Chart
McKinsey
Saved
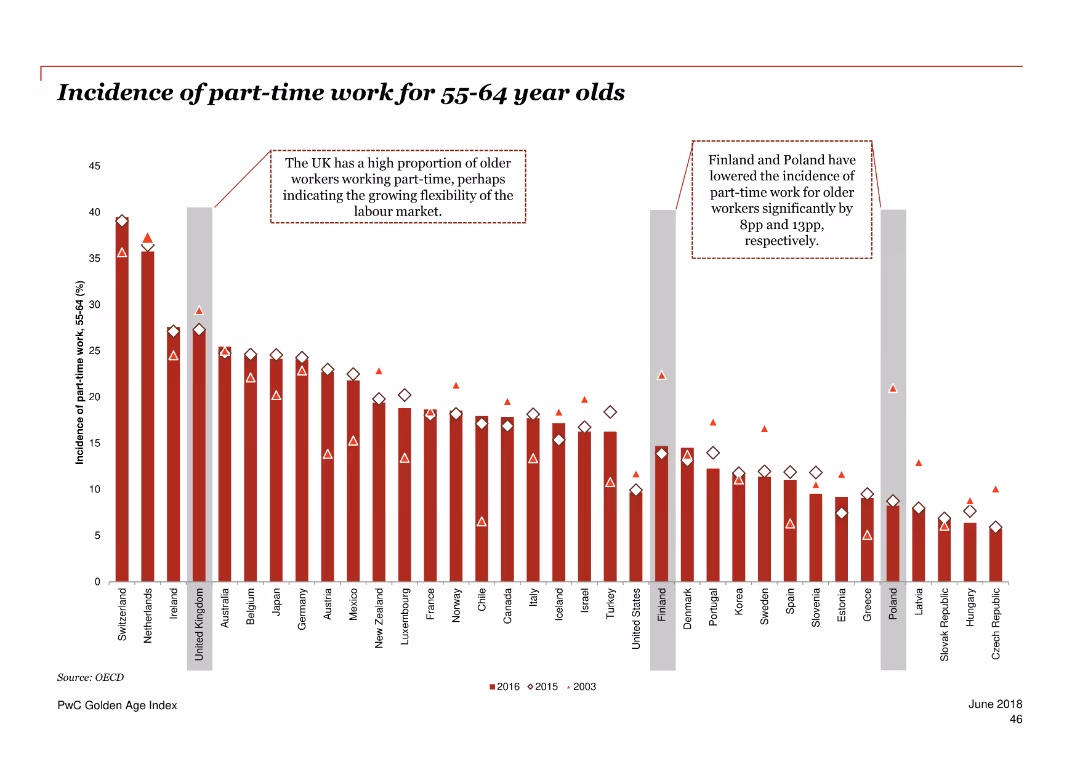
Column chart illustrating the incidence of part-time work for 55-64 year olds in various countries over three periods.
Market Analysis and Trends
Professional Services
The slide presents data on the proportion of older adults working part-time across multiple countries over 2003, 2015, and 2016.
part-time work, employment, older adults, OECD, trend
Single Chart
PwC/Strategy&
Saved
The slide features three circular icons representing financial outlook, strategic priorities, and digitalization and innovation. Each icon is accompanied by a text box explaining the respective focus area.
Financial Performance
Healthcare & Pharmaceuticals
This slide provides an overview of financial outlook for hospitals, strategic priorities post-COVID-19, and ongoing focus on digitalization and innovation in the healthcare sector.
financial, outlook, strategy, digitalization, innovation
Pillar
LEK
Saved
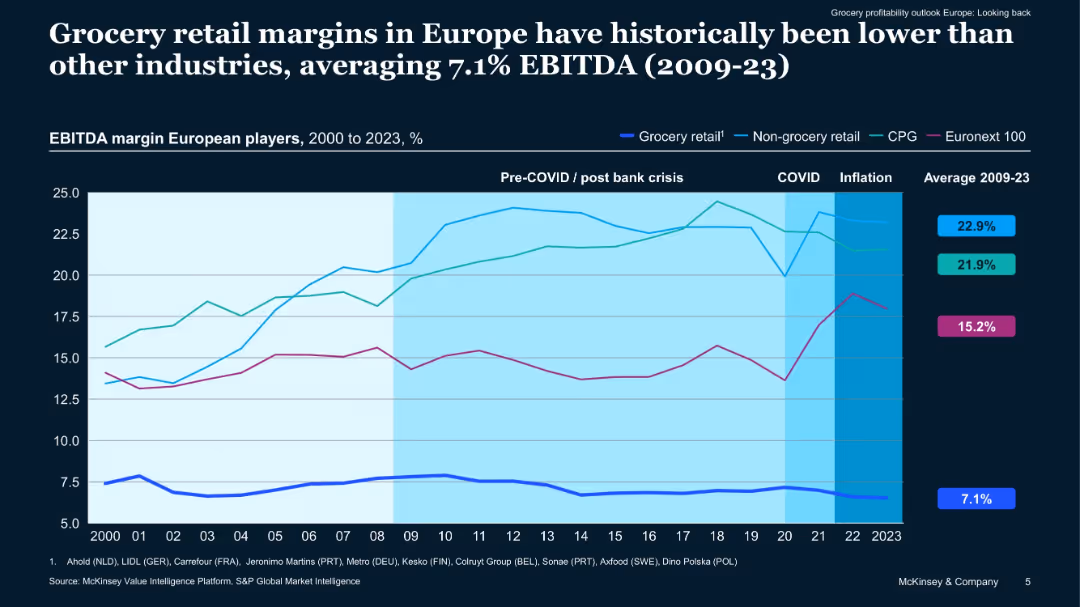
Line graph showing EBITDA margins (2000–2023) by industry segments including grocery, non-grocery, CPG, and Euronext 100. Color-coded lines with shaded periods (COVID, inflation) highlight trends.
Financial Performance
Retail & E-commerce
Shows historical EBITDA margins, indicating that grocery retail consistently underperforms compared to other industries. Analysis spans pre- and post-crisis, COVID, and inflation periods, emphasizing the sector’s structural profitability challenges.
grocery, EBITDA, historical margins, retail, financial trends
Single Chart
McKinsey
Saved
The slide features two large column charts representing CCB expenses for 2018 and 2019, with overlaid text describing contributing factors to the changes in expenses.
Operational Efficiency
Financial Services
It showcases how operational leverage was achieved through a breakdown of expenses in Consumer & Community Banking. The contributing factors to the financial performance and efficiency are listed to provide insight into expense management strategies.
leverage, operational, expenses, revenue, efficiency, banking, CCB
Single Chart
JP Morgan
Saved
Slide includes percentages and icons representing changes in various consumer activities and preferences during the pandemic, using a clear layout and engaging visual representations.
Market Analysis and Trends
Consumer Goods
Details the shift in consumer habits and preferences during the pandemic, including increases in remote work, relocation, and online shopping. Provides insights into how these changes may influence future consumer behavior and market opportunities.
Consumer Trends, COVID-19, Remote Work, Online Shopping
Header Horizontal
BCG
Saved
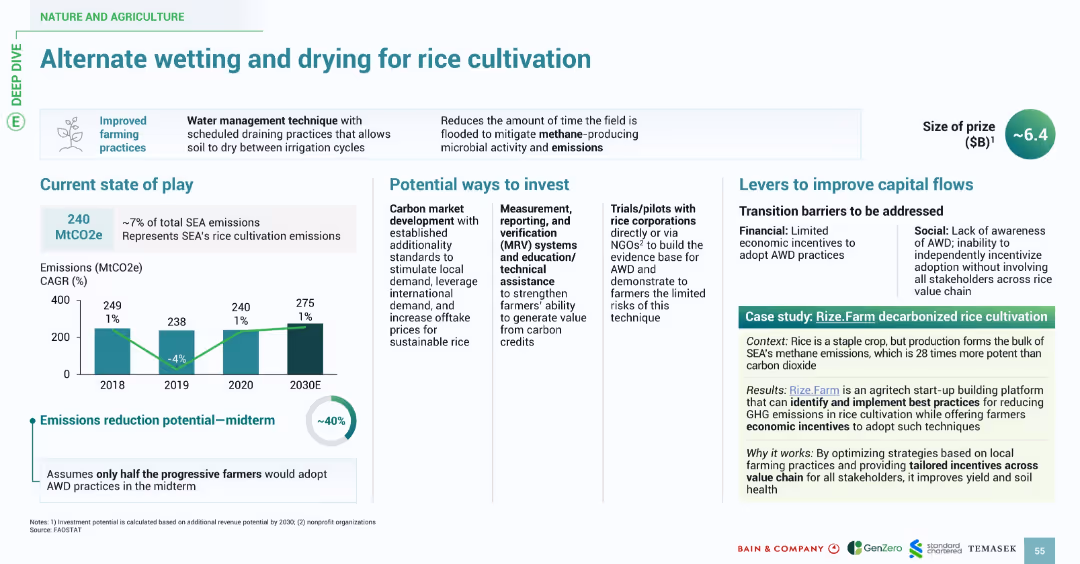
Split into sections with icons and clearly labeled headings. Includes bar chart (emissions), bullet-point lists, and a case study box. Color accents in green and teal reinforce environmental theme.
Operational Efficiency
Agriculture & Food Production
This slide promotes a water management technique for rice cultivation in Southeast Asia (SEA) that reduces methane emissions. It outlines current emissions levels, potential investment pathways, emission reduction potential (~40%), and implementation challenges. A case study (Rize.Farm) demonstrates how optimized local farming practices and incentives can improve soil health and reduce GHG emissions.
AWD, rice cultivation, methane, emissions, investment, case study, farming, SEA, carbon
Multiple Chart
Bain
Saved
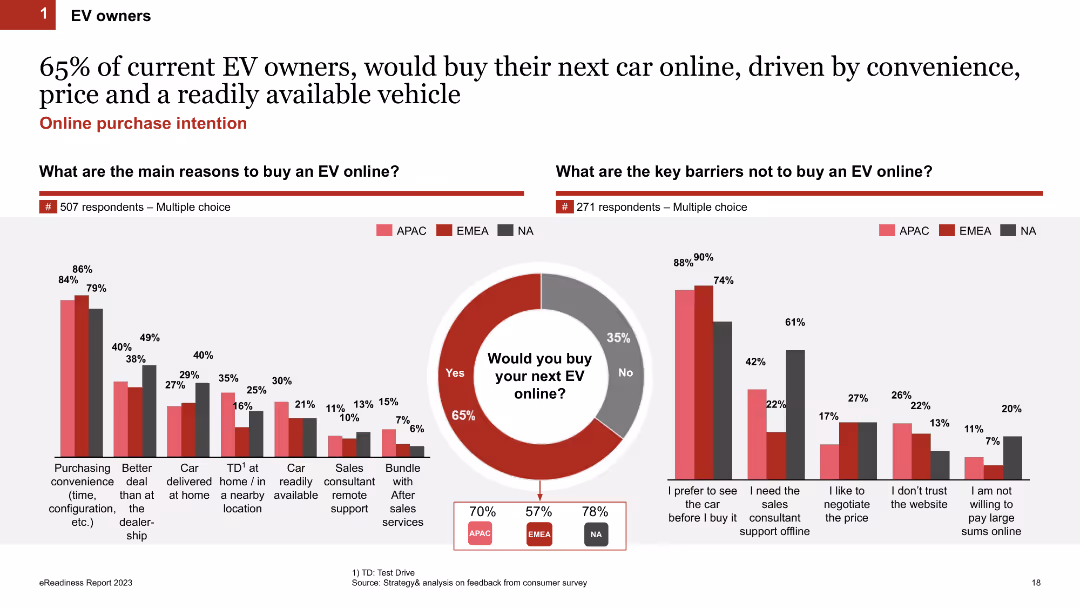
Comparative column charts showing the main reasons for buying an EV online and key barriers preventing online purchases, alongside a purchase intention pie chart.
Market Analysis and Trends
Transportation & Logistics
Investigates the motivations and deterrents for EV owners regarding online car purchases, revealing a high inclination towards online buying for convenience.
online purchase, motivations, barriers, EV owners, survey
Multiple Chart
PwC/Strategy&
Saved
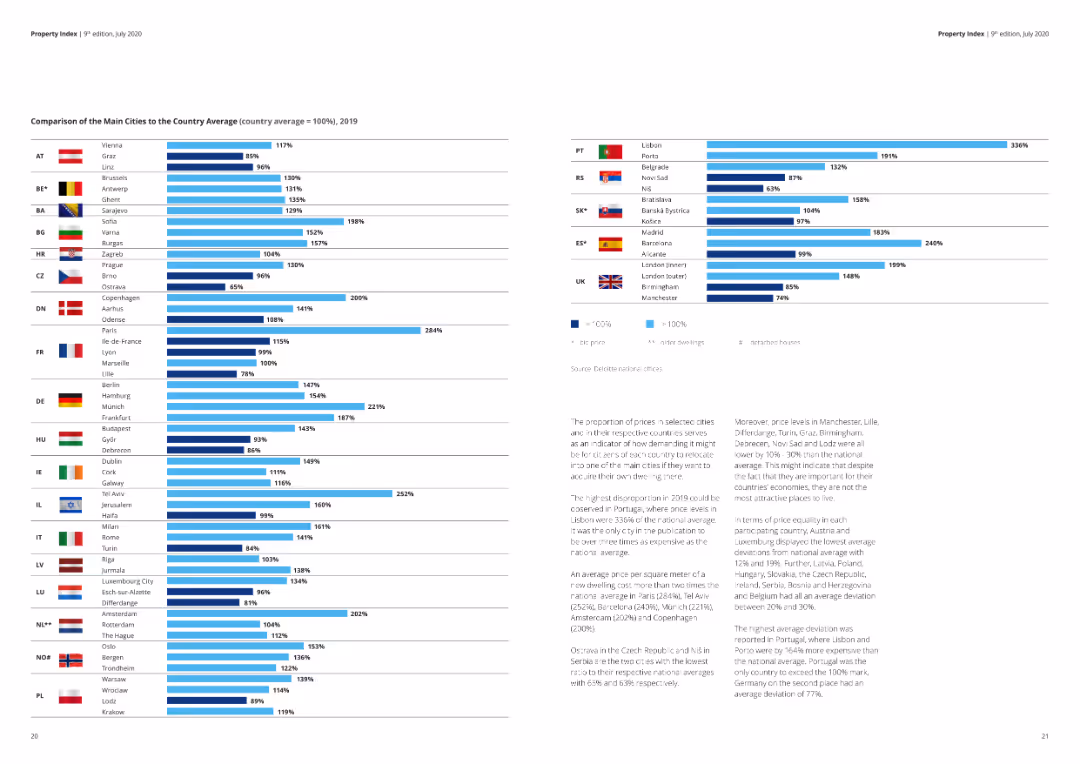
A column chart comparing the main cities' average transaction prices to the country average in 2019.
Market Analysis and Trends
Real Estate & Construction
This slide compares the average housing prices in main cities to their respective country averages, highlighting significant disparities.
real estate, housing prices, city comparison, country average, market trends, 2019
Multiple Chart
Deloitte
Saved
The slide includes a column chart showing cost ranges for different stages of CO2 capture and storage.
Financial Performance
Energy & Utilities
This slide presents the cost breakdown for capture, compression, dehydration, transport, storage, and monitoring of CO2.
CO2 capture, costs, compression, storage, monitoring
Mixed Chart
Kearney
Saved
Slide includes a column chart with green color highlights. It's structured into sections with clear headers and bullet points for easy reading.
Operational Efficiency
Education & Training
Details the role of community hubs in vocational pathways and employment, highlighting their support in gaining skills and providing training opportunities. It assesses the economic and social benefits provided by these hubs, emphasizing their importance in community development.
vocational training, community development, employment support, skills acquisition
Mixed Chart
Deloitte
Saved
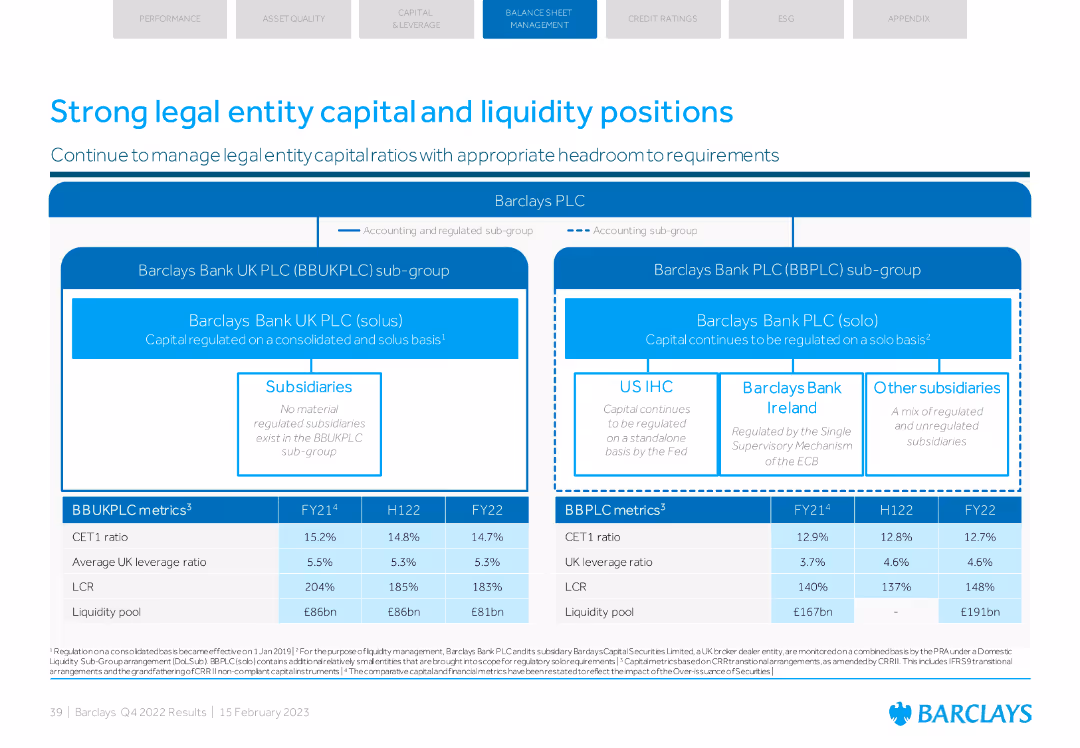
Diagram of Barclays' legal entity structure with accompanying tables of financial metrics.
Regulatory and Compliance
Financial Services
Outlines the capital and liquidity positions of Barclays' legal entities, including detailed financial ratios and regulatory compliance information.
legal entity, capital, liquidity, compliance, metrics
Diagram
Barclays
Saved
The slide shows a vertical bar chart comparing the percentage of people agreeing with the statement about the importance of the internet across various countries.
Market Analysis and Trends
Technology & Software
The slide highlights global survey results indicating a widespread recognition of the importance of the internet in people's lives.
Internet, technology, global survey, public opinion, internet importance
Multiple Chart
IPSOS
Saved
Slide with column chart showing 'Global Banking & Markets Net Revenues' segmented by revenue types, a detailed financial results table, and highlighted textual analysis of key figures.
Financial Performance
Financial Services
Focuses on the financial results and revenue specifics of the Global Banking & Markets sector, providing insights on performance factors, investment banking fees, and revenue streams. Designed for detailed market analysis and strategic planning.
Global Banking, Market Revenue, Investment Fees, FICC, Equities, Net Revenues, Financial Performance, Market Trends
Mixed Chart
Goldman Sachs
Saved
Includes a column chart for sustainable finance volumes, lists, and bullet points highlighting key activities and achievements.
Operational Efficiency
Environmental Services & Sustainability
Highlights Deutsche Bank's Q1 2023 sustainability efforts, focusing on increased finance volumes, new policies, and significant achievements in promoting sustainability in banking practices.
sustainability, finance volumes, policies, Q1 2023, banking
Mixed Chart
Deutsche Bank
Saved
This Comparative Slide outlines Michelin’s expertise across 'R&D', 'MANUFACTURING', and 'GROWTH STRATEGY', using a balanced mix of text and images. The design is dense but clear, with color-coded sections and relevant images providing visual cues to the information presented. The structure allows for easy comparison of the three areas and their interconnectedness.
Technology and Digital Transformation
Industrial & Manufacturing
The slide describes Michelin's approach to expanding its high-tech materials business, detailing their R&D capabilities, manufacturing scalability, and growth strategies, including organic growth and M&A. It stresses the importance of leveraging their expertise beyond tires into more demanding applications, showing the connection between their foundational strengths and future growth potential.
high-tech materials, R&D, manufacturing, growth strategy, organic growth, M&A, expertise, Michelin
Linear Flow
Morgan Stanley
Saved
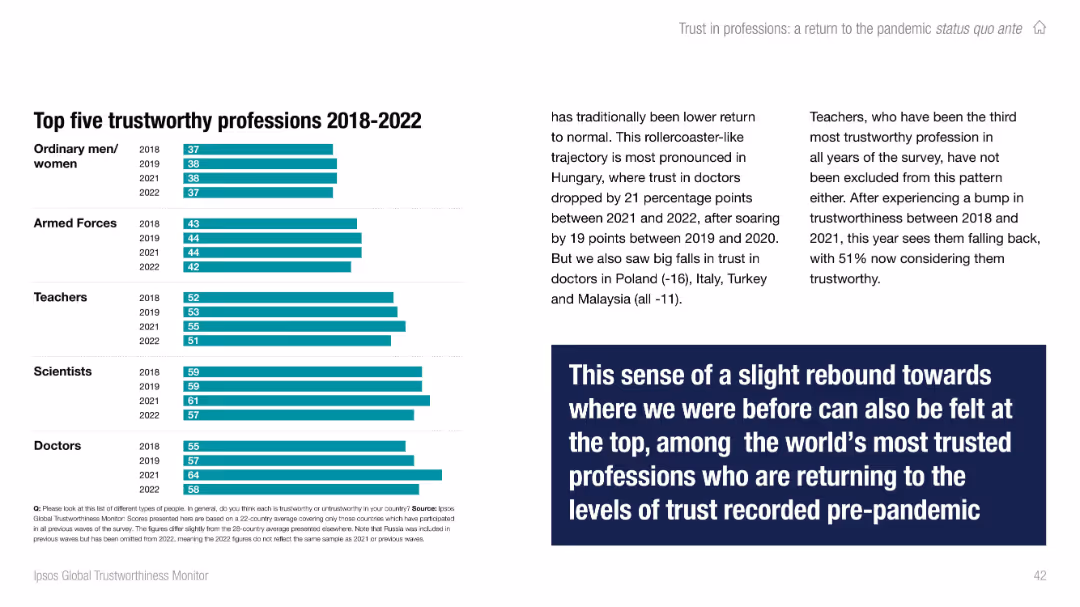
Right side contains multi-year bar chart; left has contextual text with a bold quote box. Color-coded by year.
Performance Metrics and KPIs
Professional Services
Highlights the top five most trusted professions from 2018 to 2022: doctors, scientists, teachers, armed forces, and ordinary people. Notes recent dips in trust for teachers and doctors in specific countries but overall consistency near the top of the trust scale.
professions, trust, Ipsos, top trusted, trends, teachers, doctors, global
Mixed Chart
IPSOS
Saved
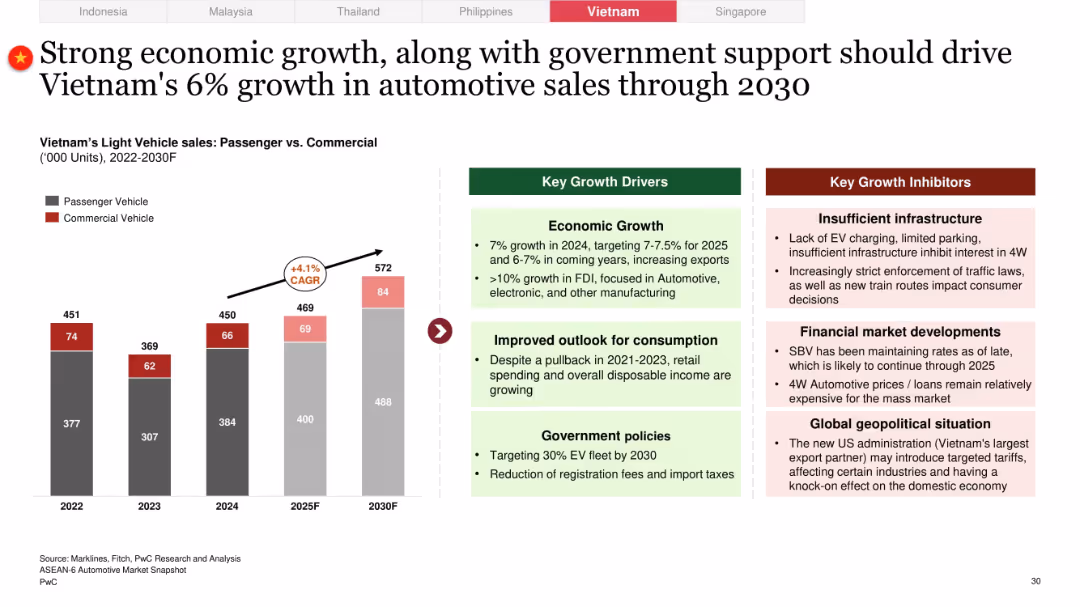
Typical two-part layout with bar graph showing PV/CV sales from 2022 to 2030 and growth/inhibitor boxes on the right
Market Analysis and Trends
Industrial & Manufacturing
Vietnam anticipates steady 6% CAGR in automotive sales, driven by FDI, growing consumption, and policy support. Key inhibitors include weak infrastructure, financing constraints, and global geopolitical risks.
Vietnam, vehicle sales, FDI, consumption outlook, infrastructure gaps, auto lending, CAGR forecast
Mixed Chart
PwC/Strategy&
Saved
Previous
Next
If nothing, comes up, please save your slides first
Create a FREE account to continue browsing
Receive Instant Access to 1,000+ slides from companies like McKinsey, Google, and Goldman Sachs
First Name
Last Name
Email
Password
I agree to all
Terms & Privacy Policy
Thank you! Your submission has been received!
Oops! Something went wrong while submitting the form.
Have an account?
Sign in
Column Chart
Heatmap
Chevron
Org Chart
Infographic
Callouts
Timeline
List
Graphic
Picture
Process Flow
Diagram
Paragraph
Map
Table
Framework
Subtitle
Takeaway Box
Icon
Other Chart
Radar Chart
Waterfall Chart
Mekko Chart
Pie Chart
Scatter Plot
Line Chart
Bar chart
Bullet points