My Account
My Slides
Search by Category
Templates
Leave Feedback
Login
Logout
Get Started
Browse all Slides
Browse all Slides
Create a FREE Account
Instant access to 1,000+ real slides from top companies like McKinsey, BCG, Goldman Sachs, Google and many more!
First Name
Last Name
Email
Password
I agree to all
Terms & Privacy Policy
Thank you! Your submission has been received!
Oops! Something went wrong while submitting the form.
Have an account?
Sign in
Saved Slides
The slide features a series of scatter plots representing contracting activity for different types of drilling units in various environments. Each plot is labeled and uses differently sized bubbles to indicate contract duration, with trend lines showing rate changes over time. The design is minimalistic but effective, with clear labels and a legend explaining the symbols used. The visual hierarchy is well managed to guide the viewer through the data.
Market Analysis and Trends
Energy & Utilities
This slide analyzes contracting activity within the oil drilling sector, specifically looking at day rates and contract durations for harsh and benign environment floaters, as well as premium jack-ups. It's designed to help stakeholders understand market conditions and the profitability of deploying specific drilling units under current economic conditions. This data is crucial for strategic decisions regarding fleet deployment and investment in new technologies or markets.
contracting activity, drilling units, scatter plots, market analysis, day rates, trend analysis, oil drilling, environment, profitability, strategic decisions
Multiple Chart
Barclays
Saved
The slide contains multiple infographics and charts showing data on business locations, employee numbers, company age, types of FinTech, and end customers.
Industry Overview
Financial Services
The slide provides an overview of the FinTech sector in 2017, covering aspects such as business demographics, key competitors, types of FinTech, and target customers.
FinTech, sector profile, business demographics, competitors, customers
Multiple Chart
EY
Saved
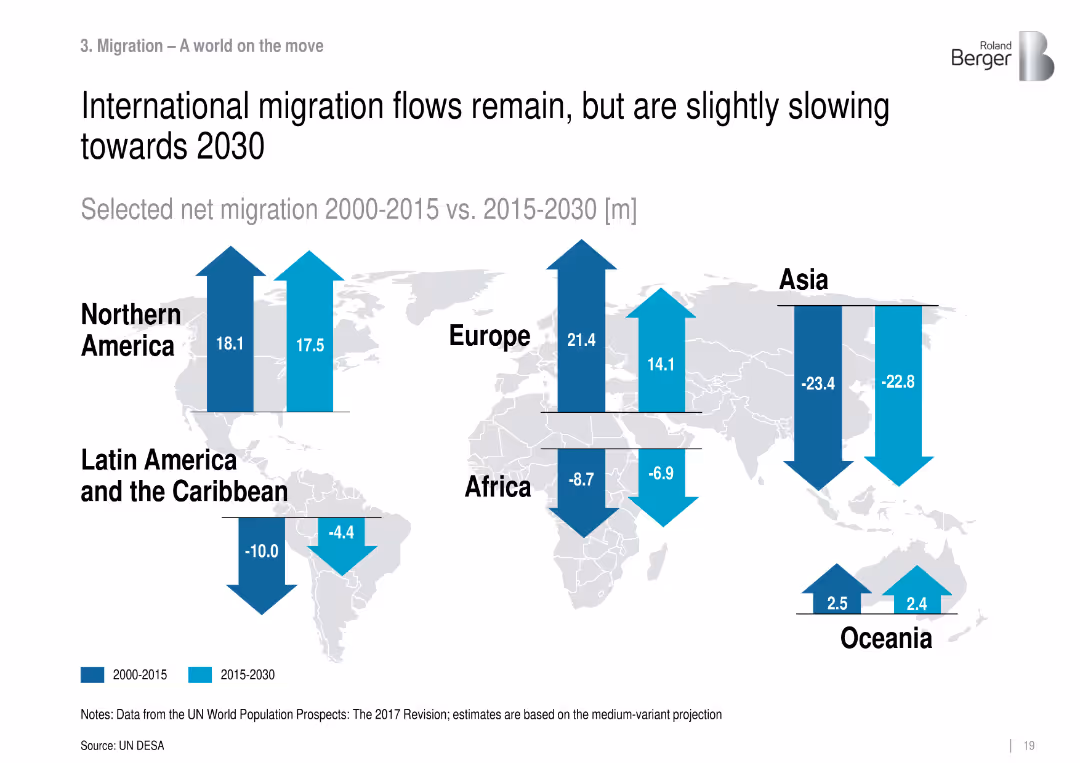
World map with directional arrows comparing net migration (2000–2015 vs. 2015–2030) across continents.
Market Analysis and Trends
Government & Public Sector
Depicts changes in international migration trends, showing continued but slowing net migration towards regions like North America and Europe, while Asia and Africa continue to lose population through emigration.
migration, net flows, international mobility, regional trends, demographic movement, UN DESA
Mixed Chart
Roland Berger
Saved
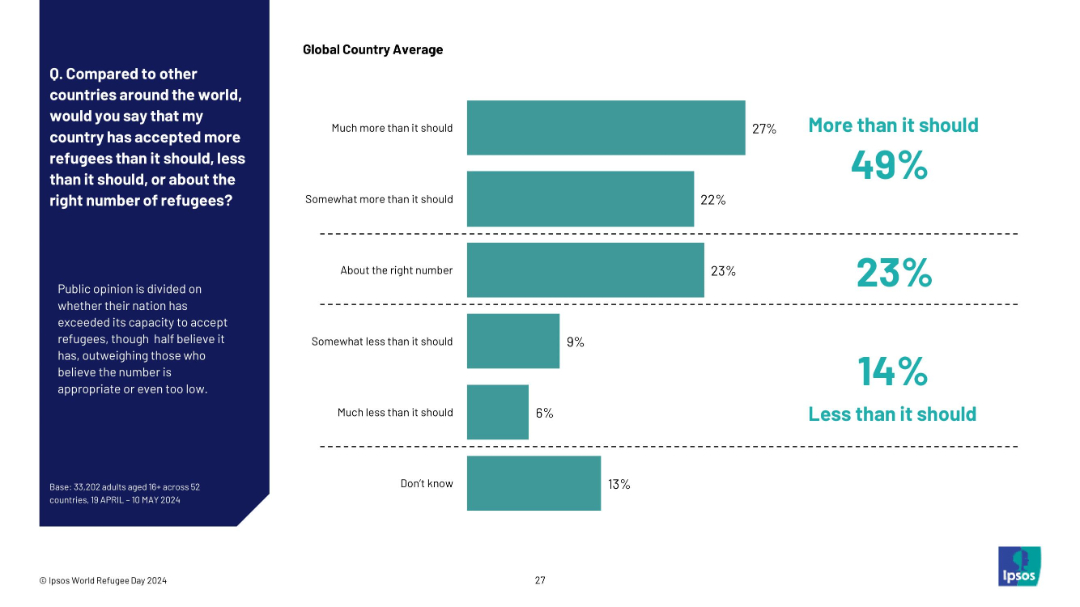
Horizontal bar chart showing opinion distribution across five response categories
Market Analysis and Trends
Government & Public Sector
This slide captures public perception of refugee intake adequacy. Nearly half believe their country has accepted more refugees than it should, while only 14% say less and 23% feel it is about right. The data reflects perceived national capacity and sentiment toward refugee volumes.
refugee intake, capacity perception, Ipsos, global opinion, immigration, volume judgment
Mixed Chart
IPSOS
Saved
The slide shows pie charts illustrating the allocation of assets in original and leveraged portfolios.
Investment Analysis
Financial Services
This slide provides an example of implementing portfolio leverage, detailing asset allocation changes before and after leveraging.
portfolio leverage, asset allocation, investment strategy, pie charts, leverage
Multiple Chart
UBS
Saved
Utilizes a split design with data on the left, a column chart in the center and an image of a user interface on the right. There's a notable use of blue tones and digital motifs.
Operational Efficiency
Technology & Software
Outlines the firm's digital portal features, its revenue impact, and the upcoming developer tools designed to enhance user experience and connectivity.
Digital portal, revenue growth, developer tools, user interface, API, technology, financial services, user experience
Mixed Chart
JP Morgan
Saved
This slide features a structured overview with icons and brief descriptions of various investment themes across sectors like renewables, built environment, and electric mobility.
Investment Analysis
Financial Services
Provides insights into accessible thematic investment opportunities within sectors like forest conservation, sustainable farming, and renewables, highlighting the potential for early and mature capital investments.
investment opportunities, renewables, thematic sectors, capital investment
Header Horizontal
Bain
Saved
Features a table with a well-organized layout. Each section is divided by clear headings, and the color scheme is consistent, enhancing readability. Information is presented through a mix of visuals and brief textual explanations.
Market Analysis and Trends
Environmental Services & Sustainability
Explores the potential value in developing projects related to carbon credit trading, focusing on the Southeast Asian market. It assesses various phases such as project design, implementation, and monitoring, providing estimated market sizes and profit margins.
carbon credits, market value, SEA, project development, trading
Table
Bain
Saved
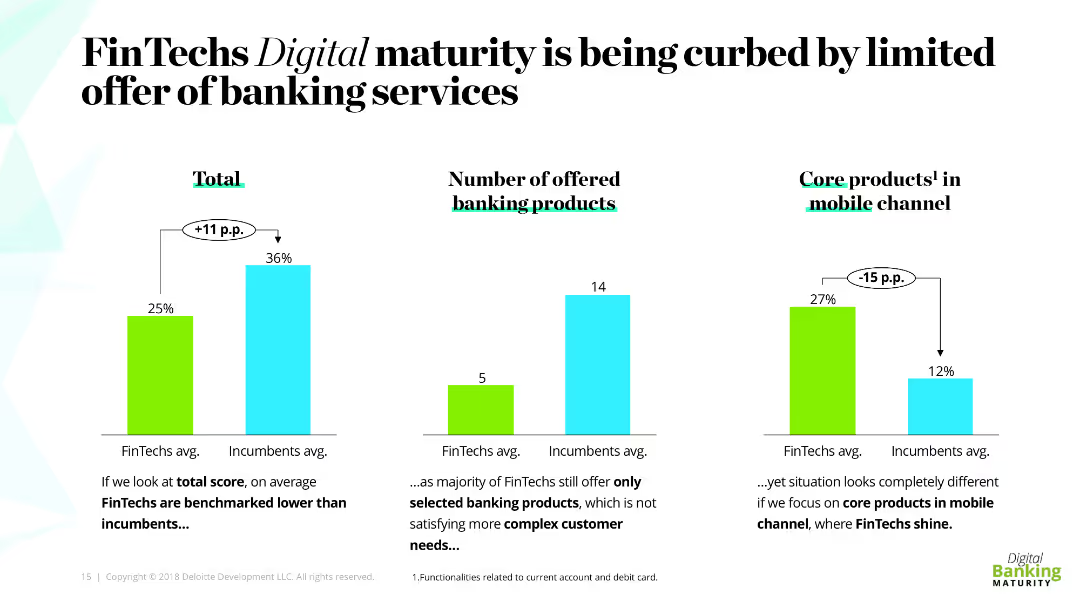
The slide includes three column charts comparing FinTechs and incumbents on total score, number of banking products offered, and core products in the mobile channel. Each chart is accompanied by a brief explanation of the data presented.
Market Analysis and Trends
Financial Services
The slide analyzes the limitations in FinTechs' digital maturity due to a limited range of banking services. It compares FinTechs and incumbents in terms of overall scores, number of banking products offered, and performance in mobile channel services.
FinTechs, incumbents, banking services, digital maturity, comparison
Multiple Chart
Deloitte
Saved
The slide has a textual overview on the left and a column chart on the right. The chart shows readiness levels for Basel III finalization among organizations.
Regulatory and Compliance
Financial Services
It details regulatory concerns, especially the readiness for Basel III finalization, and discusses varying levels of preparedness among institutions.
Regulatory concerns, Basel III, readiness, compliance, risk management
Mixed Chart
EY
Saved
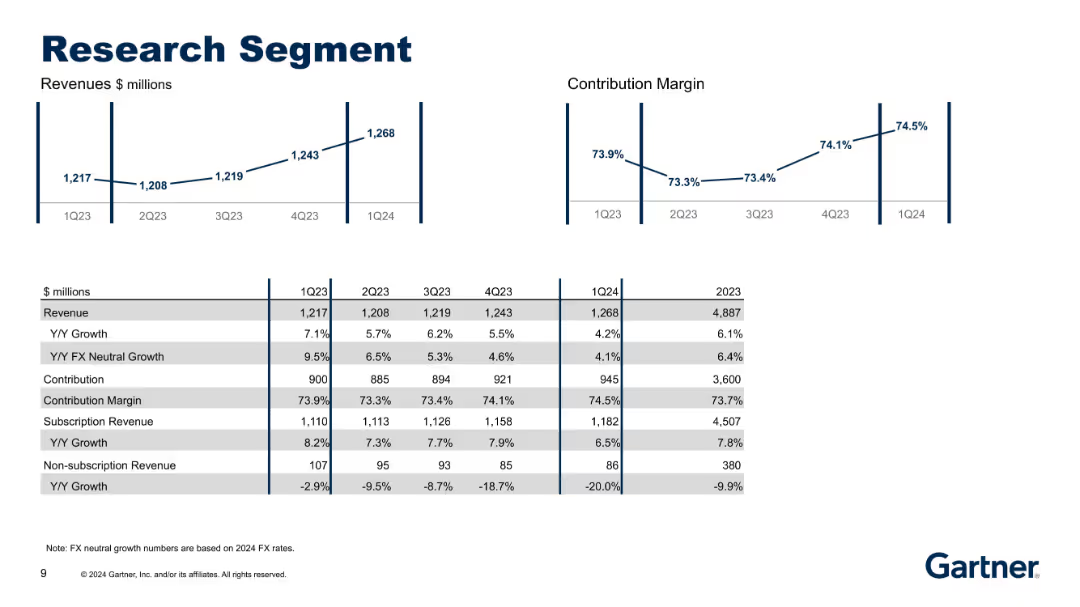
Two line charts (Revenue, Contribution Margin) above a detailed data table; simple vertical data layout with bold titles and alternating row shading.
Performance Metrics and KPIs
Technology & Software
Shows quarterly revenue and contribution margin performance for the Research segment, supported by metrics such as subscription/non-subscription revenue, Y/Y growth, and contribution figures. Visuals and tables provide granular insights into segment profitability and trends.
research, revenue, contribution margin, growth, KPIs, subscription
Multiple Chart
Gartner
Saved
The slide contrasts traditional vs. flexible hiring methods, with two columns of text and icons. There is a highlighted quote at the bottom from a business owner.
Human Resources and Talent Management
Technology & Software
It compares traditional and flexible hiring criteria, emphasizing the need for broader talent search approaches, aimed at HR professionals and hiring managers.
hiring methods, talent search, competencies, qualifications, HR, flexible hiring, traditional hiring, recruitment
Header Horizontal
Kearney
Saved
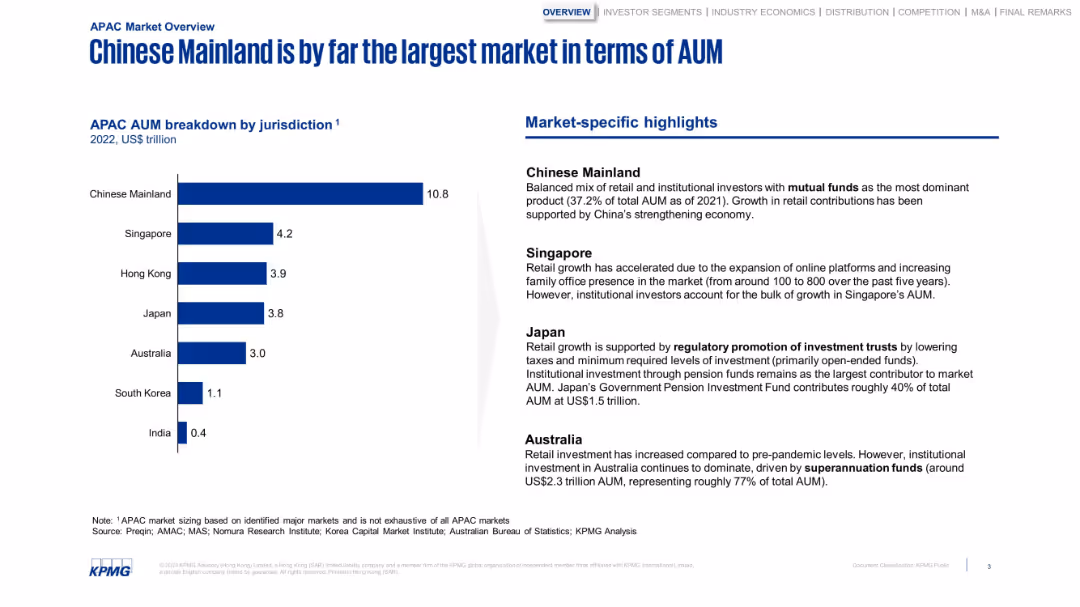
Bar chart with jurisdictional AUM and a column of highlights. Structured and minimalistic with strong blue tones.
Market Analysis and Trends
Financial Services
Breaks down APAC AUM by country, highlighting China’s dominance. The sidebar notes market-specific factors like regulatory frameworks, pension fund dominance, and online platform growth in Singapore and Japan.
AUM, China, Japan, Singapore, investment, retail growth, pensions
Mixed Chart
KPMG
Saved
This slide offers a mix of pie charts and bar charts, showcasing the CRE portfolio distribution by loan type and region, including specific risk assessments and loan values. Also includes textual data points on risk strategies and regional distributions.
Risk Assessment and Management
Real Estate & Construction
Focuses on the commercial real estate loan portfolio, analyzing risk distribution and loan values across different regions and types. Useful for real estate investment risk management and strategic planning, providing insights into market conditions and potential stress scenarios.
CRE, loan distribution, risk management, real estate, regional analysis, loan values, stress scenarios
Multiple Chart
Deutsche Bank
Saved
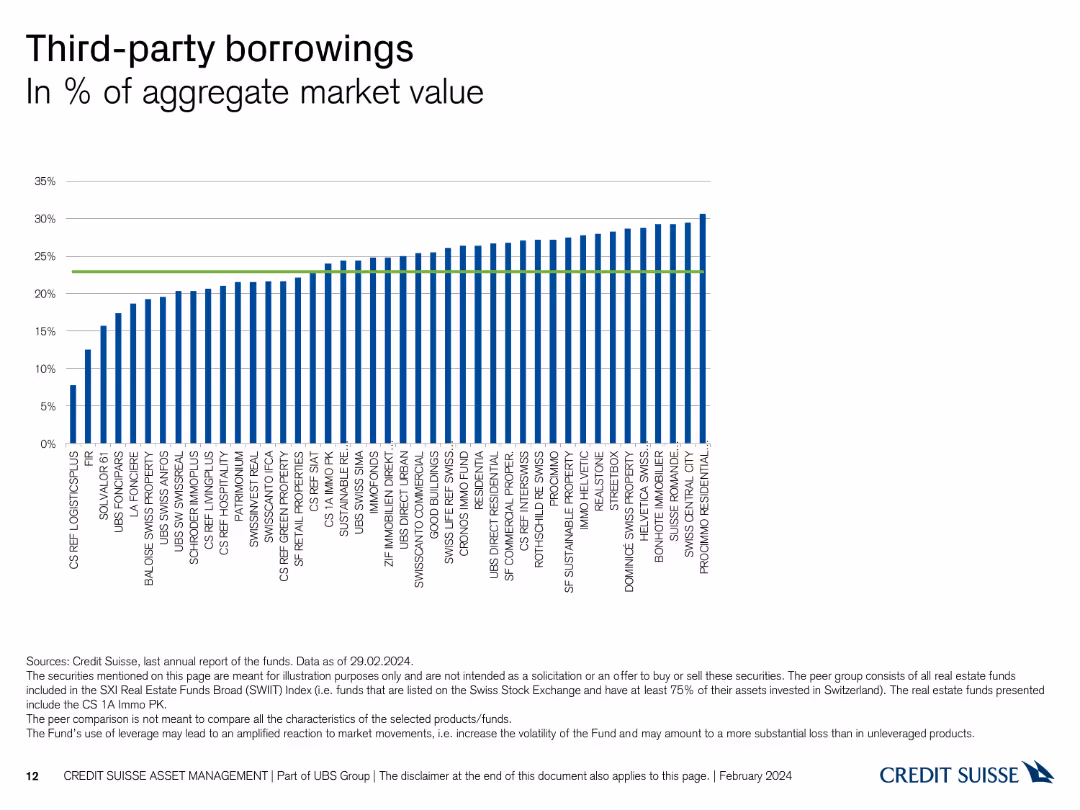
This slide contains a column chart showing the percentage of third-party borrowings in the aggregate market value for various entities.
Financial Performance
Financial Services
It presents the level of third-party borrowings as a percentage of the aggregate market value, useful for assessing financial leverage and risk among entities.
borrowings, aggregate market value, financial leverage, third-party, entities
Single Chart
Credit Suisse
Saved
The slide is split into two main sections, with the left side featuring a line graph against a background of shaded rectangles marking recessions, while the right side shows two column charts comparing long run average equity returns. The color scheme is primarily blue and orange.
Investment Analysis
Financial Services
The slide analyzes global equity returns with a historical view of the S&P 500 index during and after recessions, and compares it to mid-cycle returns. It is aimed at investors for assessing the patterns of equity performance in various economic cycles. The line graph juxtaposes equity returns with economic recessions, while the bar graphs contrast long-term versus mid-cycle returns, offering a visual understanding of investment risks and opportunities through different economic conditions.
equity returns, S&P 500, recessions, mid-cycle, investment, history, comparison, economic cycles, analysis
Multiple Chart
Citigroup
Saved
This slide contains a multi-line graph showing office portfolio occupancy trends across several countries, alongside a bar chart representing portfolio weighting by country. It uses a white background with lines in various shades of blue and a yellow highlight for one country’s trend.
Performance Metrics and KPIs
Real Estate & Construction
The slide provides an analysis of office portfolio occupancy rates, close to 90%, across different countries, and shows the portfolio weighting by country. It is crucial for real estate managers tracking occupancy trends or investors evaluating market performance and investment distribution across a global portfolio.
office occupancy, portfolio management, country trends, real estate investment
Multiple Chart
Morgan Stanley
Saved
Features column charts showcasing 'Strong Returns', 'Cost Saves', 'Low Volatility', and 'Potential for Better Revenue Growth', with annotations and comparison to peers. The slide uses varying shades to differentiate the data points.
Financial Performance
Financial Services
The slide compiles key financial performance indicators, such as returns, cost savings, and volatility, to underscore the company’s momentum. It also projects potential revenue growth areas, positioning the company as a strong player in the financial industry.
Financial Performance, Returns, Cost Savings, Volatility, Revenue Growth
Multiple Chart
Goldman Sachs
Saved
The left side of the slide features a scatter plot showing the relationship between price-to-book ratio and subsequent returns, while the right side shows a line chart comparing APAC ex-Japan equity performance to the USD index.
Market Analysis and Trends
Financial Services
The slide analyzes performance drivers for APAC ex-Japan equities, focusing on price-to-book ratios and their impact on returns, as well as the relationship between equity performance and the USD index.
APAC, performance drivers, price-to-book, returns, equity performance, USD index, market analysis
Multiple Chart
JP Morgan
Saved
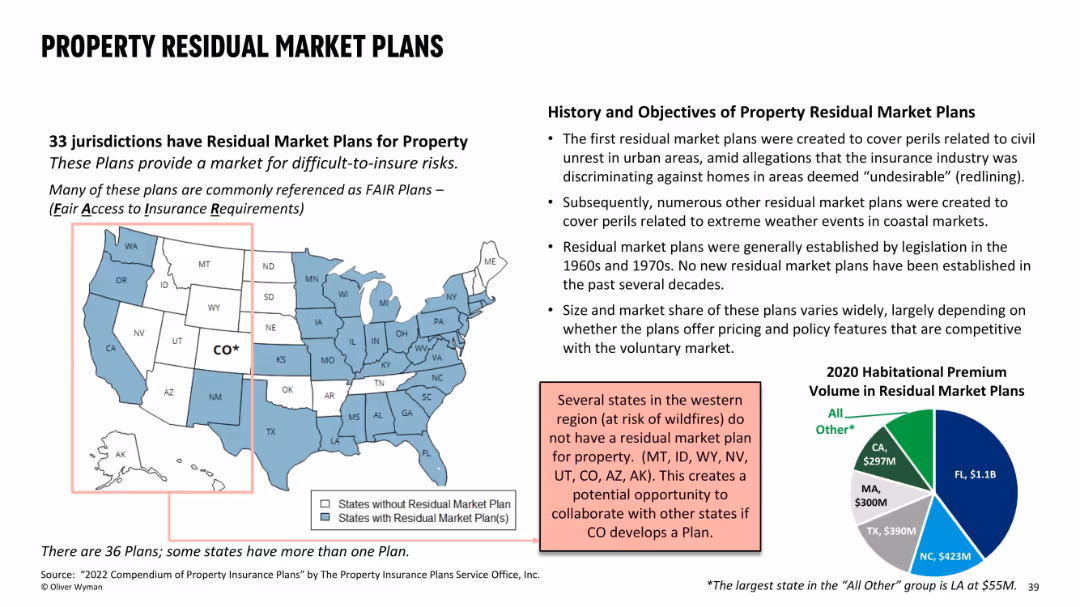
A US map showing states with and without residual market plans for property insurance, supplemented with textual and pie chart explanations. Blue and grey color scheme, bolded state labels, and callouts.
Regulatory and Compliance
Financial Services
This slide explains residual market plans (RMPs) for property insurance, emphasizing their role in covering difficult-to-insure risks. It highlights that 33 jurisdictions have RMPs and discusses the opportunity for Colorado to establish one, especially in wildfire-prone regions. A pie chart shows 2020 premium volumes by state.
residual market, insurance, FAIR plans, wildfire risk, coverage gaps, regulation, premium volume, US states
Mixed Chart
Oliver Wyman
Saved
Contains bar and tables comparing revenue streams and financial metrics across quarters, with emphasis on different banking activities.
Financial Performance
Financial Services
Analyzes the Investment Bank's financial results, focusing on revenue variations and strategic adjustments in response to market dynamics.
Investment Bank, revenue, market dynamics
Mixed Chart
Deutsche Bank
Saved
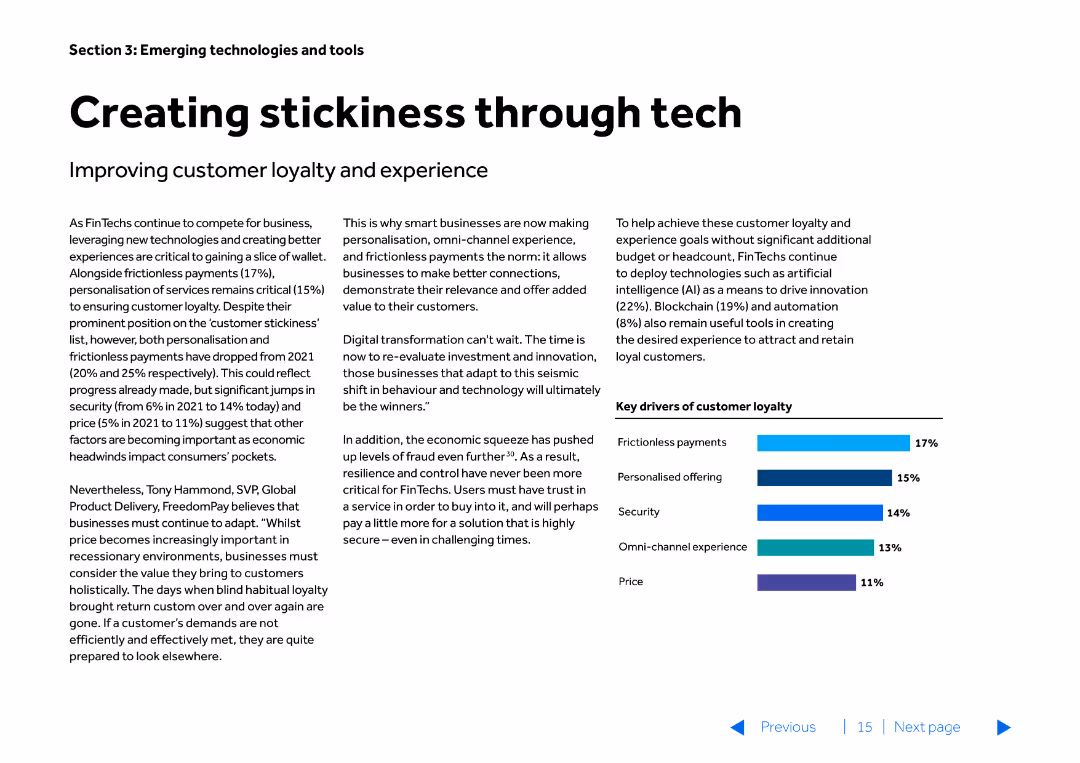
The slide contains a mix of text and a small bar chart at the bottom right. It discusses key drivers of customer loyalty with a focus on technology solutions.
Customer and Market Segmentation
Financial Services
Highlights how technology can enhance customer loyalty and experience, detailing the importance of personalisation, omni-channel experience, and security.
customer loyalty, technology, personalisation, omni-channel, security
Mixed Chart
Barclays
Saved
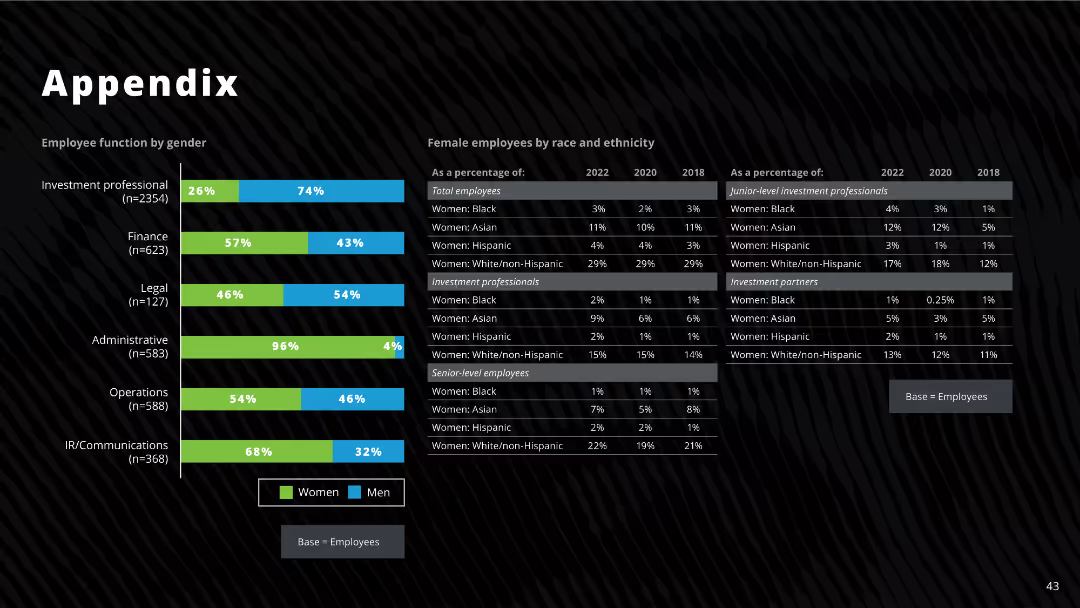
The slide features bar charts and tables showing employee function by gender, race, and ethnicity, including detailed percentages for different categories from 2018, 2020, and 2022.
Human Resources and Talent Management
Professional Services
The slide provides detailed demographic data on employees by function, gender, race, and ethnicity, highlighting changes over time.
employee demographics, gender, race, ethnicity, investment professionals, diversity
Mixed Chart
Deloitte
Saved
Column charts depicting the budget growth for new product and service introductions over time.
Product and Service Analysis
Professional Services
Analyzes budget allocation trends for new product and service introductions, comparing current levels to pre-Covid times. Useful for product strategy development and market entry planning.
products, services, budgets, growth, covid, strategy, market, planning
Single Chart
Deloitte
Saved
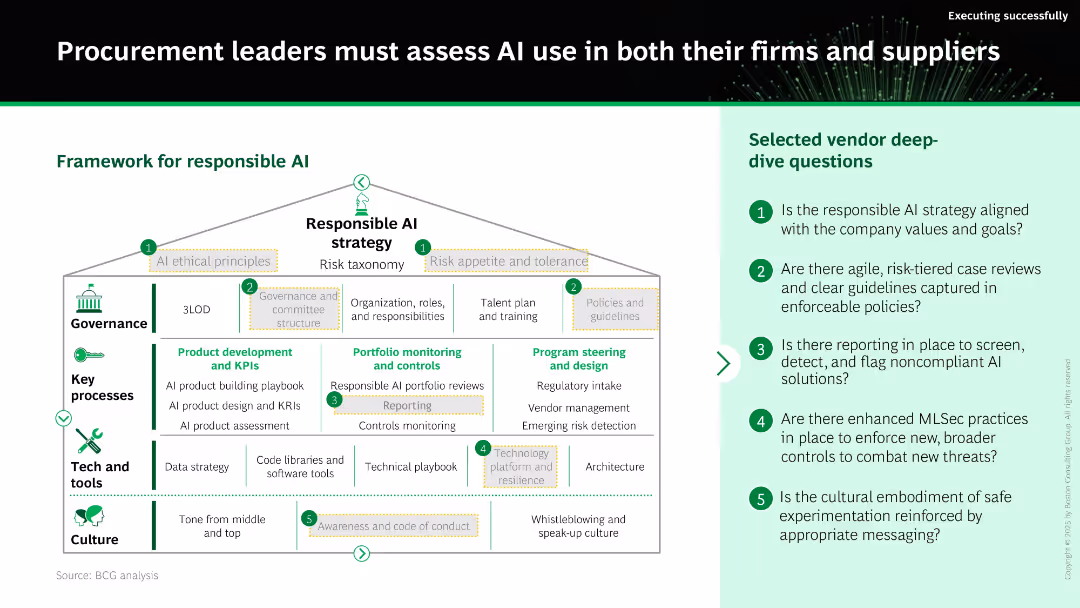
Visual framework of a “house” representing a responsible AI strategy; includes labeled sections (Governance, Key Processes, Tech & Tools, Culture). A list of 5 vendor assessment questions is on the right.
Regulatory and Compliance
Artificial Intelligence
This slide presents a framework for implementing responsible AI in procurement. It emphasizes governance, product KPIs, compliance, and cultural support. A right-side checklist poses questions for vendor AI evaluation regarding ethics, policies, reporting, and cultural alignment.
responsible AI, governance, procurement, compliance, KPIs, vendor assessment, risk management
Boxed
BCG
Saved
Previous
Next
If nothing, comes up, please save your slides first
Create a FREE account to continue browsing
Receive Instant Access to 1,000+ slides from companies like McKinsey, Google, and Goldman Sachs
First Name
Last Name
Email
Password
I agree to all
Terms & Privacy Policy
Thank you! Your submission has been received!
Oops! Something went wrong while submitting the form.
Have an account?
Sign in
Column Chart
Heatmap
Chevron
Org Chart
Infographic
Callouts
Timeline
List
Graphic
Picture
Process Flow
Diagram
Paragraph
Map
Table
Framework
Subtitle
Takeaway Box
Icon
Other Chart
Radar Chart
Waterfall Chart
Mekko Chart
Pie Chart
Scatter Plot
Line Chart
Bar chart
Bullet points