My Account
My Slides
Search by Category
Templates
Leave Feedback
Login
Logout
Get Started
Browse all Slides
Browse all Slides
Create a FREE Account
Instant access to 1,000+ real slides from top companies like McKinsey, BCG, Goldman Sachs, Google and many more!
First Name
Last Name
Email
Password
I agree to all
Terms & Privacy Policy
Thank you! Your submission has been received!
Oops! Something went wrong while submitting the form.
Have an account?
Sign in
Saved Slides
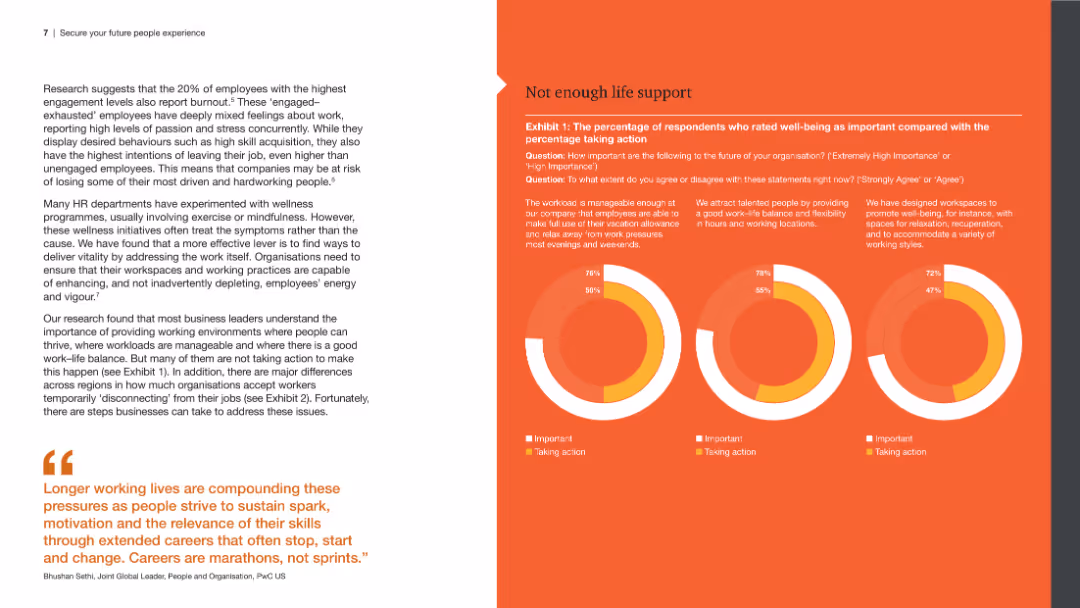
The slide includes a left panel with a detailed text analysis and a right panel with three circular graphs comparing the importance and actions taken regarding well-being, work-life balance, and workspace design.
Human Resources and Talent Management
Professional Services
The slide explores employee engagement and burnout, emphasizing the importance of well-being, work-life balance, and workspace design, backed by survey data presented in circular graphs.
Employee engagement, burnout, well-being, work-life balance, workspace design
Multiple Chart
PwC/Strategy&
Saved
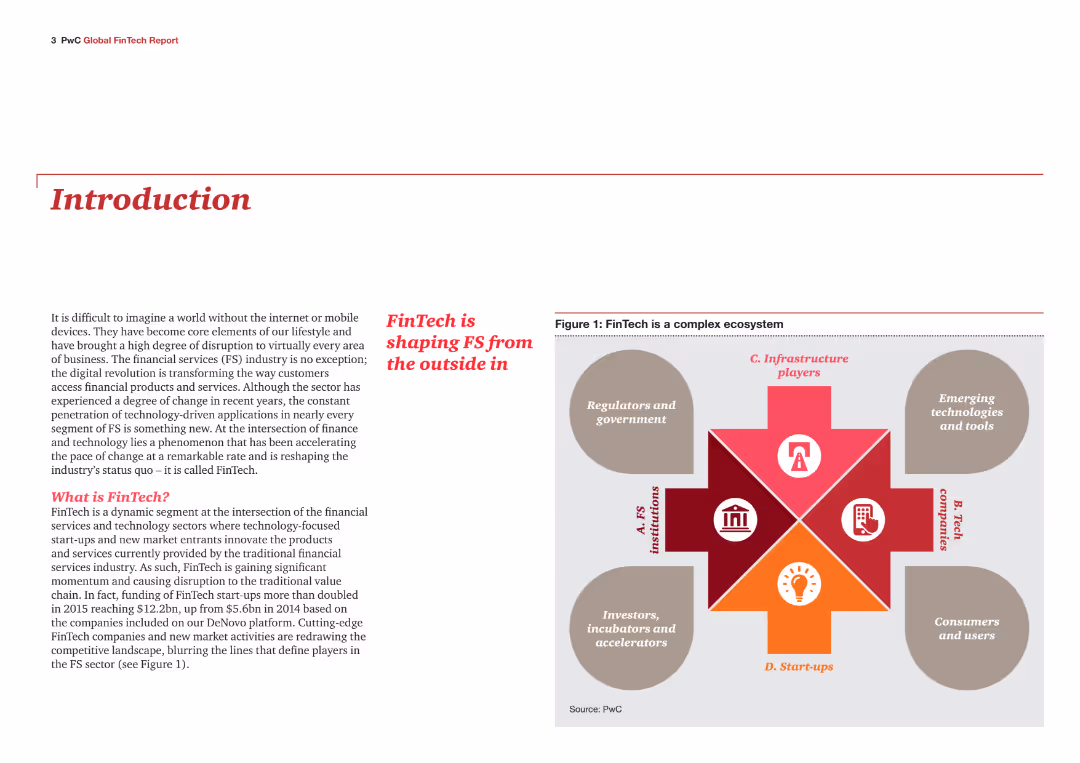
Introduction slide with text explaining the FinTech industry's impact on financial services. Includes an infographic showing the FinTech ecosystem, consisting of FS institutions, tech companies, start-ups, regulators, and government.
Industry Overview
Financial Services
This slide introduces the report on the FinTech industry's influence on financial services. It defines FinTech and highlights its role in transforming the industry through digital applications and technology-driven innovations, setting the stage for detailed analysis in the report.
FinTech, financial services, introduction, industry impact, digital transformation, ecosystem
Diagram
PwC/Strategy&
Saved
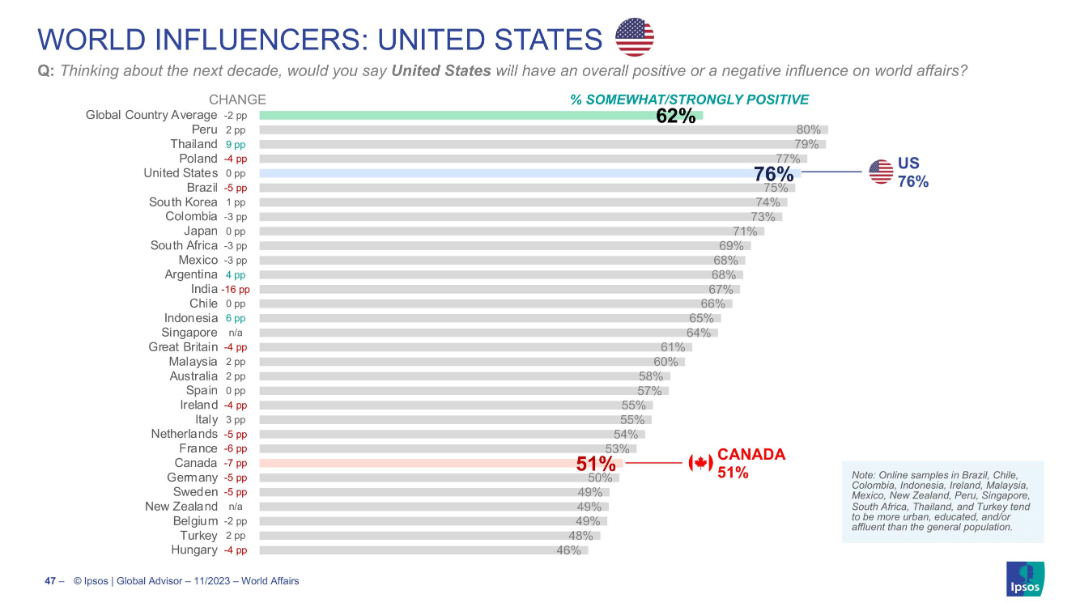
Horizontal bar chart showing global opinion on U.S. influence; Canada’s rating (51%) is highlighted
Market Analysis and Trends
Government & Public Sector
Presents global opinions on whether the U.S. will have a positive influence in the next decade. The U.S. scores 76% globally, but Canada shows a much lower 51% approval, marking a notable international divergence.
United States, global influence, perception, opinion, Canada comparison, bar chart, Ipsos, positive rating, diplomacy, trends
Single Chart
IPSOS
Saved
This slide presents two line charts: one showing the Global Supply Chain Pressure Index from December 2015 to June 2023, and another showing global commodity prices from January 2010 to June 2023.
Market Analysis and Trends
Financial Services
The slide examines the easing of supply chain pressures and the decline in commodity prices, discussing their implications for inflation and economic activity.
supply chain, commodity prices, inflation, economy
Multiple Chart
EY
Saved
The slide presents three line charts comparing sovereign EMD spreads, corporate EMD spreads, and local EMD yields over time, along with a table summarizing key metrics.
Market Analysis and Trends
Financial Services
The slide provides an update on emerging markets bonds, highlighting spread and yield trends. Useful for analyzing emerging markets investment.
emerging markets, bond market, spreads, yields, sovereign EMD, corporate EMD, financial analysis
Multiple Chart
Morgan Stanley
Saved
The slide is structured into three main sections with a focus on innovative solutions for addressing employee needs. It features flat design icons and graphics depicting various workplace scenarios, complemented by succinct bullet points. The design utilizes a green and blue color scheme that is both eye-catching and easy to follow, facilitating a clear understanding of the strategies discussed.
Human Resources and Talent Management
Professional Services
This slide details approaches to developing nuanced, holistic solutions for employee
DEI, market expansion, business strategy, inclusive practices, new opportunities, competitive advantage
Pillar
BCG
Saved
Displaying a dynamic office scene, this slide emphasizes the agility of risk teams. It includes a text section detailing the benefits of enhancing flexibility in operations to respond more effectively to emerging risks. The visual portrays a team in an active discussion, suggesting a collaborative approach to agile risk management.
Operational Efficiency
Technology & Software
The slide outlines key steps for risk teams to improve their agility in managing business risks. It focuses on the adoption of new technologies, faster data processing, and stronger partnerships as means to enhance response capabilities to rapidly changing market conditions. This slide is valuable for organizations aiming to increase their operational flexibility and risk responsiveness.
agility, risk management, operational efficiency, technology adoption, partnerships, collaboration
Mixed Chart
Accenture
Saved
Left side features percentage boxes, right side has a column chart
Market Analysis and Trends
Media & Entertainment
Adoption and expectations of generative AI in marketing, highlighting its integration into MarTech stacks
marketing, MarTech, generative AI, adoption, trends
Multiple Chart
Gartner
Saved
The slide is split into two parts, with one bar chart on the left showing oil demand and supply balance, and one column chart on the right showing global refining margins.
Market Analysis and Trends
Energy & Utilities
This slide discusses oil market fundamentals, highlighting supply-demand balance and refining margins, useful for understanding market dynamics in the energy sector.
oil demand, supply, refining margins, energy, market fundamentals
Multiple Chart
EY
Saved
The slide includes three column charts for different customer segments with supporting icons and bullet points highlighting banking features and strategies.
Market Analysis and Trends
Financial Services
Analyzes the bank's value proposition tailored to different customer segments, focusing on account types and associated services designed to meet varying financial needs.
value proposition, customer segments, banking, financial health, low-cost, full-service, relationship banking, checking accounts, market strategy
Multiple Chart
JP Morgan
Saved
Includes a detailed diagram categorizing H2 production technologies by primary source and conversion technology, along with associated hydrogen categories.
Technology and Digital Transformation
Energy & Utilities
Outlines different hydrogen production technologies, categorized into thermochemical, electrolysis, microbial, and photolytic methods, and their respective applications.
Hydrogen, conversion technologies, thermochemical, electrolysis, production methods
Diagram
Kearney
Saved
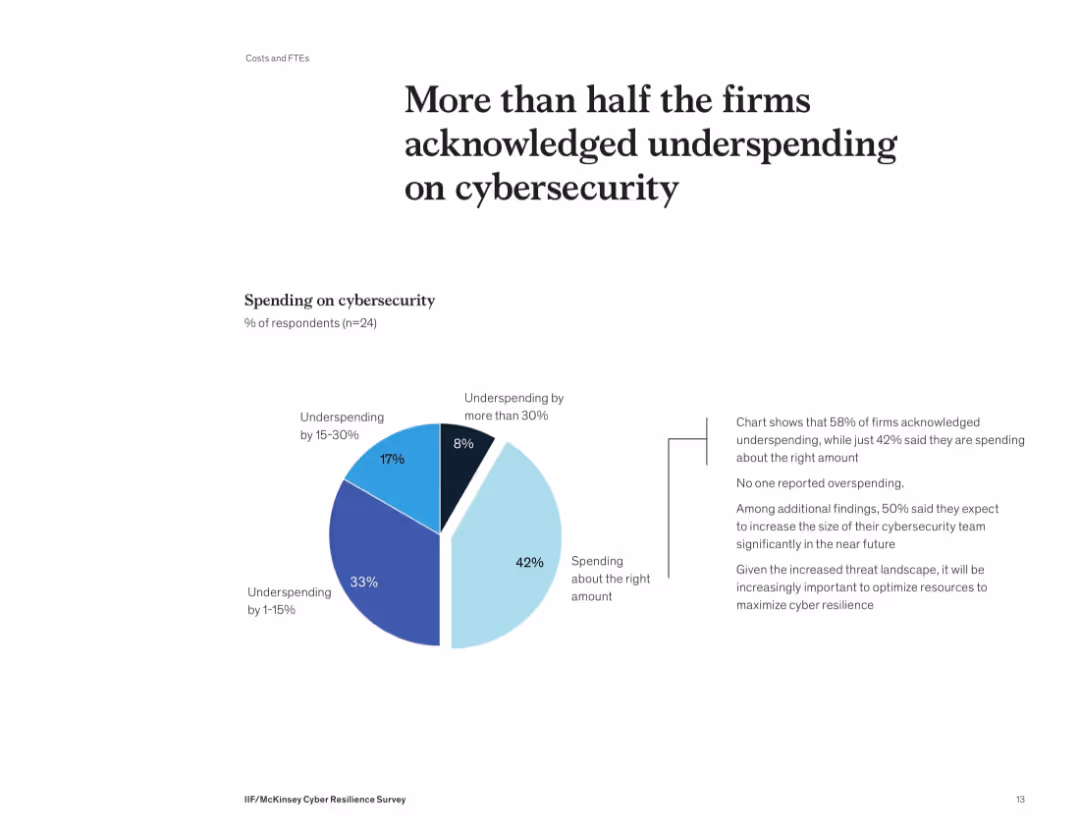
Donut-style pie chart showing distribution of cybersecurity spending levels. Supporting text on the right details implications of underinvestment.
Risk Assessment and Management
Financial Services
58% of firms admit they’re underspending on cybersecurity, with no firm reporting overspending. Many plan to grow their cybersecurity teams. The slide underscores the need to optimize security investments to align with growing threats and reduce risk exposure.
cybersecurity, budget, spending, underinvestment, risk, survey, financial firms
Mixed Chart
McKinsey
Saved
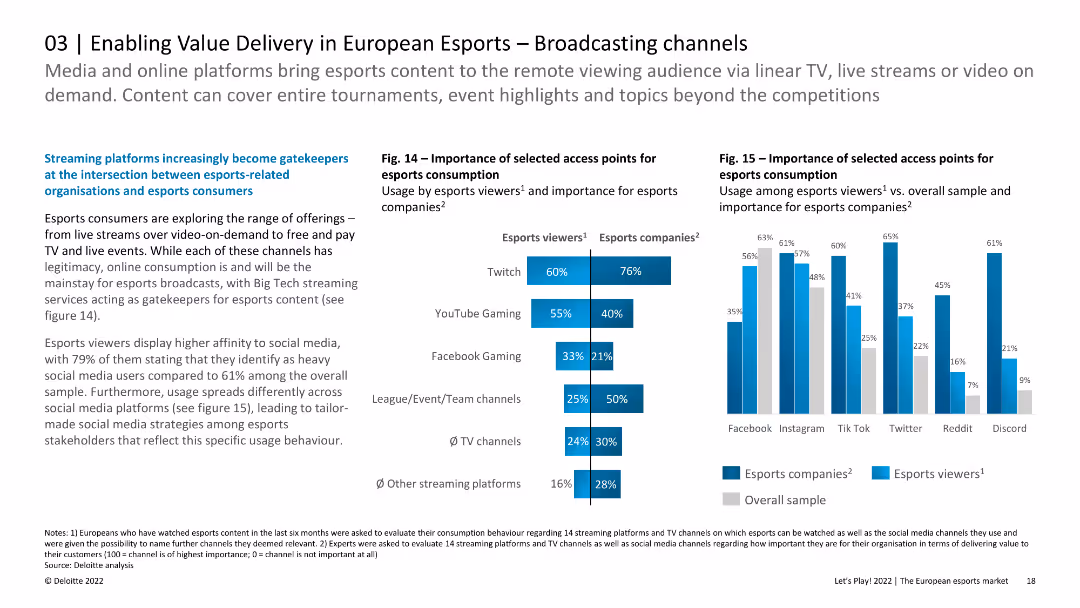
The slide includes column charts showing the importance of access points for esports consumption and usage among viewers. The layout is detailed and informative.
Strategic Planning
Media & Entertainment
The slide explores the role of various broadcasting channels in esports consumption in Europe, emphasizing the dominance of Twitch and YouTube Gaming. It discusses the importance of different access points for both viewers and esports companies.
Esports, Broadcasting, Channels, Europe, Consumption
Multiple Chart
Deloitte
Saved
Contains bar charts and financial summaries that detail profit and loss figures, enriched with notes explaining factors impacting the results, such as shareholder expenses and valuation adjustments.
Financial Performance
Financial Services
This slide covers the Q2 2023 financial results for Deutsche Bank's Corporate & Other segment, focusing on losses and specific financial impacts including shareholder expenses and provisions.
Corporate finance, financial losses, shareholder expenses, profit and loss analysis, Deutsche Bank, Q2 2023
Mixed Chart
Deutsche Bank
Saved
A line graph showing total shareholder return over time, comparing tech-forward companies to others. Text analyzes financial performance trends before, during, and after the pandemic.
Performance Metrics and KPIs
Technology & Software
The slide compares the total shareholder return of tech-forward companies with other companies, using a line graph to illustrate performance over different periods.
Shareholder Return, Financial Performance, Pandemic, Tech-Forward, Comparison
Mixed Chart
Accenture
Saved
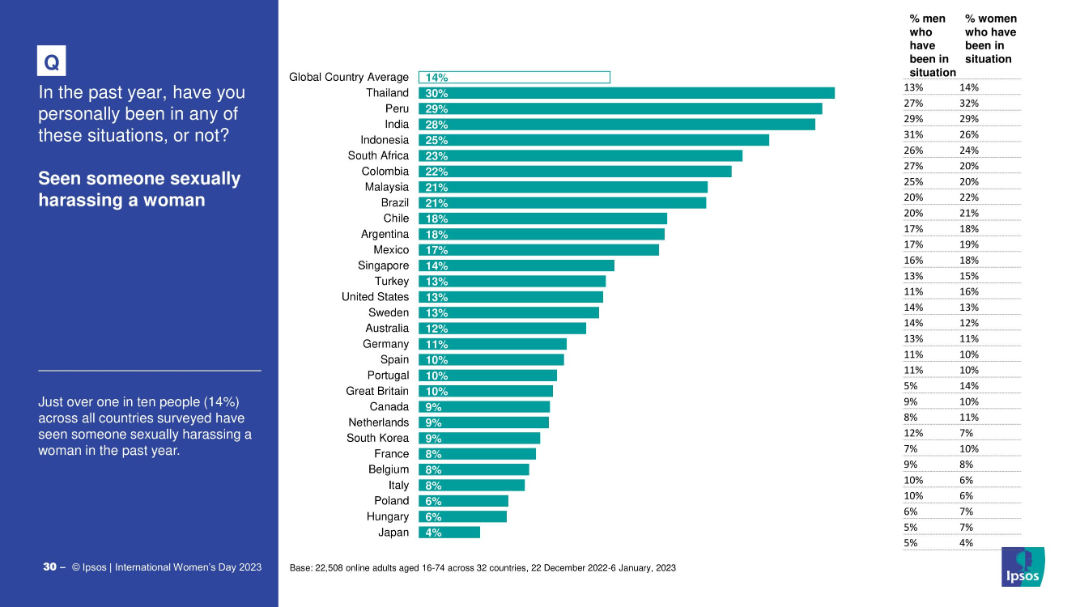
Country-wise bar chart on witnessing sexual harassment, with gender breakdown. Global average line included.
Risk Assessment and Management
Government & Public Sector
This slide presents global data on the percentage of people who witnessed sexual harassment of women in the past year. Thailand and Peru report the highest percentages, while Japan is lowest.
harassment, gender issues, observation statistics, global variance, witness data
Mixed Chart
IPSOS
Saved
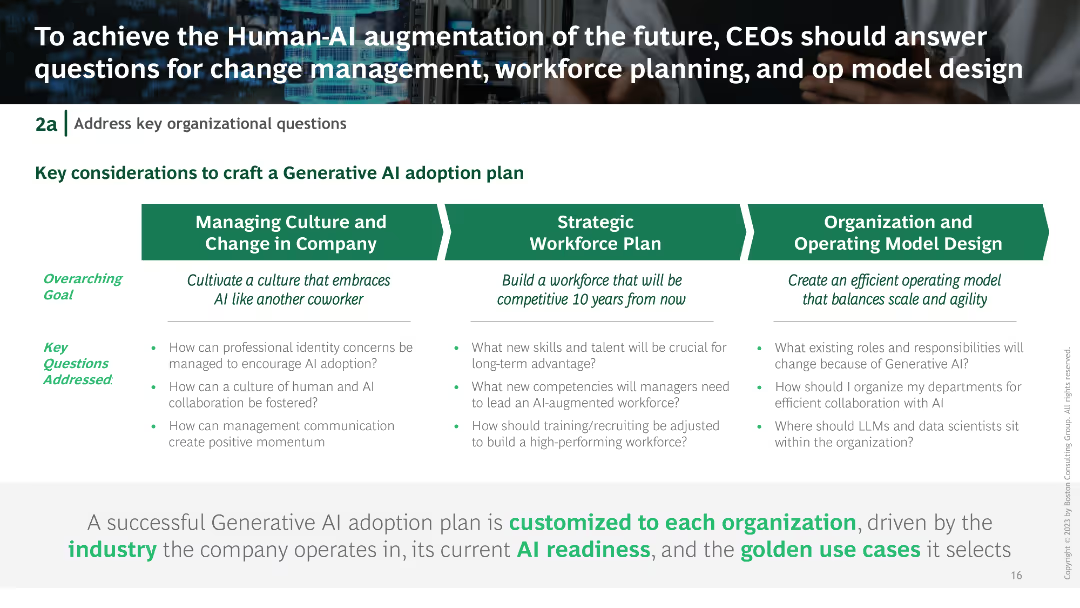
Text is organized in three columns with key considerations for crafting a generative AI adoption plan. Visual elements include icons and text boxes highlighting managing culture, workforce planning, and model design.
Organizational Structure and Change
Technology & Software
Discusses key organizational questions for generative AI adoption, including managing culture, strategic workforce planning, and operational model design.
AI adoption, organizational change, workforce planning, operational model, generative AI
Table
BCG
Saved
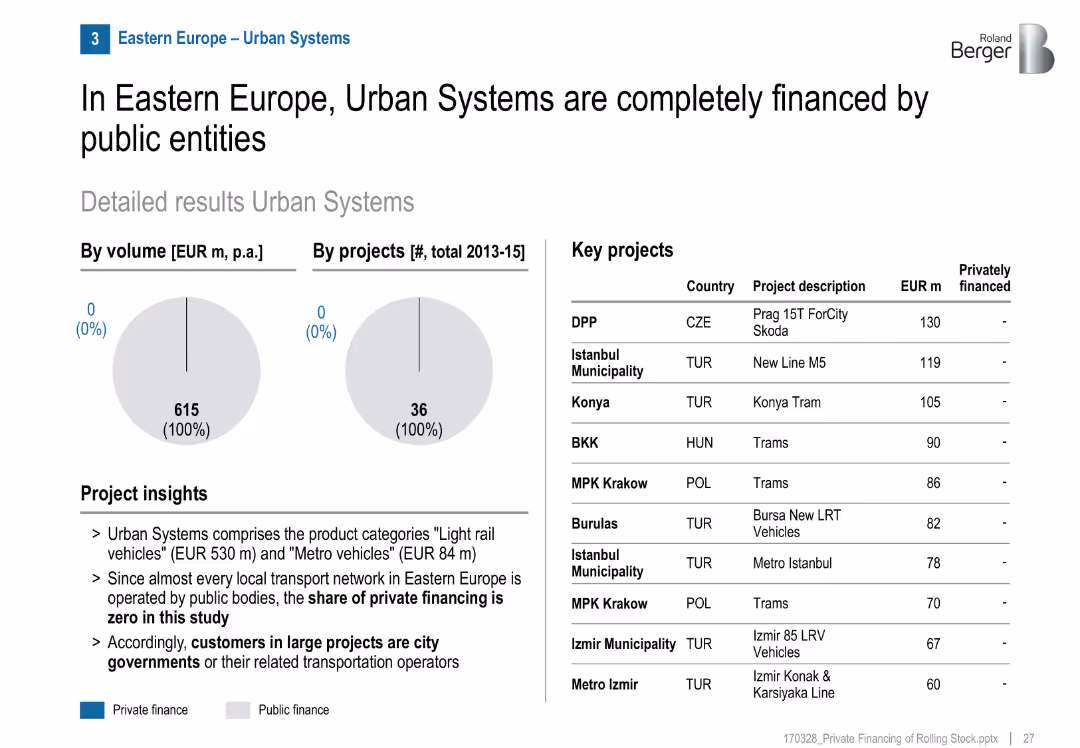
Two pie charts (volume and project count) showing 100% public finance; table listing key projects; project insights in bullet format; clean and structured layout.
Investment Analysis
Transportation & Logistics
The slide shows that from 2013–2015, all urban rail systems in Eastern Europe were publicly financed, with no private investment. Major urban transit projects are listed by cost.
urban systems, public finance, Eastern Europe, rail transport, light rail, metro, investment, municipalities, infrastructure
Mixed Chart
Roland Berger
Saved
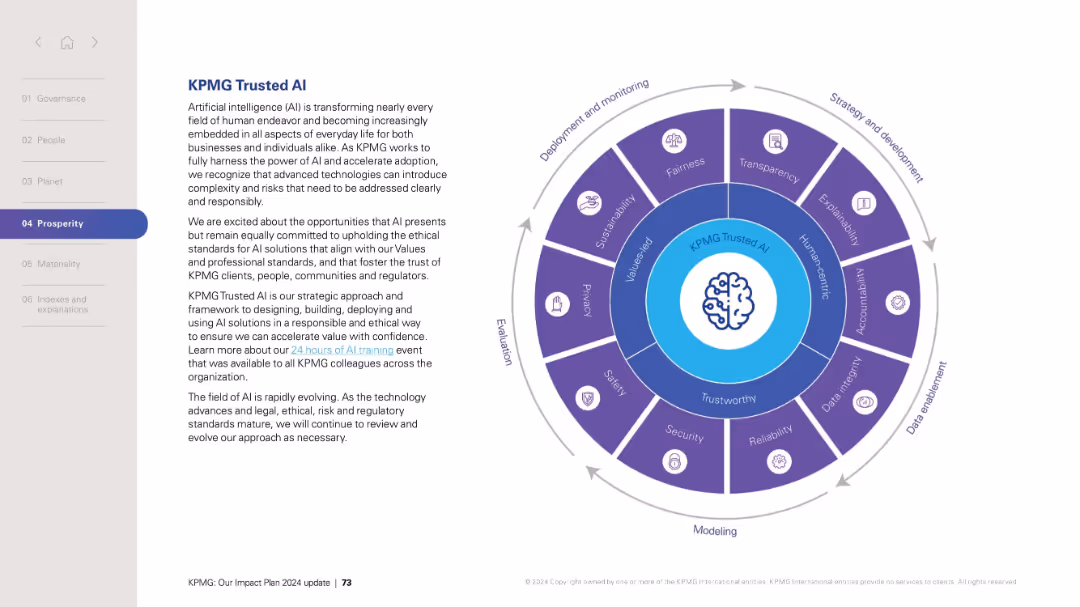
Left-aligned text with circular infographic on the right displaying AI ethics dimensions and stages of AI lifecycle.
Technology and Digital Transformation
Artificial Intelligence
Describes KPMG’s strategic approach to developing and deploying trustworthy AI systems. Emphasizes ethical AI, fairness, transparency, safety, and sustainability. The circular diagram segments AI development into phases and principles. This slide outlines a framework for responsible AI implementation aligned with corporate values and governance.
AI, ethics, responsible AI, trust, governance, deployment, fairness, transparency, safety, KPMG
Vertical Flow
KPMG
Saved
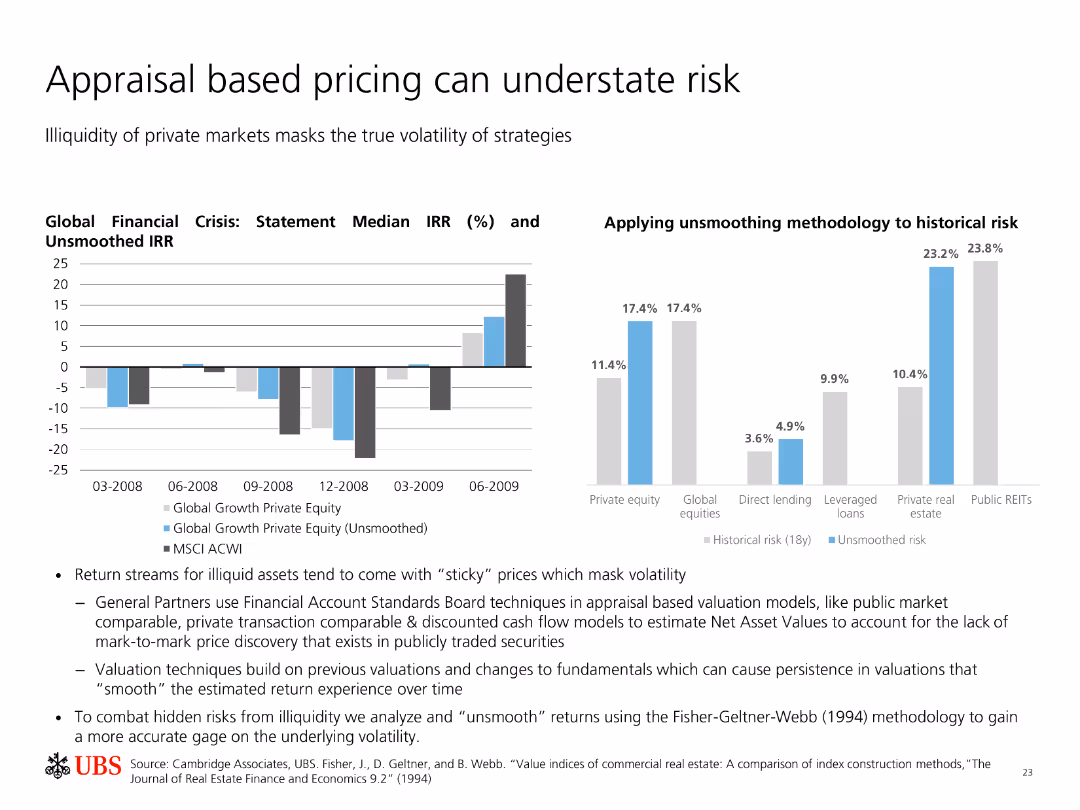
Two charts: one column chart showing IRR during the financial crisis, and another column chart comparing historical risk with unsmoothed risk.
Risk Assessment and Management
Financial Services
The slide discusses how illiquidity in private markets can mask true volatility. It shows the difference in performance when using smoothed vs. unsmoothed valuation models.
Appraisal, Risk, Volatility, Private Equity, Financial Crisis
Multiple Chart
UBS
Saved
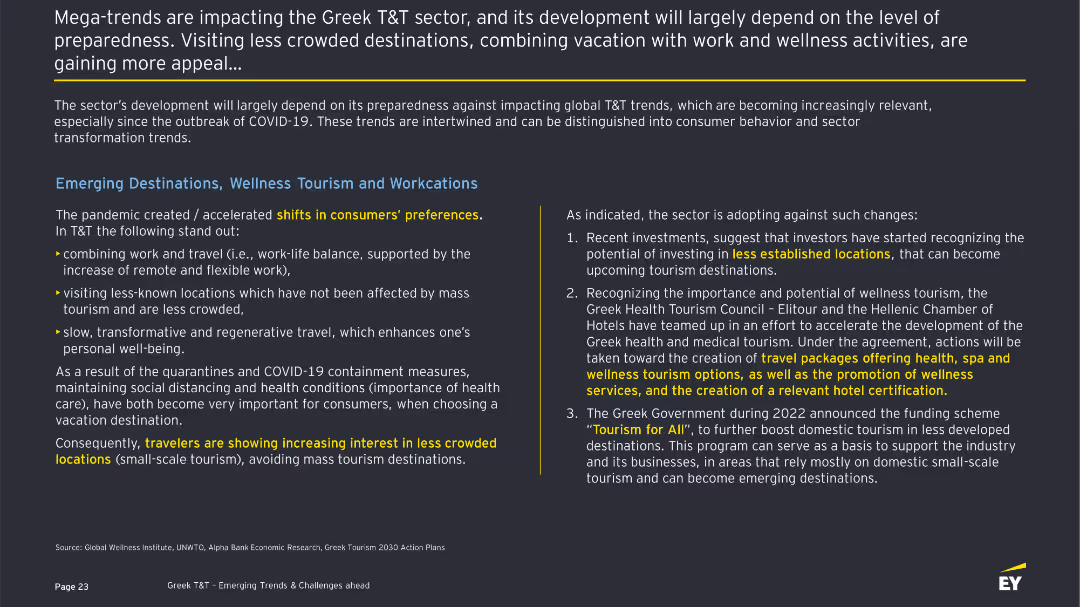
The slide discusses mega-trends impacting the Greek T&T sector, highlighting shifts in consumer preferences towards less crowded destinations, wellness tourism, and workcations. It includes bullet points and a summary of sector preparedness.
Strategic Planning
Hospitality & Tourism
Describes the impact of COVID-19 on consumer preferences in the T&T sector, with a focus on wellness tourism and workcations. It outlines key trends such as remote work, less crowded destinations, and the importance of health and safety measures.
Wellness, Workcations, Tourism, COVID-19, Trends
Header Horizontal
EY
Saved
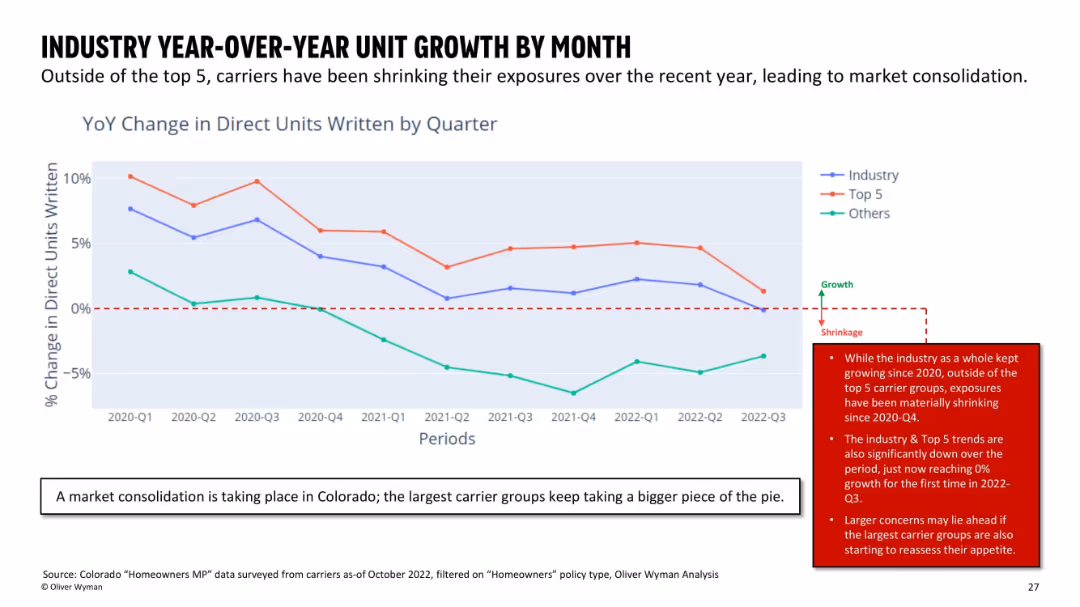
Line graph displaying trends from 2020 to 2022 for "Industry," "Top 5," and "Others" in terms of direct unit growth, with annotations and callouts.
Strategic Planning
Financial Services
Shows market consolidation trends in Colorado’s insurance market. While the top 5 carriers have maintained growth, other carriers have declined in unit growth since late 2020. Highlights inflection point at 2022-Q3 where industry growth hits 0%.
insurance industry, market consolidation, unit growth, Colorado, trendline
Mixed Chart
Oliver Wyman
Saved
Bar and line graph showcasing South Korea's testing and cases, with timeline events detailed on the bottom.
Risk Assessment and Management
Healthcare & Pharmaceuticals
Details South Korea's rigorous testing strategy and how it limited the COVID-19 spread, with specific dates and actions taken.
South Korea, testing strategy, COVID-19, case management
Single Chart
McKinsey
Saved
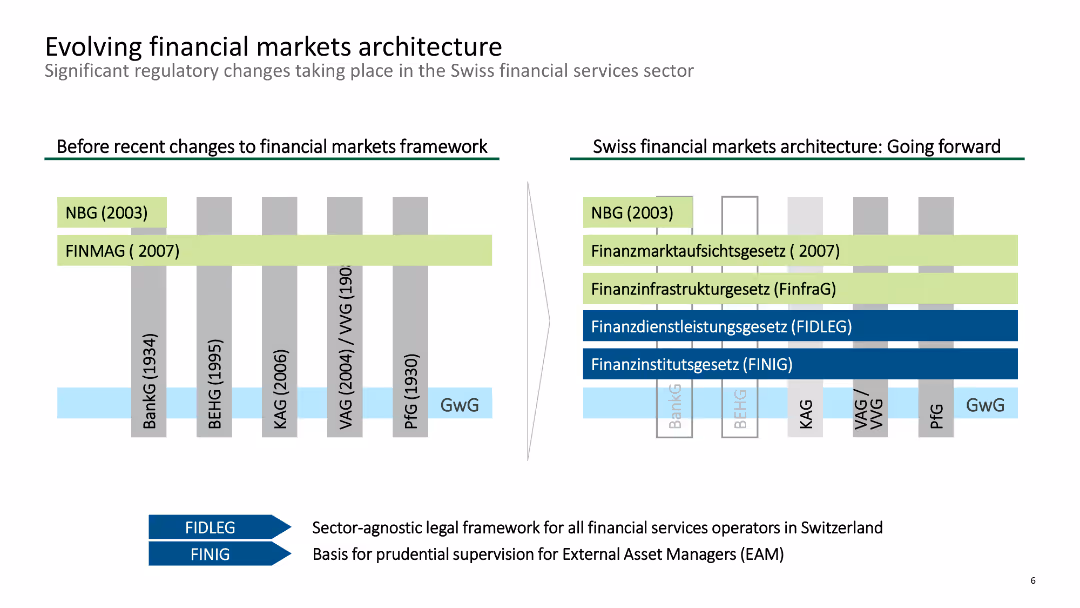
The slide includes two comparative diagrams of the Swiss financial markets architecture before and after regulatory changes.
Regulatory and Compliance
Financial Services
It depicts the significant regulatory changes in the Swiss financial markets framework, showing the old and new structures and the laws enacted to improve market operations.
financial, markets, architecture, regulatory, changes
Header Horizontal
Deloitte
Saved
The slide is split into two main sections. On the left, there is a bold title "STEP THREE: EMPOWER VULNERABLE LEARNERS" followed by a paragraph of text explaining the importance of making education and lifelong learning systems accessible. On the right, there is a bar chart titled "FIGURE 9: THE IMPACT OF INTELLIGENT TECHNOLOGIES ON WORKERS, BY SKILL LEVEL".
Technology and Digital Transformation
Technology & Software
The slide is designed to emphasize the third step in solving the skills gap crisis by empowering vulnerable learners. It discusses the accessibility of education to all, identifying workers at risk from technological disruption. The chart contrasts the percentage of time workers of different skill levels spend in roles subject to augmentation and automation.
skills crisis, empowerment, education, lifelong learning, technological disruption, automation, augmentation, vulnerable workers, skill gap, workforce training
Multiple Chart
Accenture
Saved
Previous
Next
If nothing, comes up, please save your slides first
Create a FREE account to continue browsing
Receive Instant Access to 1,000+ slides from companies like McKinsey, Google, and Goldman Sachs
First Name
Last Name
Email
Password
I agree to all
Terms & Privacy Policy
Thank you! Your submission has been received!
Oops! Something went wrong while submitting the form.
Have an account?
Sign in
Column Chart
Heatmap
Chevron
Org Chart
Infographic
Callouts
Timeline
List
Graphic
Picture
Process Flow
Diagram
Paragraph
Map
Table
Framework
Subtitle
Takeaway Box
Icon
Other Chart
Radar Chart
Waterfall Chart
Mekko Chart
Pie Chart
Scatter Plot
Line Chart
Bar chart
Bullet points