My Account
My Slides
Search by Category
Templates
Leave Feedback
Login
Logout
Get Started
Browse all Slides
Browse all Slides
Create a FREE Account
Instant access to 1,000+ real slides from top companies like McKinsey, BCG, Goldman Sachs, Google and many more!
First Name
Last Name
Email
Password
I agree to all
Terms & Privacy Policy
Thank you! Your submission has been received!
Oops! Something went wrong while submitting the form.
Have an account?
Sign in
Saved Slides
This slide illustrates year-over-year quarterly changes in volumes, price-mix, and currency with a trio of column charts. It features colored bars to represent growth or decline over quarters for 2022 and 2023, against a simple blue and white background. The Michelin logo is present at the bottom, and the overall design is clean, utilizing the brand's color palette.
Operational Efficiency
Financial Services
The slide analyzes quarterly performance in terms of volumes, price-mix, and currency impacts. It likely serves as an operational review tool to steer company strategies during periods of weak market demand. It may be used in management meetings or financial briefings to guide decision-making.
steering, volumes, price-mix, currency, performance, Michelin, operational, market, analysis, efficiency
Multiple Chart
Morgan Stanley
Saved
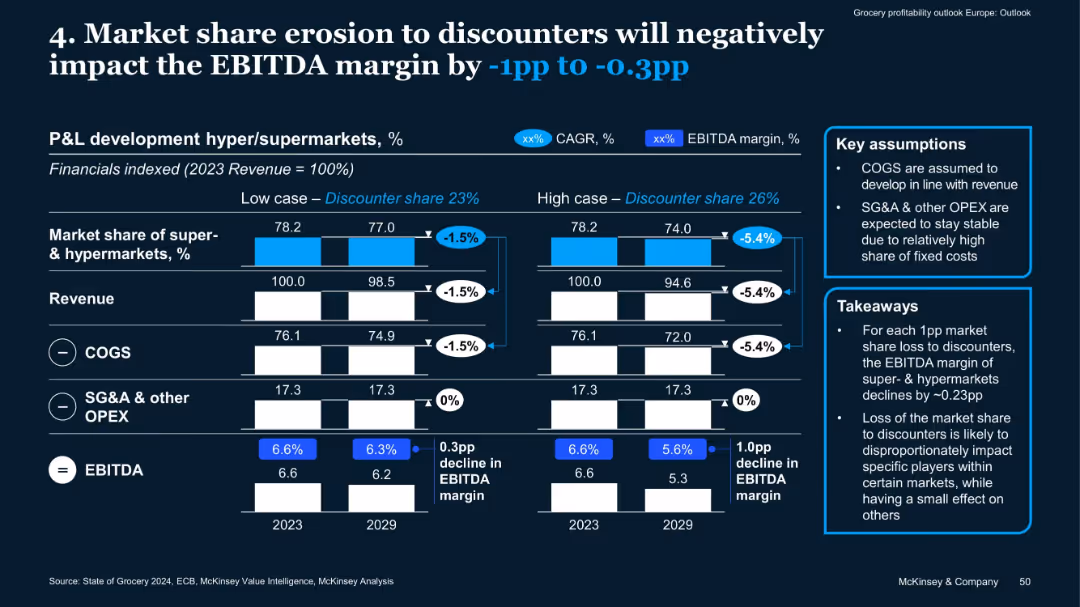
Dual scenario bar charts, revenue/COGS/SG&A breakdowns, key assumptions and takeaways in side boxes
Financial Performance
Retail & E-commerce
This slide analyzes how market share loss to discounters affects EBITDA margin of supermarkets/hypermarkets. In high and low scenarios, a 1–5.4% drop in revenue translates to 0.3–1.0pp EBITDA margin decline, driven mainly by lost volume.
EBITDA, market share, discounters, COGS, OPEX, revenue impact, margin
Mixed Chart
McKinsey
Saved
Comprises column chart and a timeline illustrating changes in Russia exposure due to market exits and currency fluctuations.
Regulatory and Compliance
Financial Services
Analyzes the reduction in financial exposure in Russia, driven by strategic exits and market conditions, highlighting changes in investment and the ongoing adjustments in regulatory compliance.
Russia, Financial Exposure, Compliance, Bar Charts, Investment, Currency, Market Exit, Banking
Mixed Chart
Citigroup
Saved
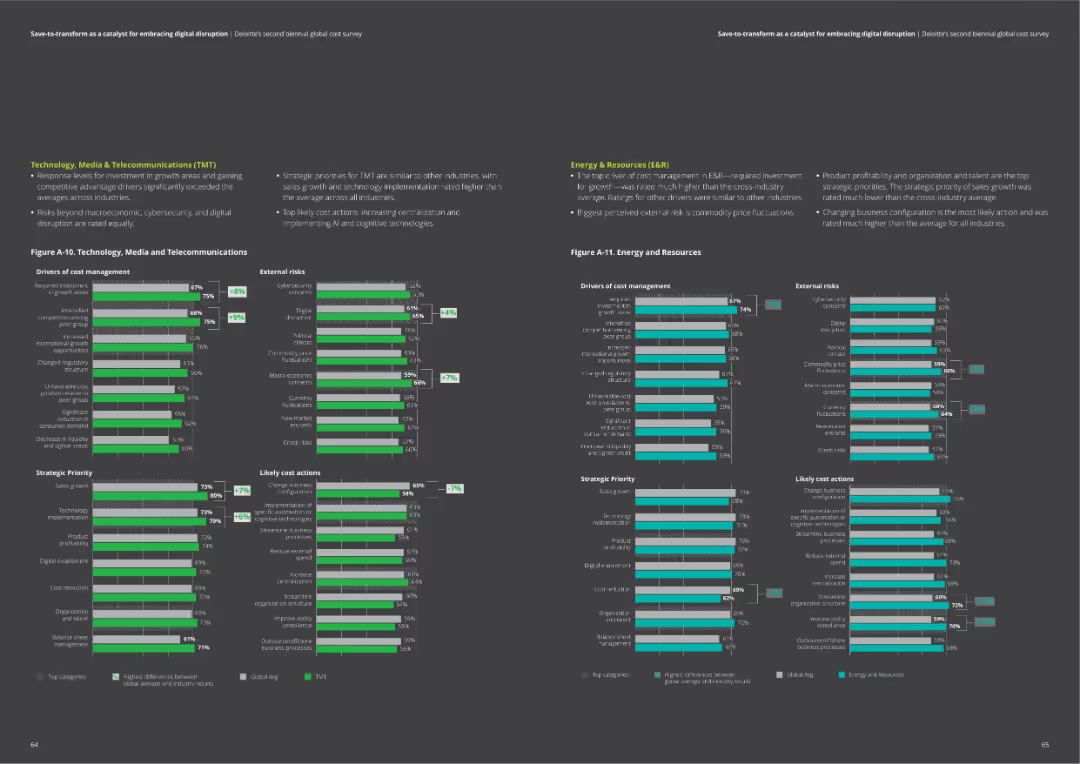
The slide includes two column charts comparing drivers of cost management, external risks, strategic priorities, and likely cost actions for Technology, Media & Telecommunications, and Energy & Resources.
Market Analysis and Trends
Professional Services
Provides detailed comparisons of cost management factors in TMT and Energy sectors. Useful for identifying key areas of focus and potential actions.
TMT, energy, cost drivers, risks, actions, priorities
Multiple Chart
Deloitte
Saved
Slide includes lists and icons under headings "PROGRESS" and "WORKSTREAMS", detailing steps in a 3-year transformation plan.
Operational Efficiency
Consumer Goods
Explains the operational transformation roadmap with anticipated benefits like margin enhancement and support of financial targets.
transformation, operational efficiency, margin enhancement, financial targets, roadmap, icons
Boxed
Barclays
Saved
This title slide showcases a sophisticated design with geometric cloud and edge computing icons over a dark blue background, emphasizing the topic of cloud and edge computing for the year 2022.
Technology and Digital Transformation
Technology & Software
Introducing McKinsey's 2022 Technology Trends, the slide is designed to set the stage for a detailed discussion on cloud and edge computing, highlighting it as a significant subject in the current technological landscape.
Technology Trends, Cloud Computing, Edge Computing, 2022
Title
McKinsey
Saved
The slide includes a diagram of the Canadian grain supply chain, detailing the stages from harvest to port, along with key statistics and logistical information.
Operational Efficiency
Transportation & Logistics
The slide provides a detailed overview of Canada's grain supply chain, highlighting the long transport distances and the efficiency of its port infrastructure.
Supply chain, logistics, Canada, transport distances, port infrastructure, grain export, harvest, storage, transportation, efficiency
Graphic
LEK
Saved
This slide is divided into three main sections, each highlighted in different colors representing phases: Flatten, Fight, Future. It includes bullet points and a source citation at the bottom. The text is balanced with the layout, making it easy to follow.
Strategic Planning
Professional Services
The slide outlines strategic measures for crisis management in three phases—Flatten, Fight, Future—detailing specific actions like deep-diving into outcomes, refining processes, and coordinating other areas from a response team. It serves to guide strategic crisis management during different operational phases.
crisis management, strategic planning, operational phases, Flatten, Fight, Future, response team, business continuity, process refinement, engagement
Table
BCG
Saved
A line graph showing the top 10 minutes viewed by P2+ in 2020 versus 2021, with lines representing each year and a noticeable decline in 2021.
Market Analysis and Trends
Media & Entertainment
The slide compares the top 10 minutes viewed in 2020 and 2021, showing a 9% year-over-year decline, reflecting changing viewer engagement patterns.
minutes viewed, comparison, 2020, 2021, decline
Single Chart
Nielsen
Saved
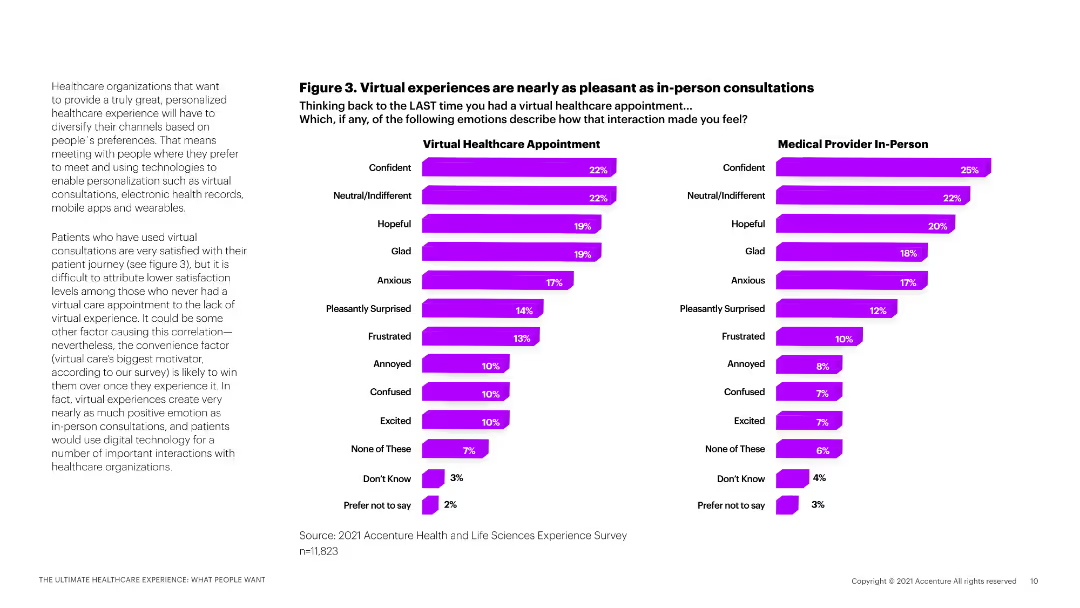
The slide includes two column charts comparing emotional responses to virtual healthcare appointments versus in-person consultations.
Market Analysis and Trends
Healthcare & Pharmaceuticals
This slide compares patient satisfaction and emotional responses between virtual and in-person healthcare consultations.
virtual healthcare, in-person consultations, patient satisfaction, emotional response, healthcare comparison
Multiple Chart
Accenture
Saved
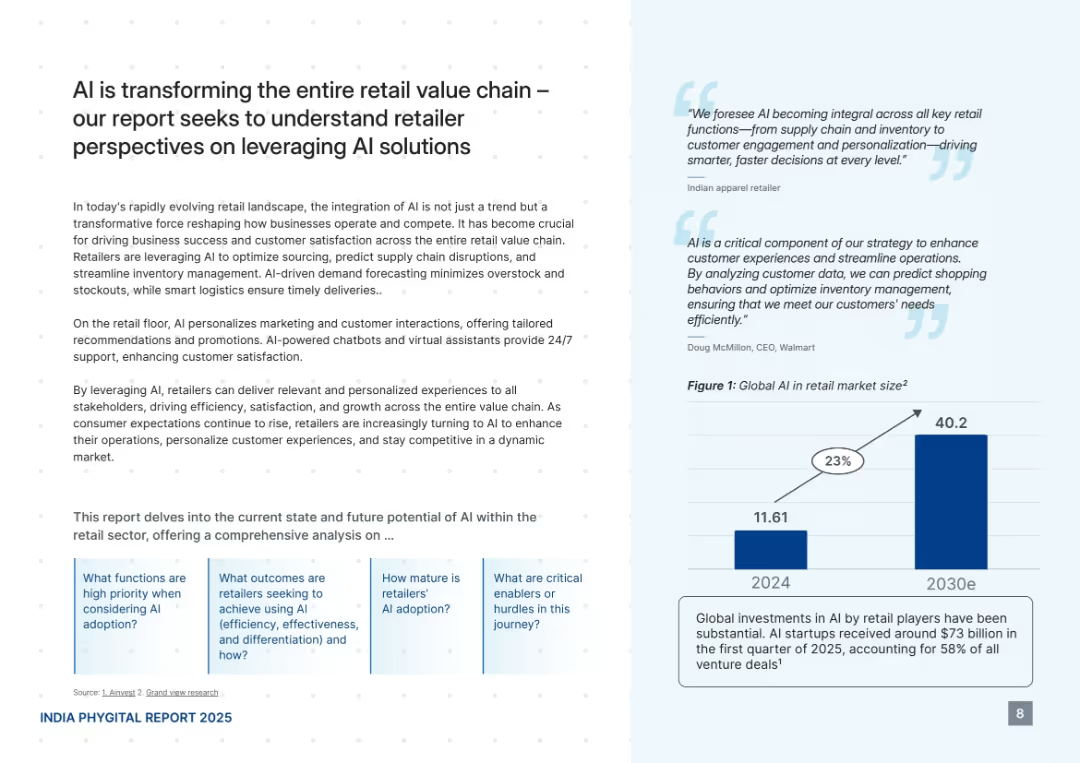
Clean white and light blue background. Divided into text-heavy left panel and light blue panel with quotes and a bar chart. Subtle dotted pattern.
Technology and Digital Transformation
Retail & E-commerce
This slide discusses how AI is reshaping the retail sector through personalized customer interactions, smarter logistics, and data-driven insights. It includes insights from retailers and CEOs, plus a projected growth chart showing the global AI retail market increasing from $11.61B in 2024 to $40.2B by 2030.
AI, retail, transformation, personalization, logistics, market size, chatbot, supply chain, Walmart, insights
Mixed Chart
PwC/Strategy&
Saved
This slide features a line chart comparing the likelihood of homeowners listing their homes for sale over several years. It uses two lines: one for very/somewhat likely (purple) and another for very likely (orange).
Market Analysis and Trends
Real Estate & Construction
The slide analyzes survey data on the likelihood of homeowners listing their homes for sale, indicating trends in seller behavior and market sentiment.
likelihood, listing home, survey, seller behavior, market sentiment
Single Chart
IPSOS
Saved
Slide includes a mix of textual information, divided into sections with headers and bullet points.
Risk Assessment and Management
Financial Services
This slide analyzes the credit performance of a financial institution, specifically focusing on loan delinquencies and loss mitigations. It is aimed at evaluating the credit risk management and recovery strategies in place.
Credit, Performance, Loans, Delinquency, Risk Management, Forbearance, Financial Institution, Loss Mitigation
Header Vertical
Morgan Stanley
Saved
The slide includes a scatter plot comparing cost efficiency and capital efficiency among banks. Text boxes explain the efficiency and profitability of UBS's personal and corporate banking.
Operational Efficiency
Financial Services
This slide showcases UBS's cost and capital efficiency, comparing it to Swiss and European peers, and highlights its superior profitability.
Cost Efficiency, Capital Efficiency, UBS, Banking, Profitability
Mixed Chart
UBS
Saved
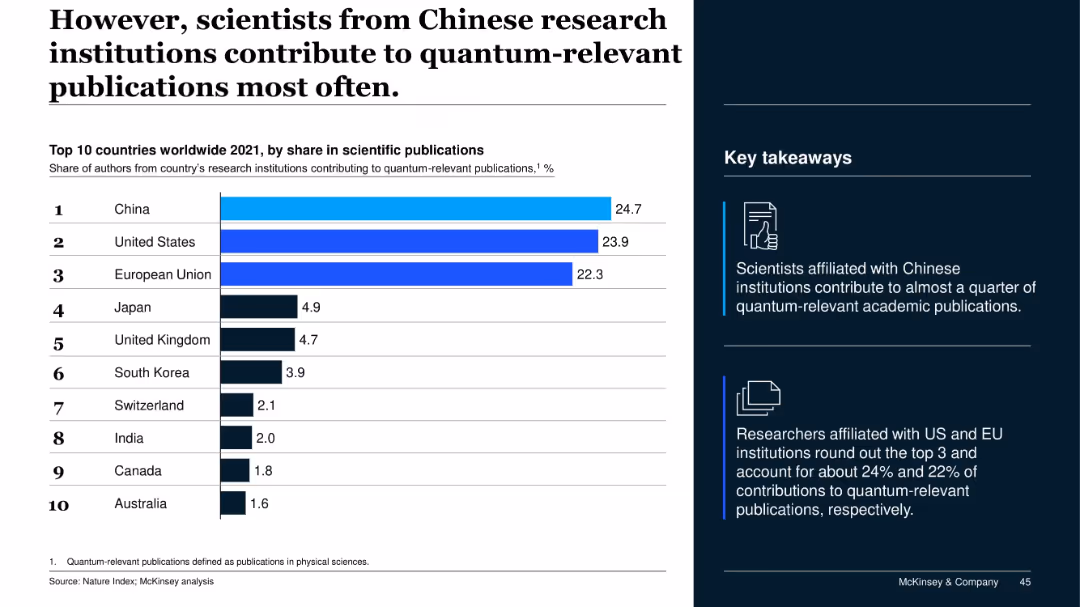
Bar chart ranking top 10 countries by author contribution to quantum publications; supportive key insights provided.
Industry Overview
Education & Training
This slide analyzes scientific contributions to quantum publications, with China leading marginally ahead of the US. The EU ranks third. The data reflects institutional authorship and global academic participation.
quantum research, scientific authorship, academic publishing, China, US, EU, Nature Index
Mixed Chart
McKinsey
Saved
The slide has a dominant column chart showing the AWM adjusted expense over years with portions marked for investments, volume-/revenue-related, and structural changes. To the right, there's a column chart depicting the breakdown of expense types and investment focuses.
Operational Efficiency
Financial Services
Detailing the relation between increased expenses and revenue growth, the slide breaks down investment areas and their impact on the firm's financials. Likely to be used in financial planning or cost management sessions.
expenses, revenue, investment, asset management, cost analysis
Mixed Chart
JP Morgan
Saved
A content slide with text on the left and a column chart on the right. The chart lists significant ways organizations are using machine learning and AI.
Technology and Digital Transformation
Financial Services
This slide discusses the adoption of AI in risk management, highlighting key applications like fraud detection, data analysis, and operational task automation.
AI, machine learning, risk management, technology, adoption
Multiple Chart
EY
Saved
A slide with a title, a column chart displaying family law expenditure per finalisation, and a breakdown table of court FTE indicative for FCoA and FCC. Red is used for higher costs, green for lower.
Regulatory and Compliance
Government & Public Sector
The slide offers a cost comparison of family law finalisation in FCoA and FCC, showing the FCC as more cost-effective and discussing the factors contributing to the cost differences between the two courts.
cost efficiency, FCoA, FCC, finalisation expenditure, judicial resource allocation, legal system
Mixed Chart
PwC/Strategy&
Saved
Features bulleted lists, bar graphs, and a mobile app interface highlighting physical and mental health strategies. The slide uses a mix of green and dark tones for visual separation.
Human Resources and Talent Management
Healthcare & Pharmaceuticals
Focuses on workplace safety and mental health management. It covers strategies like stress management, hygiene standards, and mental health training benefits, with a service provider example showing impact on stress and burnout rates.
Employee safety, Mental health, Stress management, Burnout, Hygiene
Header Vertical
BCG
Saved
This slide includes a table-like structure categorizing the company's service evolution over decades. It uses blue and white colors, with clear distinctions between each service and time period.
Strategic Planning
Financial Services
It provides a historical overview of the company's evolution, highlighting expansion into new service areas like digital wealth and banking-as-a-service, illustrating the dynamic growth and innovation of the firm.
service evolution, digital wealth, banking-as-a-service, historical overview, innovation
Table
Goldman Sachs
Saved
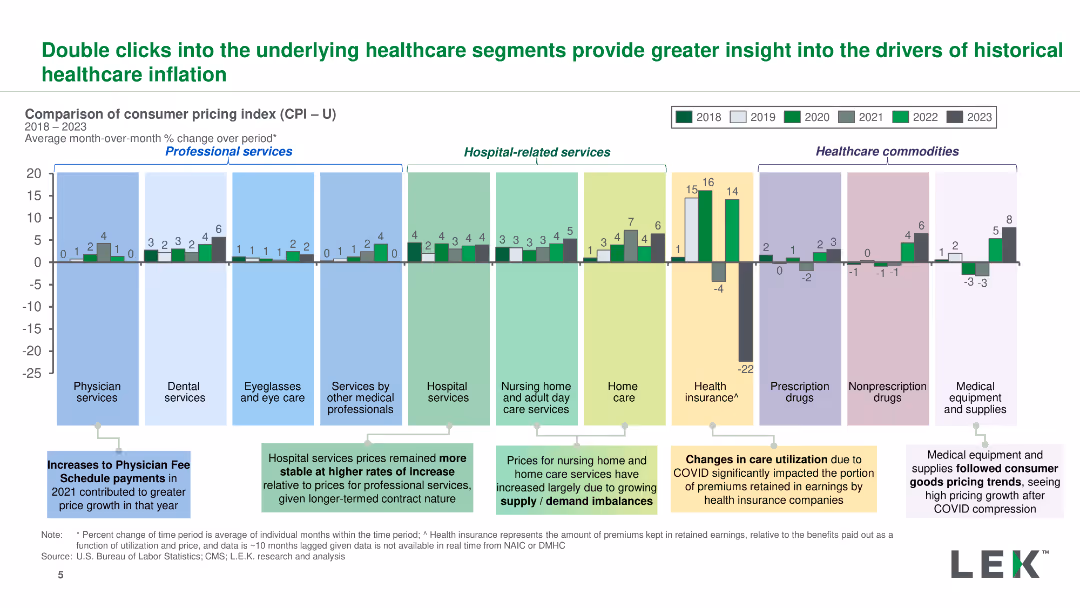
A bar chart showing the month-over-month percentage change in consumer pricing index for various healthcare segments from 2018 to 2023, with detailed labels and color coding.
Product and Service Analysis
Healthcare & Pharmaceuticals
The slide analyzes healthcare pricing trends across different segments, highlighting significant changes and the impact of COVID-19 on healthcare costs.
healthcare, pricing, segments, COVID-19, analysis
Single Chart
LEK
Saved
Title, several bar charts detailing impacts of digital initiatives in the chemistry sector, mentions of "Digital R&D" and "Digital Plant".
Technology and Digital Transformation
Industrial & Manufacturing
Discusses how digitalization could transform the chemistry and advanced materials industry, emphasizing potential societal benefits like reduced emissions and injury rates.
chemistry, digitalization, societal benefits, emissions reduction, industry transformation
Mixed Chart
Accenture
Saved
The slide features several pie charts on loan distribution by type and geography and a comprehensive table summarizing the loan portfolio.
Risk Assessment and Management
Financial Services
Delivers a snapshot of the credit risk associated with the loan portfolio, showing loan sizes, security, and sectoral and geographical spread. Used in risk management to evaluate and discuss loan distributions and associated credit risks.
Credit Risk, Loan Portfolio, Corporate, Wealth Management, Real Estate, Consumer, Geographic Distribution, Loan Security, Key Metrics, Total Loans
Multiple Chart
Goldman Sachs
Saved
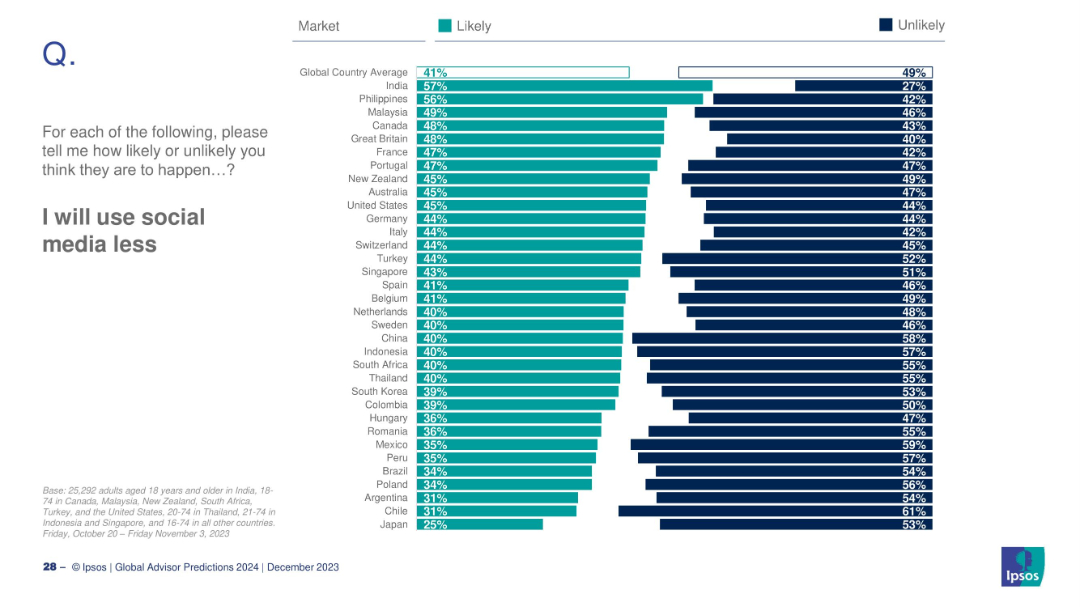
Horizontal bar chart showing social media usage intentions across countries
Market Analysis and Trends
Media & Entertainment
This slide examines public sentiment about potential future reduction in social media use. It highlights the percentage of respondents by country who expect to use social media less in the coming year, with contrasting views also displayed.
social media, digital behavior, tech trends, usage decline, country views
Mixed Chart
IPSOS
Saved
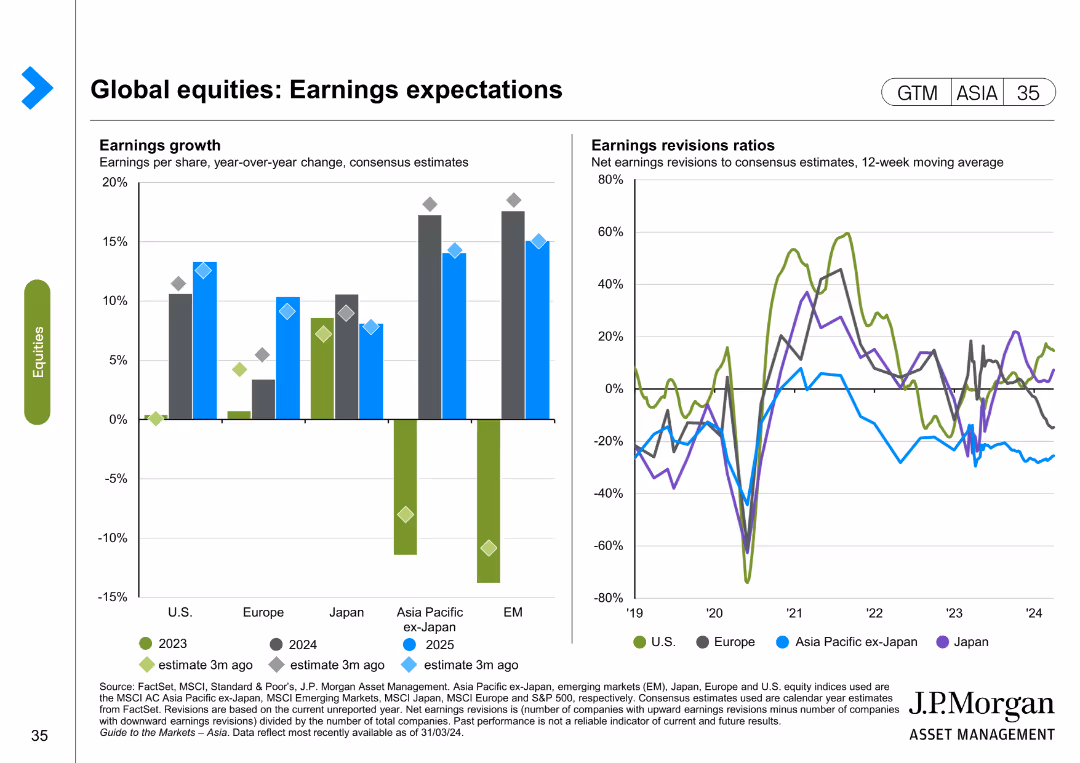
The slide includes two charts: a column chart for earnings growth and a line chart for earnings revisions ratios. The layout is detailed and moderately complex.
Investment Analysis
Financial Services
This slide presents expectations for global equity earnings, showing both growth projections and revisions ratios over recent periods.
earnings expectations, equity earnings, growth projections, earnings revisions, investment analysis
Multiple Chart
JP Morgan
Saved
Previous
Next
If nothing, comes up, please save your slides first
Create a FREE account to continue browsing
Receive Instant Access to 1,000+ slides from companies like McKinsey, Google, and Goldman Sachs
First Name
Last Name
Email
Password
I agree to all
Terms & Privacy Policy
Thank you! Your submission has been received!
Oops! Something went wrong while submitting the form.
Have an account?
Sign in
Column Chart
Heatmap
Chevron
Org Chart
Infographic
Callouts
Timeline
List
Graphic
Picture
Process Flow
Diagram
Paragraph
Map
Table
Framework
Subtitle
Takeaway Box
Icon
Other Chart
Radar Chart
Waterfall Chart
Mekko Chart
Pie Chart
Scatter Plot
Line Chart
Bar chart
Bullet points