My Account
My Slides
Search by Category
Templates
Leave Feedback
Login
Logout
Get Started
Browse all Slides
Browse all Slides
Create a FREE Account
Instant access to 1,000+ real slides from top companies like McKinsey, BCG, Goldman Sachs, Google and many more!
First Name
Last Name
Email
Password
I agree to all
Terms & Privacy Policy
Thank you! Your submission has been received!
Oops! Something went wrong while submitting the form.
Have an account?
Sign in
Saved Slides
Slide includes side-by-side column charts comparing the purchase intent for new and used cars over time.
Market Analysis and Trends
Transportation & Logistics
Details the changes in new and used car purchase intent over successive time periods during the COVID-19 pandemic.
car buying, market trends, new cars, used cars, consumer insight
Multiple Chart
McKinsey
Saved
Two charts: a line chart showing unemployment rates from 2014-2023 for various regions, and a column chart showing nominal wage growth rates for Q3 2023 compared to 2017-19 average for various countries.
Market Analysis and Trends
Financial Services
The slide discusses rebalancing labor markets leading to easing wage growth pressures and positive inflation-adjusted wage growth, supporting purchasing power.
labor markets, wage growth, unemployment, purchasing power, inflation-adjusted, 2023
Multiple Chart
EY
Saved
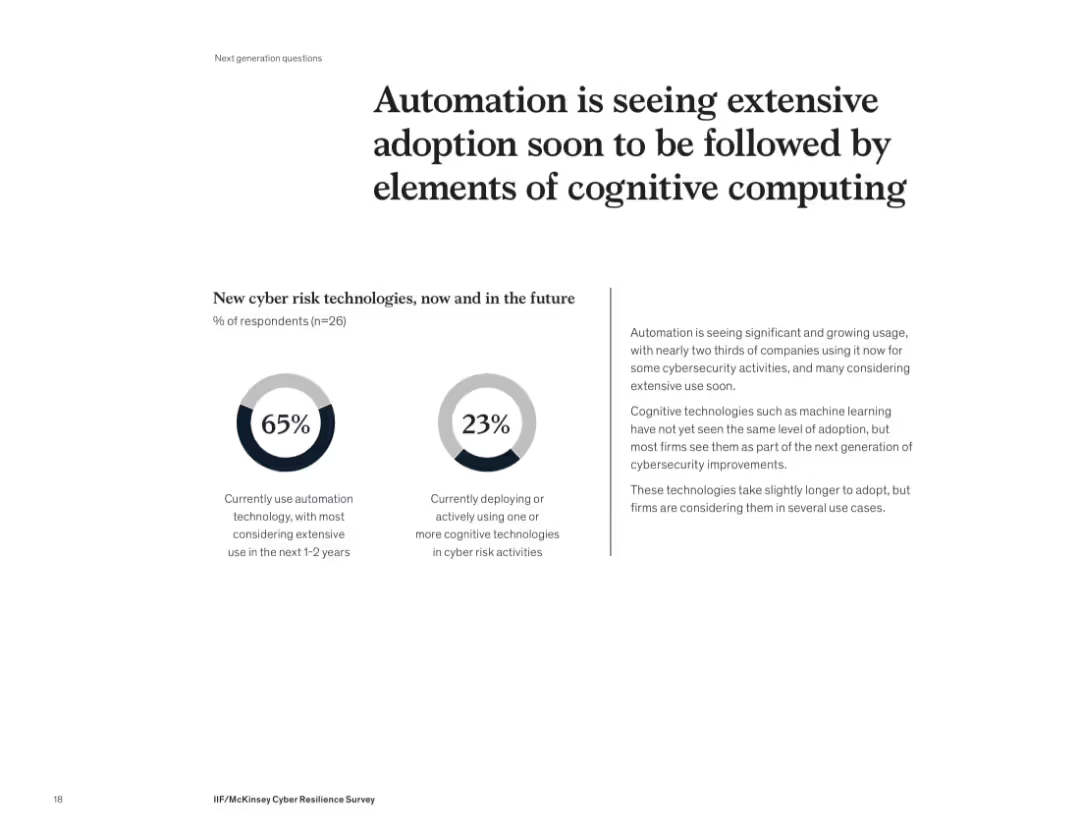
Two circular infographic metrics with accompanying explanation on right
Technology and Digital Transformation
Artificial Intelligence
This slide highlights the growing use of automation and anticipated rise in cognitive computing in cybersecurity. 65% of companies currently use automation, while only 23% are using cognitive tools like AI or machine learning, suggesting a future shift toward more intelligent cyber risk technologies.
automation, cognitive computing, AI, cybersecurity, adoption, innovation, machine learning, technology
Mixed Chart
McKinsey
Saved
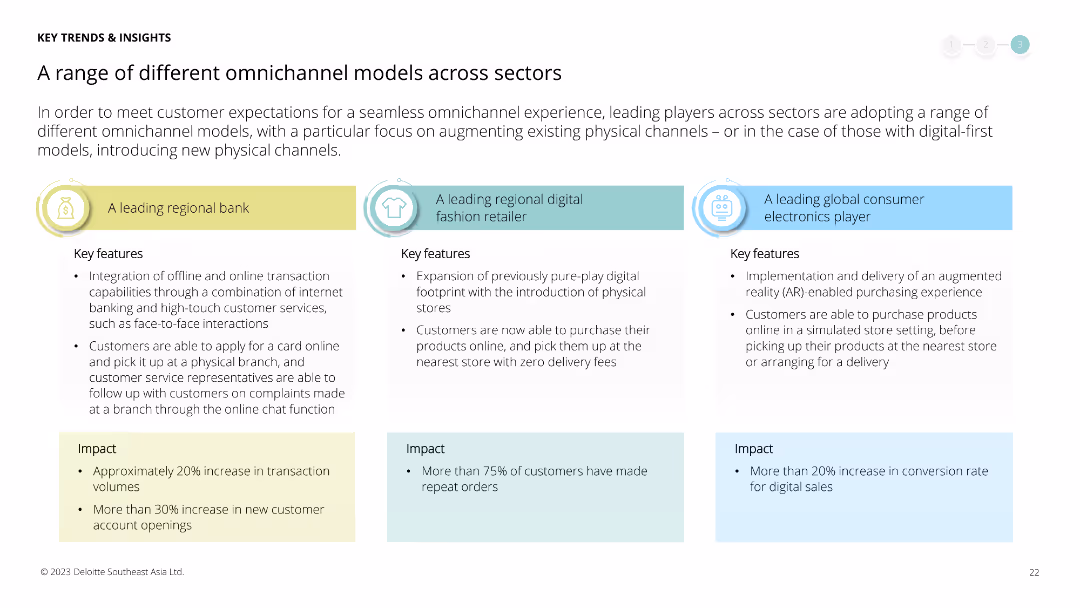
Comparative analysis of three omnichannel models used by a regional bank, a digital fashion retailer, and a global consumer electronics player. Text boxes explain key features and impacts for each.
Operational Efficiency
Retail & E-commerce
Provides case studies of omnichannel strategies across different sectors, comparing their implementation and impact on transaction volumes and customer engagement.
omnichannel, case study, retail, banking, fashion, consumer electronics, digital commerce, customer engagement, impact
Pillar
Deloitte
Saved
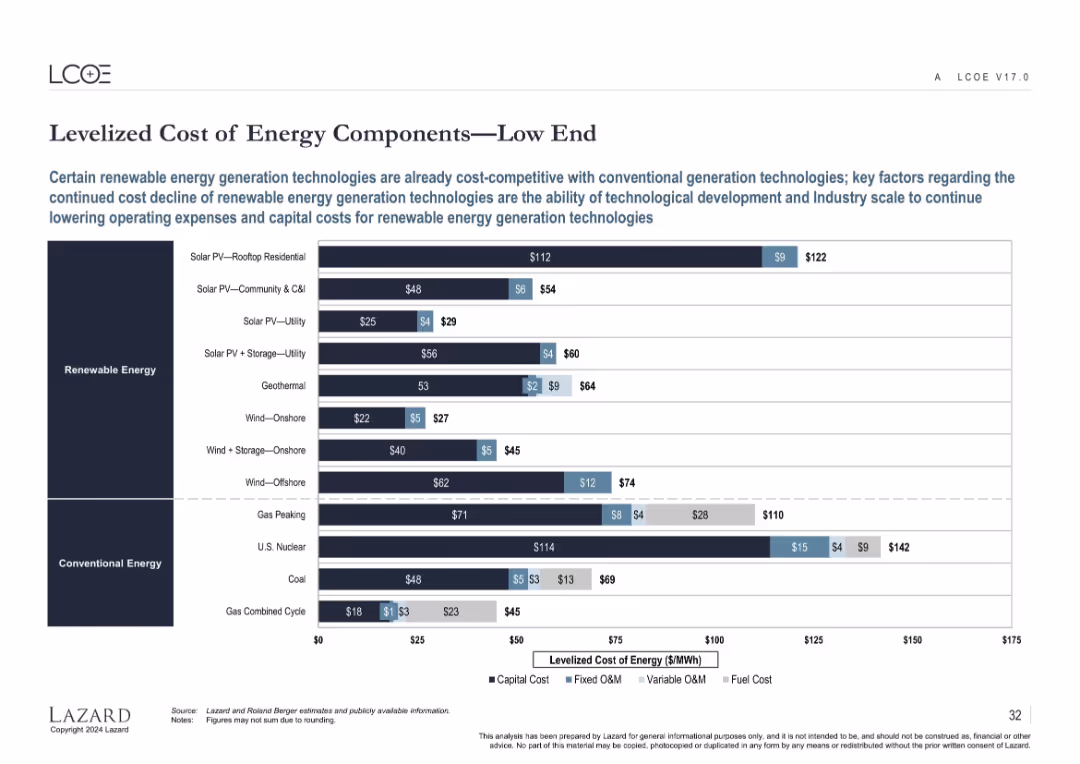
Horizontal bar chart decomposing LCOE for various renewable and conventional energy types at the low-cost end.
Performance Metrics and KPIs
Energy & Utilities
Shows the capital and operating cost breakdowns for renewable and conventional energy technologies at the low end of the cost spectrum. Highlights how some renewables are now cost-competitive or cheaper than fossil-based power generation.
LCOE, capital cost, fixed O&M, variable O&M, fuel cost, renewable energy, cost structure
Single Chart
Roland Berger
Saved
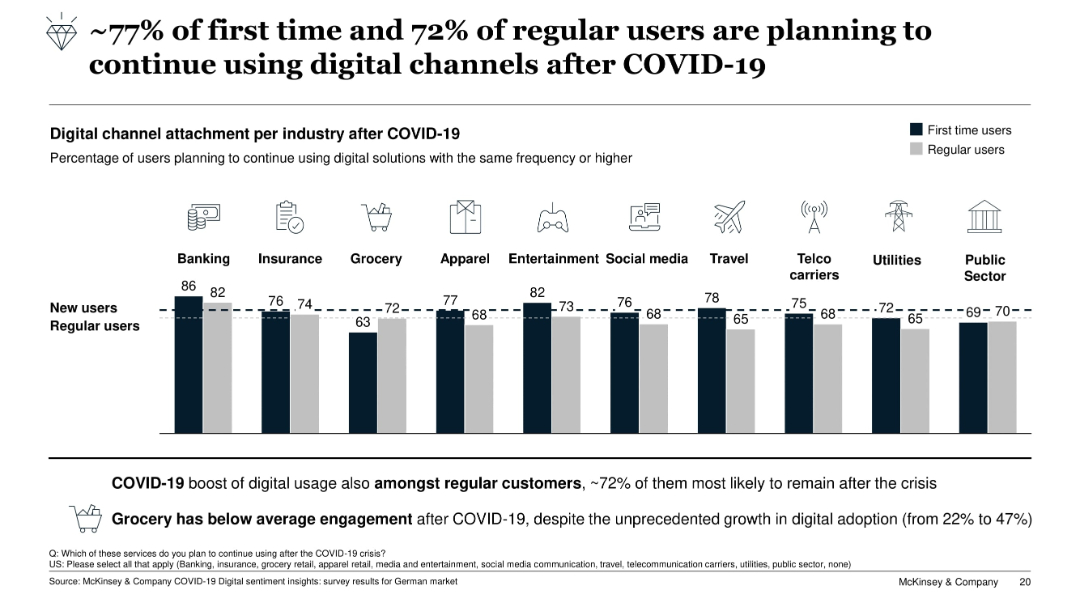
Bar chart comparing percentage of first-time vs regular users intending to continue using digital channels post-COVID-19, categorized by industry
Strategic Planning
Technology & Software
This slide shows strong digital channel retention post-COVID-19, especially in banking and entertainment. Even first-time users are likely to continue. Grocery shows the weakest engagement retention. The trend underscores the pandemic’s push towards permanent digital habits.
digital adoption, COVID-19, consumer behavior, retention, grocery, banking, user trends
Single Chart
McKinsey
Saved
Horizontal bar chart showing contributions to order book growth from various sectors. Uses different colors for each sector and additional columns for order book impact.
Market Analysis and Trends
Financial Services
Analyzes the contributions of different sectors to order book growth, including public sector, CPG, financial services, travel, and big tech, with and without COVID-19 impact.
order book, growth, sectors, impact, analysis
Single Chart
IPSOS
Saved
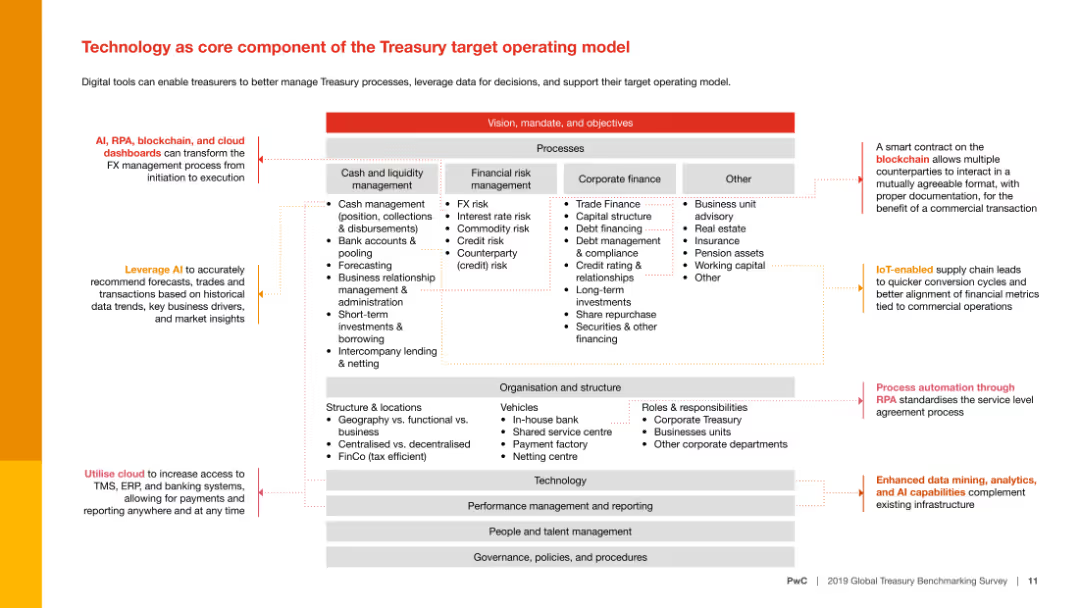
A complex slide with a diagram displaying different processes within the Treasury target operating model. It includes various elements such as arrows and text blocks.
Technology and Digital Transformation
Financial Services
This slide discusses how technology, including AI, RPA, blockchain, and cloud dashboards, can enhance Treasury processes and support decision-making.
Technology, AI, RPA, blockchain, cloud, Treasury
Diagram
PwC/Strategy&
Saved
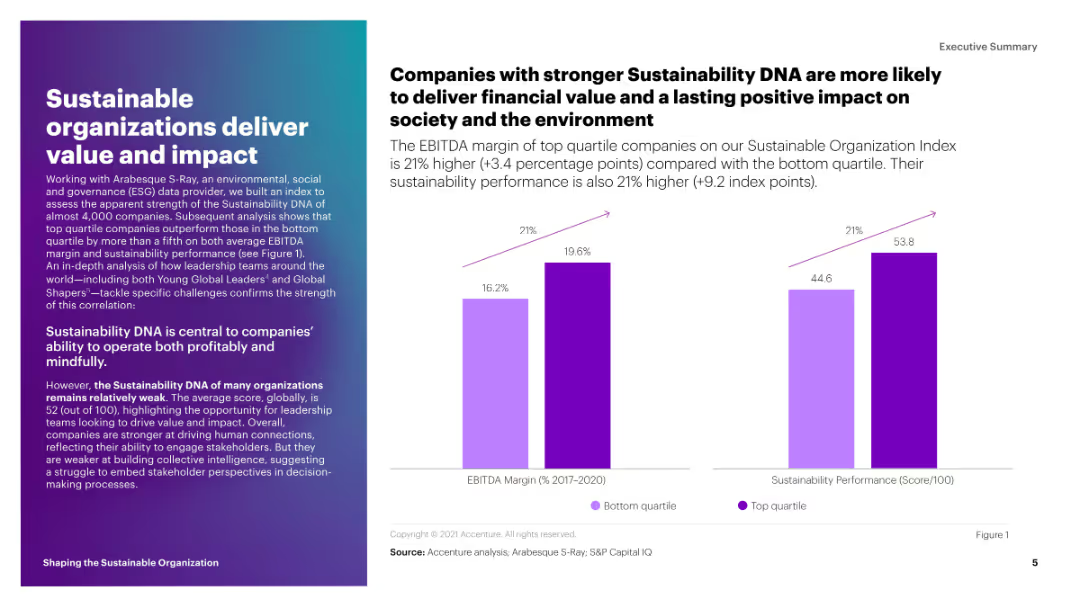
This slide includes a column chart comparing the EBITDA margin and sustainability performance score of top quartile companies to those in the bottom quartile. The bars are in shades of purple.
Strategic Planning
Environmental Services & Sustainability
The slide shows that companies with stronger sustainability DNA have higher EBITDA margins and sustainability performance scores. It emphasizes the financial and societal benefits of sustainability.
sustainability, EBITDA, performance, impact, top quartile
Mixed Chart
Accenture
Saved
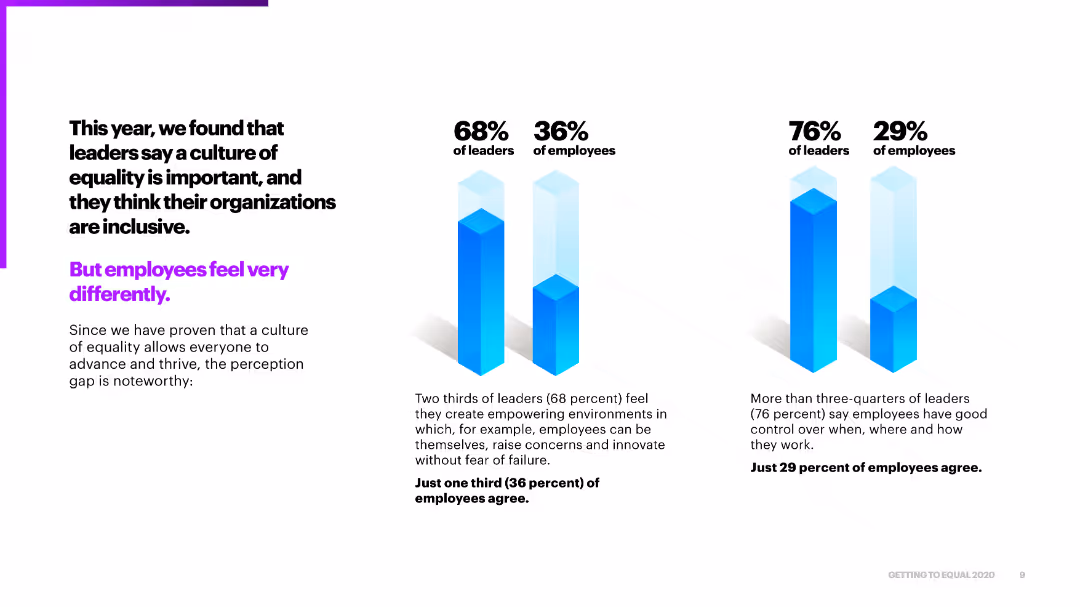
This slide features a column chart comparing the perceptions of leaders and employees on the importance of a culture of equality within organizations. The design uses blue and purple colors for emphasis.
Market Analysis and Trends
Professional Services
The slide highlights the disparity between leaders' and employees' perceptions of organizational equality, showing that a higher percentage of leaders believe in inclusive environments compared to employees.
equality, perceptions, leaders, employees, organizational culture
Multiple Chart
Accenture
Saved
Features column chart with blue and grey colors illustrating derivatives and financial impacts. Clear layout with key points.
Risk Assessment and Management
Financial Services
Evaluates the impacts of netting and collateral on derivatives for risk reduction in financial reporting.
Derivatives, IFRS, financial risk, collateral, netting, financial reporting, asset management
Mixed Chart
Deutsche Bank
Saved
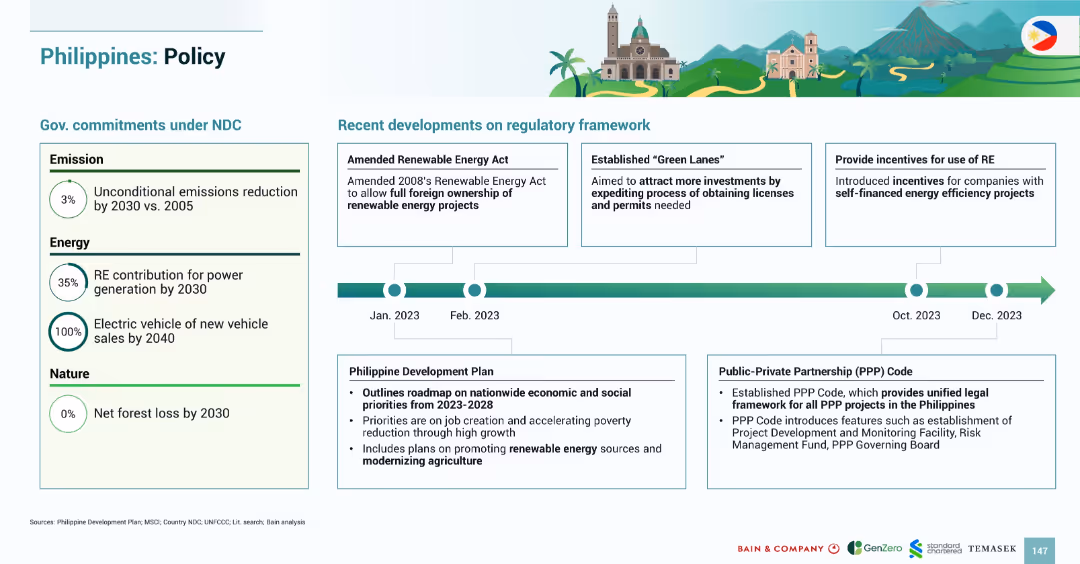
Clean bifurcated layout with left-side policy targets and right-side timeline from Jan–Dec 2023 highlighting legislative and regulatory actions.
Regulatory and Compliance
Government & Public Sector
The slide details the Philippines’ NDC targets (3% emissions cut, 35% RE by 2030) and regulatory progress in 2023. It includes full foreign RE ownership, “Green Lanes” for permit ease, and incentives for energy efficiency. The development plan emphasizes RE growth and agricultural modernization.
Philippines, policy, regulation, RE ownership, incentives, Green Lanes, development plan
Mixed Chart
Bain
Saved
The slide includes text and an infographic explaining the different scopes of GHG emissions (direct, indirect, and other indirect), and their impact on corporate GHG emissions disclosure.
Regulatory and Compliance
Government & Public Sector
The slide discusses the development of corporate GHG emissions disclosure covering scopes 1, 2, and 3. It includes an infographic detailing the types of emissions, their definitions, and examples, emphasizing the increasing pressure on corporations to reduce GHG emissions.
GHG emissions, disclosure, scopes, corporate
Diagram
Kearney
Saved
The slide includes a combination of column charts, bar charts, and pie charts to display survey data. The charts categorize respondents by country, type of hospital, hospital size, and respondent role.
Market Analysis and Trends
Healthcare & Pharmaceuticals
This slide presents survey data on hospital priorities in APAC, categorizing responses by country, hospital type, size, and roles. It provides insights into the current focus areas for hospital executives.
healthcare, survey, priorities, APAC, hospitals
Single Chart
LEK
Saved
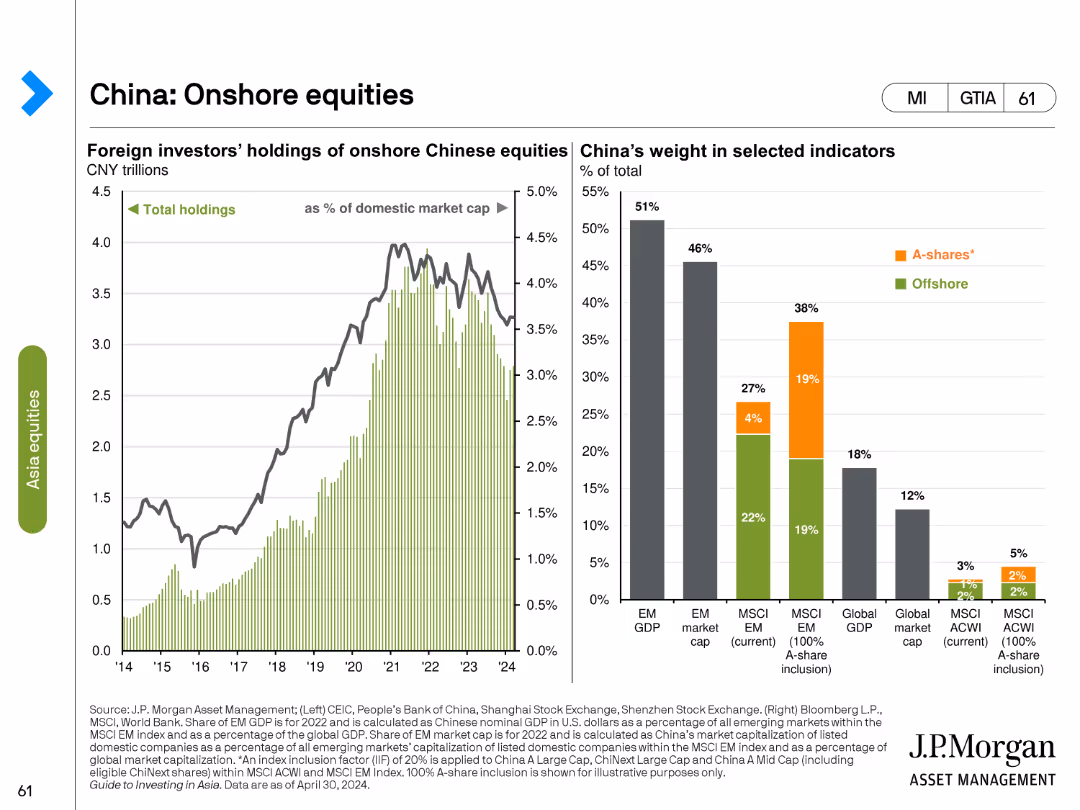
This slide has two charts: a line chart showing foreign investors' holdings of onshore Chinese equities, and a bar chart showing China’s weight in selected indicators such as EM GDP, EM market cap, and MSCI EM.
Market Analysis and Trends
Financial Services
The slide examines foreign investment in onshore Chinese equities, comparing total holdings and China's weight in various global market indicators, providing insight into the role of China in the global financial market.
China, onshore equities, foreign investment, EM GDP, EM market cap, MSCI EM, financial market, global indicators, weight, investment analysis
Multiple Chart
JP Morgan
Saved
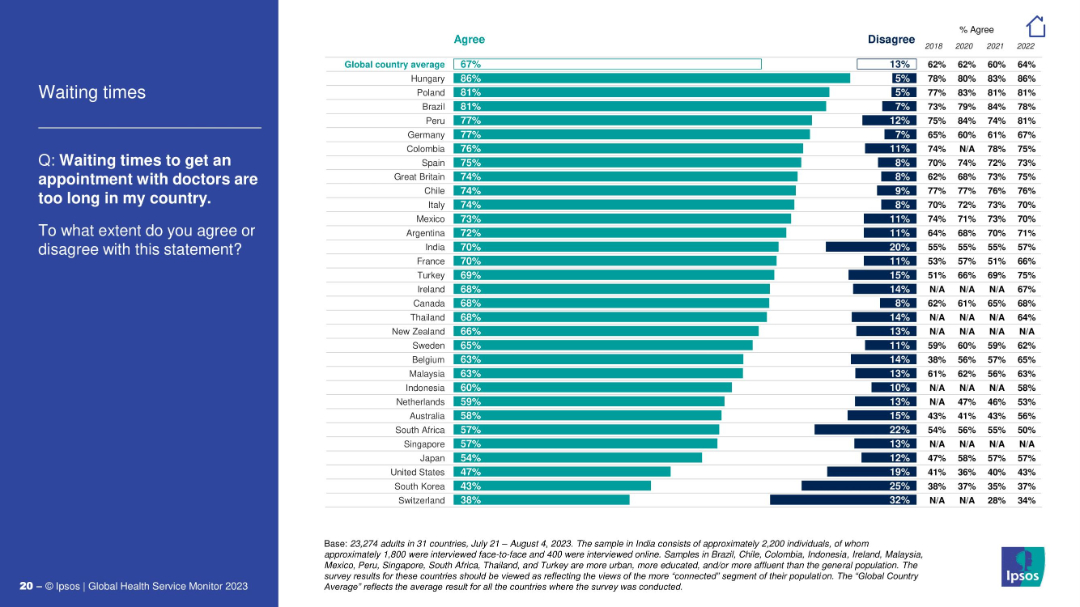
Bar chart comparing countries’ agreement with the statement that doctor wait times are too long.
Operational Efficiency
Healthcare & Pharmaceuticals
The slide ranks countries by how many respondents agree that wait times for doctor appointments are too long. Hungary, Poland, and Brazil show the highest agreement. It gives insight into healthcare accessibility and public dissatisfaction.
waiting times, appointment delays, healthcare access, survey results, Ipsos, patient experience, bottlenecks
Mixed Chart
IPSOS
Saved
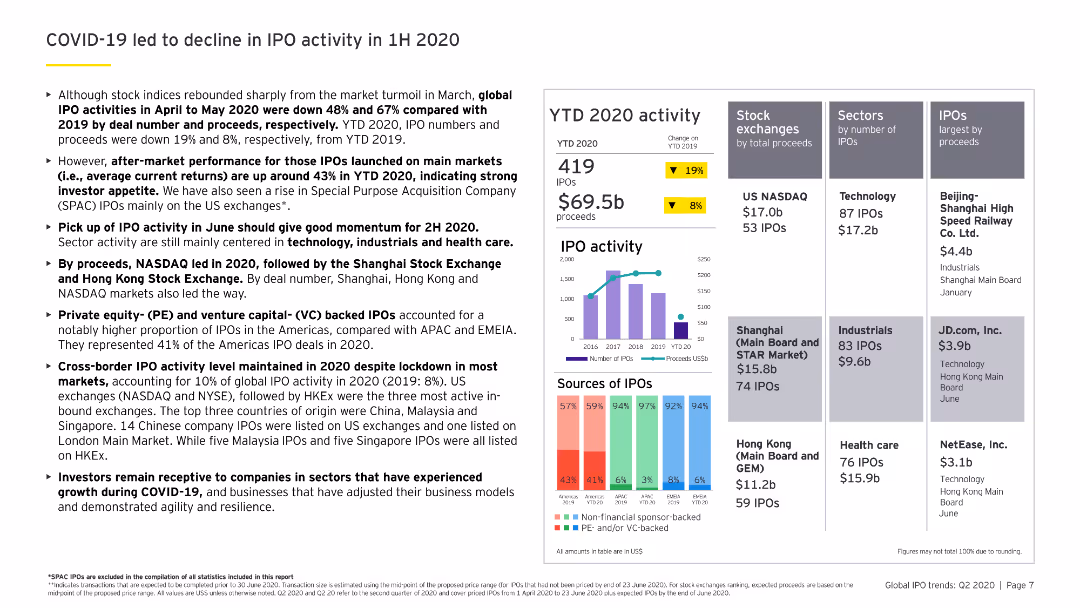
The slide includes various column charts and a bar chart illustrating IPO activities, sources of IPOs, and sectors affected in YTD 2020 compared to YTD 2019.
Risk Assessment and Management
Financial Services
Analyzes the impact of COVID-19 on global IPO activities in the first half of 2020, highlighting the decline in the number of IPOs and proceeds, and identifying key sectors.
COVID-19, IPO decline, 1H 2020, sector impact, financial performance
Multiple Chart
EY
Saved
Text-dominant layout with a column chart showing international revenue growth in blue bars and grey projection bar.
Financial Performance
Financial Services
Highlights JPMorgan Chase & Co.'s approach to serving multinational clients, with a focus on international expansion and the firm's revenue growth from it.
Global, Expertise, Revenue Growth, Multinational, Clients
Mixed Chart
JP Morgan
Saved
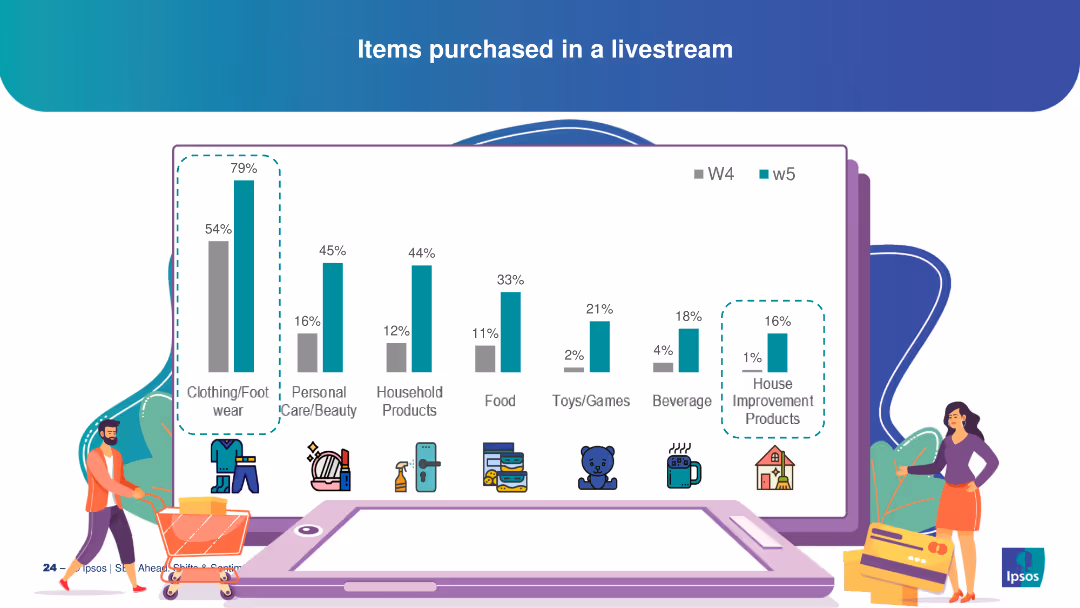
This slide features multiple vertical bar charts showing different categories of items purchased through livestreams. Each category is represented with icons and distinct colors, providing a clear visual comparison.
Market Analysis and Trends
Retail & E-commerce
The slide details various items purchased via livestreams, with clothing/footwear being the most popular at 79%, followed by personal care/beauty, household products, and others. It provides insight into consumer preferences and behavior in the livestream shopping context.
consumer behavior, livestream shopping, purchase categories, retail trends, e-commerce
Single Chart
IPSOS
Saved
This column chart has a blue color scheme with contrasting green and red markers indicating increases and decreases in ROE from 2018 to 2019. Two large vertical columns represent ROE percentages for each year, with smaller markers above and below the main columns represent contributing factors to the ROE change.
Financial Performance
Financial Services
The slide is titled "ROE decreased from 15.9% in 2018 to 14.0% in 2019, primarily driven by capital." It visualizes ROE change and contributing factors such as revenue, rates, expenses, and credit costs. Each factor's impact is quantified with percentages.
ROE, financial, capital, revenue, rates, expenses, credit cost, decrease, JPMorgan Chase & Co.
Single Chart
JP Morgan
Saved
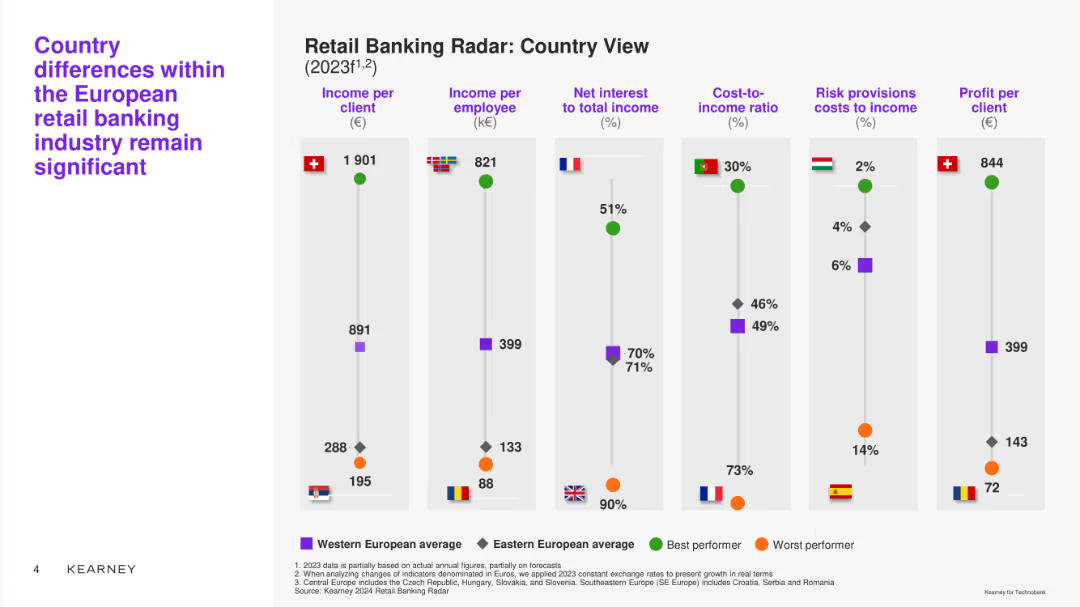
Column chart comparing different metrics (income per client, income per employee, etc.) across various European countries. Uses color-coded markers for Western and Eastern Europe.
Market Analysis and Trends
Financial Services
Analyzes significant country differences in the European retail banking industry, comparing key financial indicators across countries.
country view, income, comparison, Europe, retail banks
Single Chart
Kearney
Saved
A column chart shows liquidity coverage ratio trends alongside bullet points detailing liquidity risk management strategies, presented on a white and blue slide.
Risk Assessment and Management
Financial Services
The slide describes liquidity risk management strategies and trends in liquidity coverage ratios, underlining the company's robust position and regulatory compliance. It's meant to communicate a strong and adaptable approach to liquidity risk.
liquidity risk, management, trends, compliance
Mixed Chart
Goldman Sachs
Saved
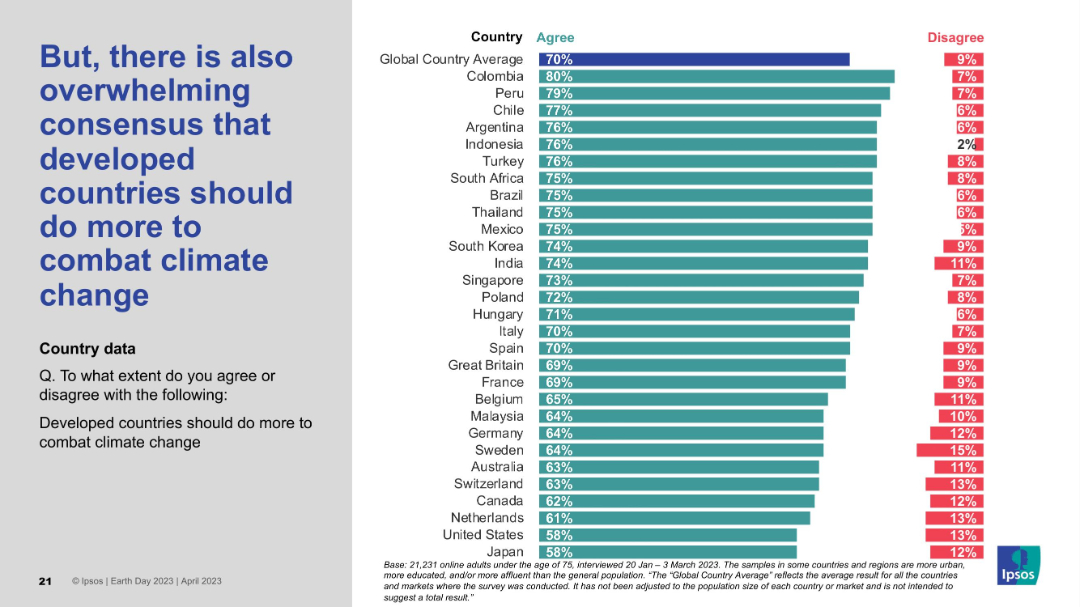
Left-side statement in bold blue; right side is a ranked horizontal bar chart by country with percentage agreement and disagreement.
Strategic Planning
Environmental Services & Sustainability
This slide highlights a strong international consensus that developed countries should take more proactive steps to address climate change. Most countries reflect agreement levels well above the global average, underscoring expectations for greater developed-world leadership.
climate action, developed nations, responsibility, global consensus, policy pressure, survey data, Earth Day 2023
Mixed Chart
IPSOS
Saved
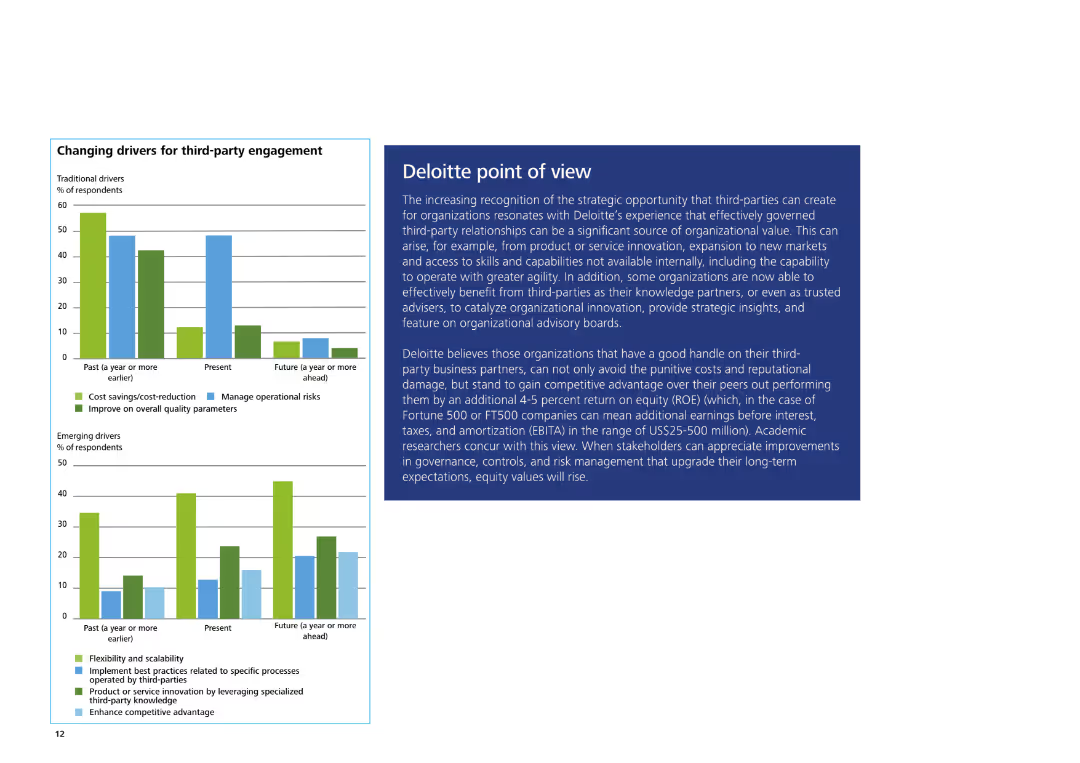
The slide features a column chart on the left showing traditional and emerging drivers for third-party engagement. On the right, there is a text box with Deloitte's POV.
Strategic Planning
Professional Services
The slide explains Deloitte's view on the strategic opportunities of third-party engagement, highlighting benefits, competitive advantage, and key organizational insights.
Third-party engagement, Deloitte, strategic opportunities, competitive advantage, organizational insights
Multiple Chart
Deloitte
Saved
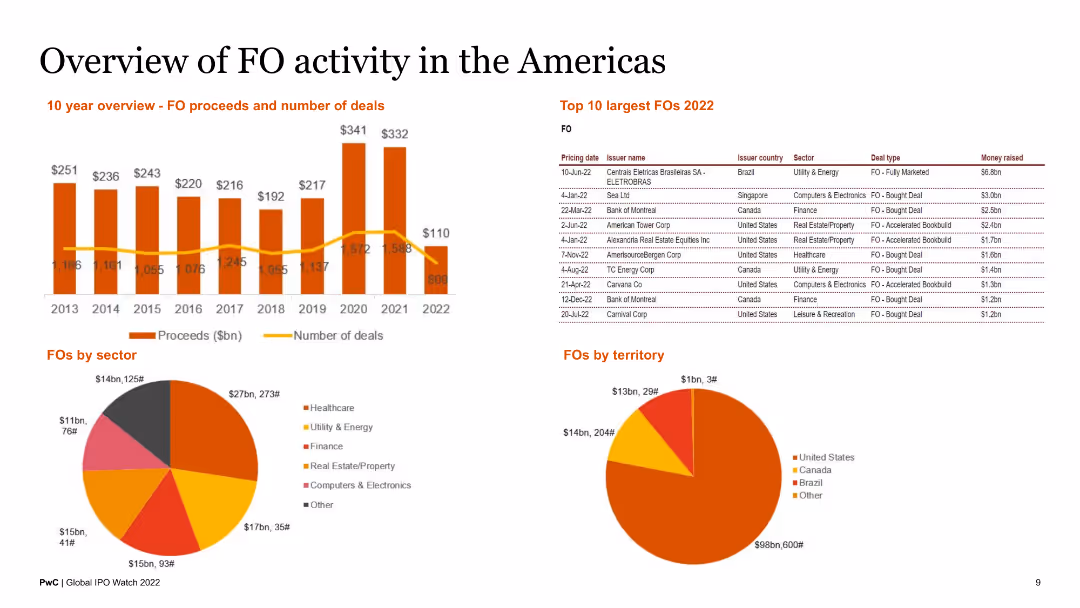
The slide features a 10-year overview of FO proceeds and number of deals, a table of top 10 largest FOs in 2022, and pie charts of FOs by sector and territory. It is visually dense, with detailed data and brief text summaries.
Market Analysis and Trends
Financial Services
This slide reviews FO activities in the Americas, presenting historical data, largest deals, and sectoral and territorial distributions. It is targeted at financial analysts and investors.
FO activity, Americas, top FOs, sector analysis, territorial overview
Multiple Chart
PwC/Strategy&
Saved
Previous
Next
If nothing, comes up, please save your slides first
Create a FREE account to continue browsing
Receive Instant Access to 1,000+ slides from companies like McKinsey, Google, and Goldman Sachs
First Name
Last Name
Email
Password
I agree to all
Terms & Privacy Policy
Thank you! Your submission has been received!
Oops! Something went wrong while submitting the form.
Have an account?
Sign in
Column Chart
Heatmap
Chevron
Org Chart
Infographic
Callouts
Timeline
List
Graphic
Picture
Process Flow
Diagram
Paragraph
Map
Table
Framework
Subtitle
Takeaway Box
Icon
Other Chart
Radar Chart
Waterfall Chart
Mekko Chart
Pie Chart
Scatter Plot
Line Chart
Bar chart
Bullet points