My Account
My Slides
Search by Category
Templates
Leave Feedback
Login
Logout
Get Started
Browse all Slides
Browse all Slides
Create a FREE Account
Instant access to 1,000+ real slides from top companies like McKinsey, BCG, Goldman Sachs, Google and many more!
First Name
Last Name
Email
Password
I agree to all
Terms & Privacy Policy
Thank you! Your submission has been received!
Oops! Something went wrong while submitting the form.
Have an account?
Sign in
Saved Slides
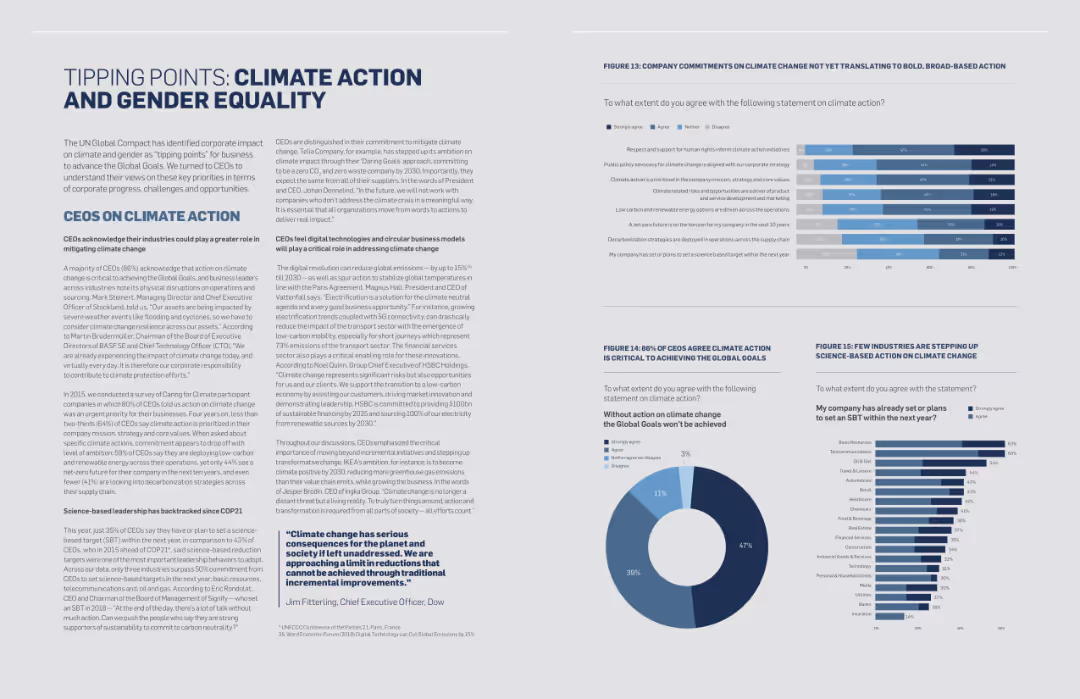
The slide contains text and several column charts depicting survey data on climate action and gender equality. Quotes from CEOs are also included.
Regulatory and Compliance
Environmental Services & Sustainability
The slide addresses the critical points of climate action and gender equality, presenting survey data and CEO quotes to highlight the importance of these issues for sustainable development.
Climate Action, Gender Equality, Sustainability, Survey Data, CEO Quotes, Regulatory Compliance
Multiple Chart
Accenture
Saved
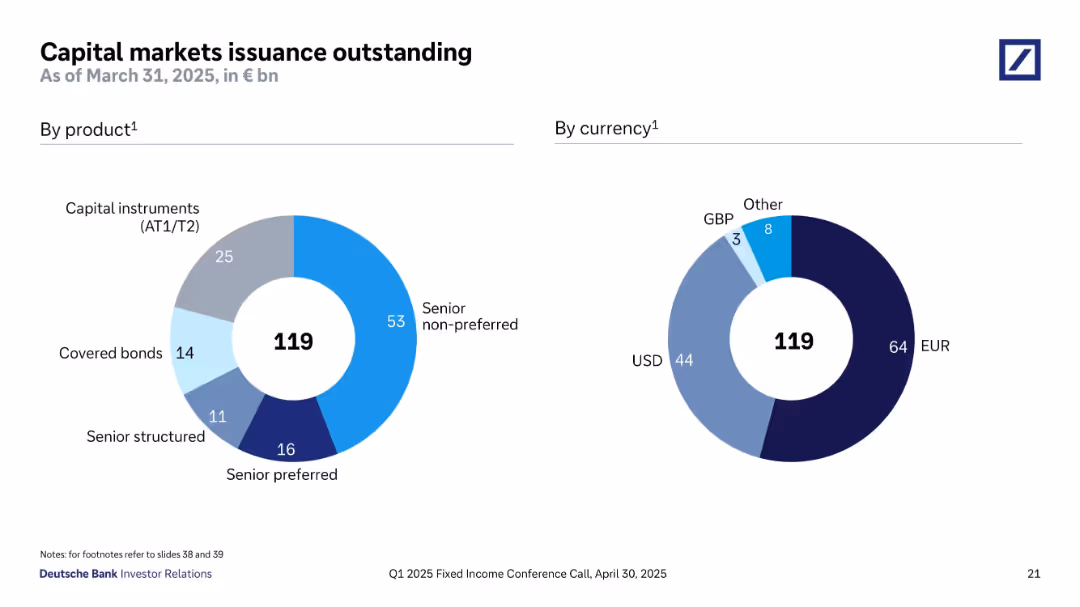
Two donut charts show capital markets issuance outstanding (€119bn) by product type (AT1/T2, senior non-preferred, etc.) and by currency (EUR, USD, others). Clear color coding distinguishes categories.
Financial Performance
Financial Services
This slide breaks down Deutsche Bank’s outstanding capital market issuances totaling €119bn by both product and currency. Senior non-preferred debt is the largest component (€53bn), followed by capital instruments. Issuance is diversified by currency, with 64bn in EUR and 44bn in USD. The visual reinforces the bank's diversified funding structure and balance between instrument types and currency exposures.
capital markets, bond issuance, senior non-preferred, AT1, EUR, USD, covered bonds, diversification
Single Chart
Deutsche Bank
Saved
The slide includes a pie chart detailing a breakdown by property type and a line chart showing the net charge-off rate over time, comparing commercial banking to peer average. It also features text sections with bullet points.
Risk Assessment and Management
Financial Services
Analysis of credit risk management, with focus on performance, asset class strength, and exposure.
Risk, credit, performance, exposure, CRE, asset, lending, quality, portfolio, discipline
Multiple Chart
JP Morgan
Saved
A donut chart dominates the slide, showcasing the distribution of a firm's investment platform across various asset classes, complemented by performance metrics on the right.
Investment Analysis
Financial Services
The slide indicates a financial firm’s asset and wealth management capabilities, detailing the distribution of firmwide investments and their performance over five years. Suitable for demonstrating the firm's diversified asset management and strong performance history.
asset management, investment, performance, diversification, growth
Mixed Chart
Goldman Sachs
Saved
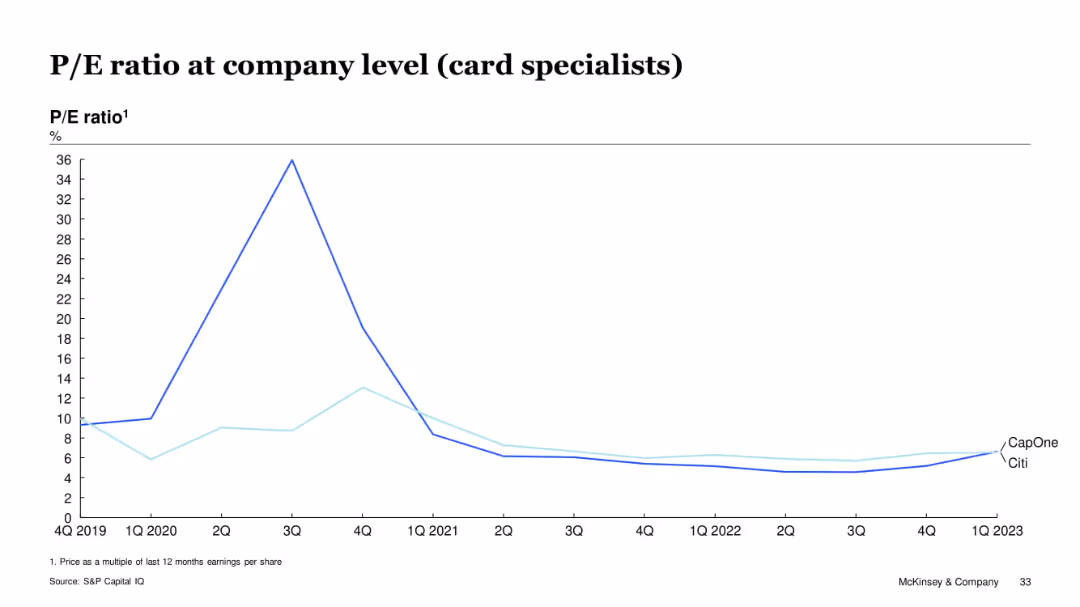
Line graph showing P/E ratio trends for CapOne and Citi from Q4 2019 to Q1 2023
Investment Analysis
Financial Services
This slide focuses on P/E ratio trends for Capital One and Citibank, both considered card specialists. After a peak in mid-2020, their P/E ratios declined and remained stable below 10x through 2023. The data reflects muted investor sentiment and earnings performance in the segment.
P/E, card specialists, Citi, Capital One, investor sentiment, valuation trends
Single Chart
McKinsey
Saved
Features column charts comparing revenue, expenses, and deficits over three fiscal years. The columns are color-coded in pink, gray, and red, respectively.
Regulatory and Compliance
Government & Public Sector
Analyzes the financial figures from past, present, and projected budgets, detailing revenue, expenses, and deficits to assess financial health and planning. This visual helps in understanding the budgetary trends and economic strategies moving forward.
Budget, Revenue, Expenses, Deficit, Fiscal analysis
Single Chart
PwC/Strategy&
Saved
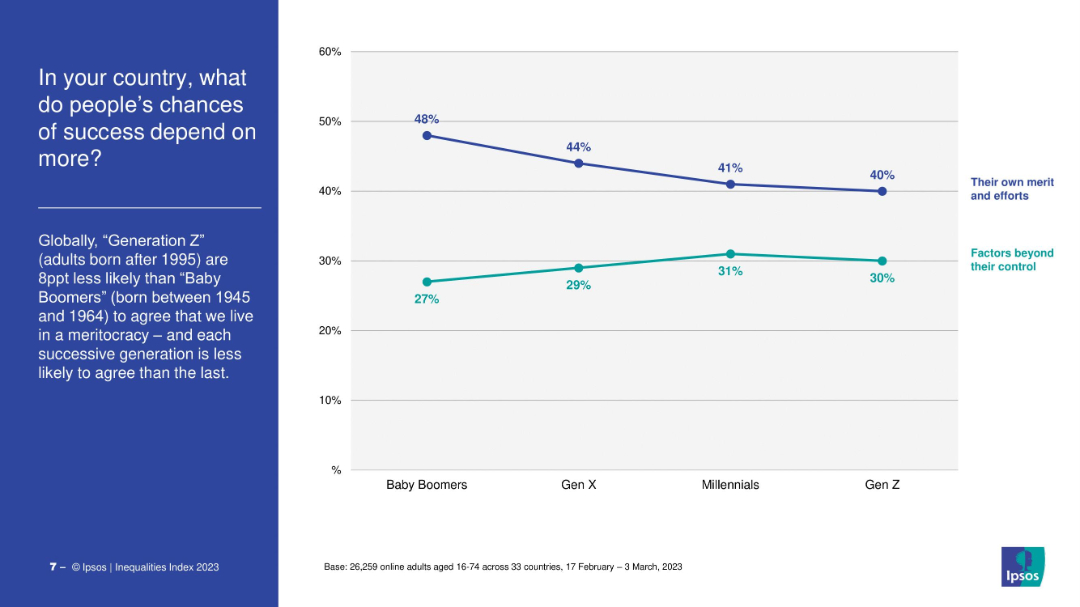
Dual-line chart comparing “merit/effort” vs. “factors beyond control” across generations. Title and text on the left.
Market Analysis and Trends
Government & Public Sector
The slide compares generational views on what influences success, revealing a decline in belief in meritocracy from Baby Boomers to Gen Z, who increasingly cite uncontrollable factors as more influential.
meritocracy, social mobility, Gen Z, inequality, generational comparison
Mixed Chart
IPSOS
Saved
A column chart with percentages representing the impact of skill availability on organizational growth, accompanied by a significant quote on talent management.
Human Resources and Talent Management
Financial Services
This slide discusses the impact of skill gaps on innovation and costs, pertinent in HR presentations and discussions about talent management and organizational growth challenges.
Skills Gap, Innovation, Talent Management, Organizational Growth, HR, Costs, Impact
Mixed Chart
PwC/Strategy&
Saved
The slide presents a segmented bar chart with text explanations on inflation impact responses and various cost increase management strategies.
Risk Assessment and Management
Consumer Goods
It explains how food & beverage companies manage inflation-driven cost increases through margin reduction, passing costs to customers, and other strategies.
Inflation, cost management, food & beverage, margin reduction, passing costs, supplier interventions, hedging, demand management
Mixed Chart
Kearney
Saved
The slide contains a line chart on the left showing private real estate returns and real GDP growth from 4Q78 to 1Q24. The right side features a column chart comparing private real estate returns in different inflationary regimes.
Market Analysis and Trends
Real Estate & Construction
The slide compares the returns of private real estate against real GDP growth over time, and shows the performance of real estate in various inflationary environments. It's useful for analyzing historical trends and the impact of inflation on real estate returns.
GDP, real estate, inflation, returns, historical trends, analysis, market performance
Multiple Chart
JP Morgan
Saved
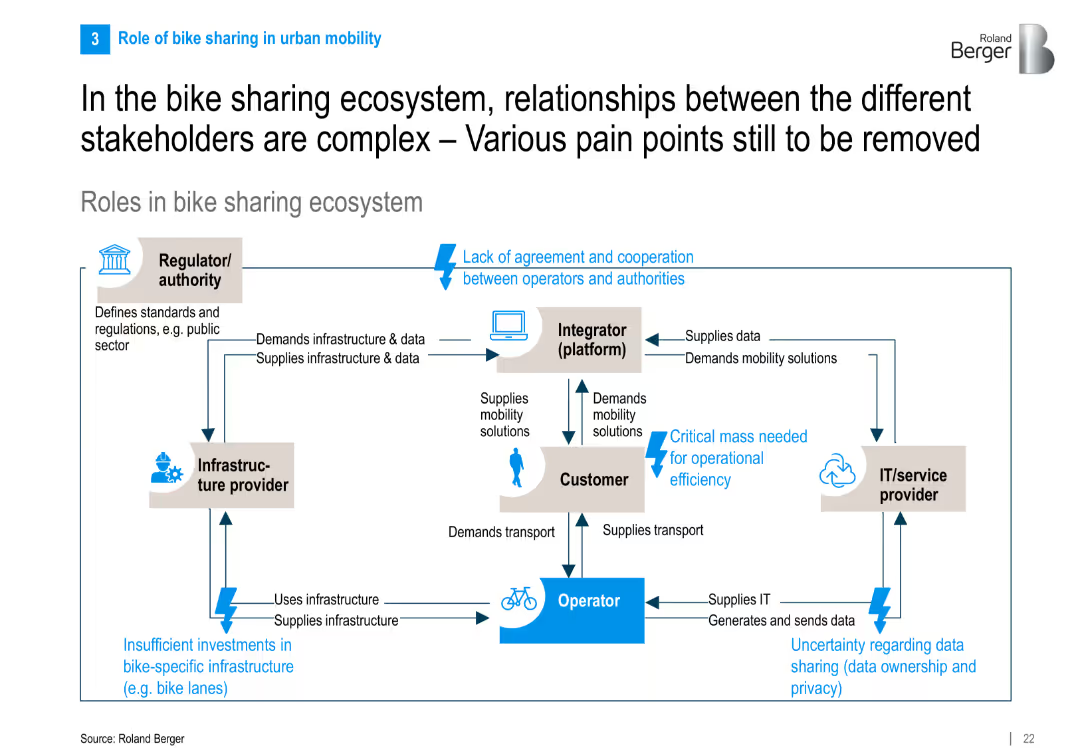
Flowchart-style diagram showing stakeholder interactions in the ecosystem with directional arrows, text boxes, and pain points highlighted in blue.
Operational Efficiency
Transportation & Logistics
The slide maps out interactions among key stakeholders in bike sharing—operators, customers, regulators, integrators, and IT providers—highlighting collaboration pain points like regulation, infrastructure, and data issues.
bike sharing, ecosystem, stakeholder roles, pain points, infrastructure, IT providers, mobility
Diagram
Roland Berger
Saved
List of additional resources and readings related to advanced connectivity, providing further knowledge exploration.
Technology and Digital Transformation
Professional Services
Provides a curated list of resources for deeper understanding of connectivity trends and their implications.
Resources, Connectivity, 5G, IoT, Digital Transformation, Knowledge Center
Uncategorized
McKinsey
Saved
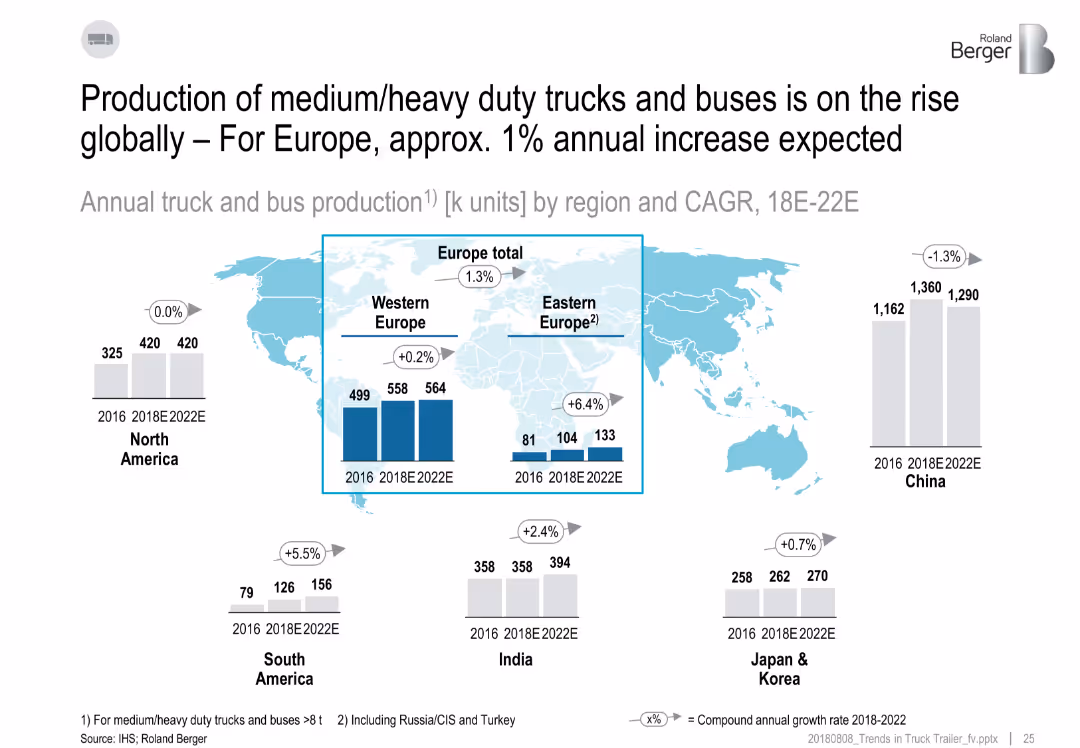
World map with bar charts over regions, CAGR labels, and production figures from 2016 to 2022E.
Market Analysis and Trends
Industrial & Manufacturing
The slide analyzes global truck and bus production trends, showing a modest increase in Europe and strong growth in Eastern Europe and South America. China shows a decline. CAGR from 2018–2022E is highlighted by region.
production, CAGR, Europe, global truck market, regional growth
Multiple Chart
Roland Berger
Saved
The slide features a horizontal bar chart showing the change in agreement with the statement on global brands from 2021 to 2022 in various countries.
Market Analysis and Trends
Technology & Software
The slide highlights an increase in the preference for global brands over the past year across different markets.
Global brands, market preference, survey, public opinion, brand analysis
Mixed Chart
IPSOS
Saved
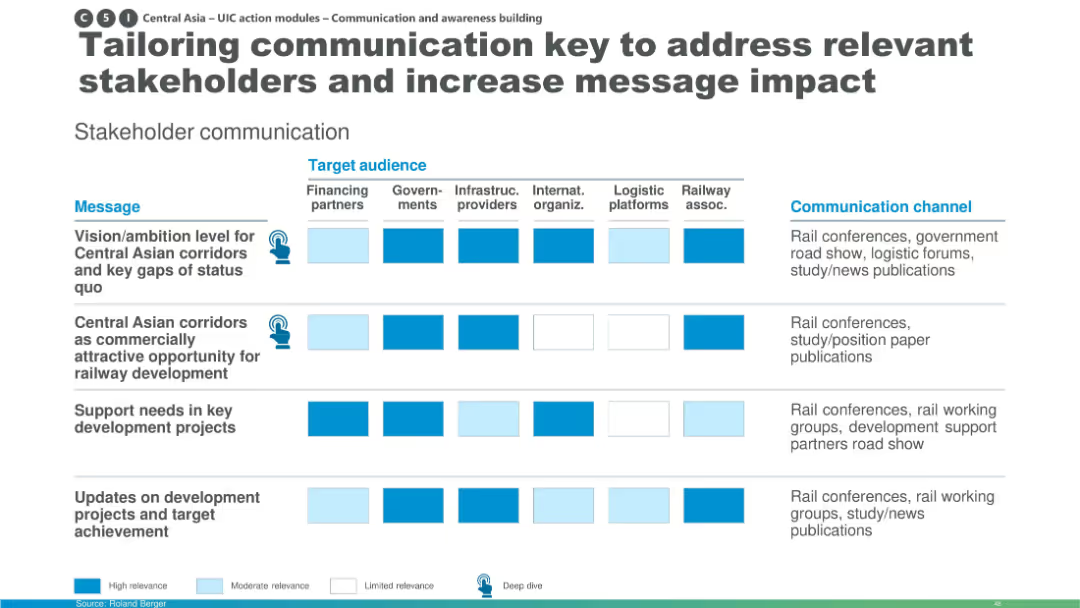
Matrix slide with rows of messages and columns of target audiences; uses color-coded relevance indicators (high, moderate, limited) and includes icons and communication channels.
Strategic Planning
Transportation & Logistics
This slide shows how communication strategies for Central Asian rail corridor development should be tailored to various stakeholders like financing partners, governments, infrastructure providers, and logistics platforms. It uses a matrix to visualize message relevance and preferred communication channels.
stakeholder communication, Central Asia, railway development, message relevance, logistics, infrastructure, communication strategy, rail corridors, target audience
Table
Roland Berger
Saved
The slide features two visual elements. The first is a multi-line graph showing occupancy by country over several years, with different lines representing different countries. The second is a horizontal bar chart showing portfolio weighting by country. The line graph and bar chart are color-coded to differentiate the countries and show occupancy trends over time, with annotations for specific data points.
Market Analysis and Trends
Real Estate & Construction
Demonstrates the steady performance of the company's core markets, represented by consistent occupancy rates and portfolio distribution by country.
Market Performance, Core Markets, Real Estate Occupancy, Country Analysis, Portfolio Weighting, Trend Analysis
Multiple Chart
Morgan Stanley
Saved
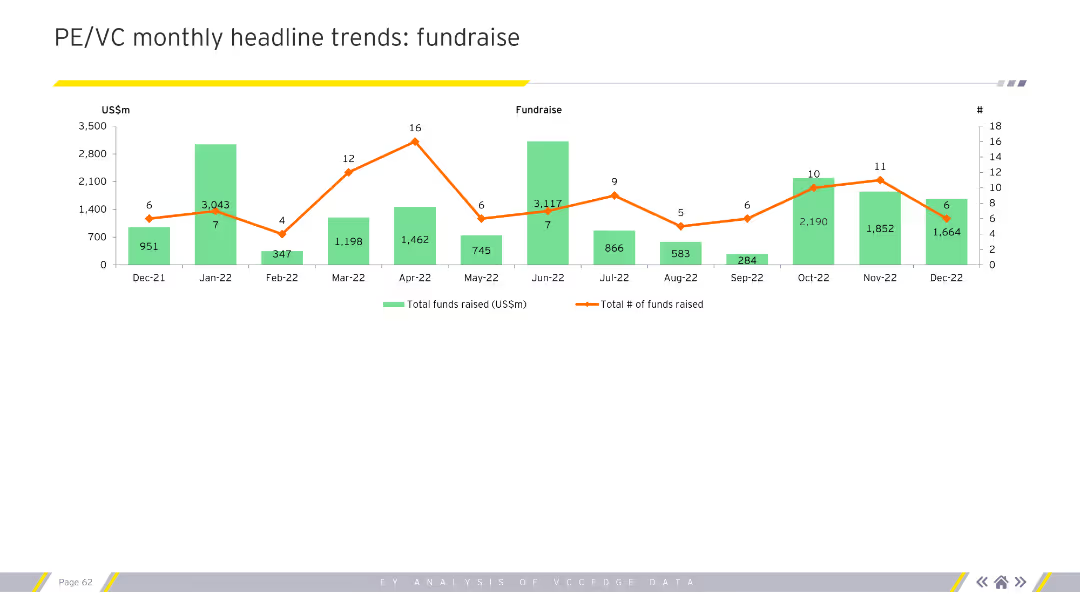
The slide includes a column chart tracking monthly headline trends for fundraising by total funds raised and number of funds raised.
Market Analysis and Trends
Financial Services
This slide tracks PE/VC fundraising trends over several months, highlighting total funds raised and the number of funds.
PE, VC, fundraising, monthly trends, total funds, number of funds
Single Chart
EY
Saved
This slide shows a line chart depicting the US Markit manufacturing PMI supplier delivery times from 2007 to 2021. The chart displays a trend where higher index values signify faster deliveries. There are fluctuations, with a notable increase in delivery times, indicated by a downward trend towards the end of the timeline.
Operational Efficiency
Technology & Software
The slide presents trends in supplier delivery times as a measure of supply side constraints, especially relevant for manufacturing and logistics industries. It's useful for analyzing supply chain efficiency and the effects of external factors like economic policies or global events on delivery performance.
Supply Chain, Manufacturing PMI, Delivery Times, US, Market Trends, Supplier Constraints, Logistics
Single Chart
JP Morgan
Saved
The slide includes a set of column chart comparing the percentage of workers needing to switch occupations by 2030 across five countries: Japan, Australia, United States, Germany, and New Zealand. Each country's bar is divided into segments for additional shifts due to different adoption scenarios.
Human Resources and Talent Management
Industrial & Manufacturing
This slide provides an international perspective on the workforce shifts necessary under an early automation adoption scenario. It quantifies the proportion of the workforce that might need to transition to different occupations, serving as a basis for discussions on global labor market resilience and the need for comprehensive retraining programs.
workforce, automation, global, transition, occupations
Single Chart
McKinsey
Saved
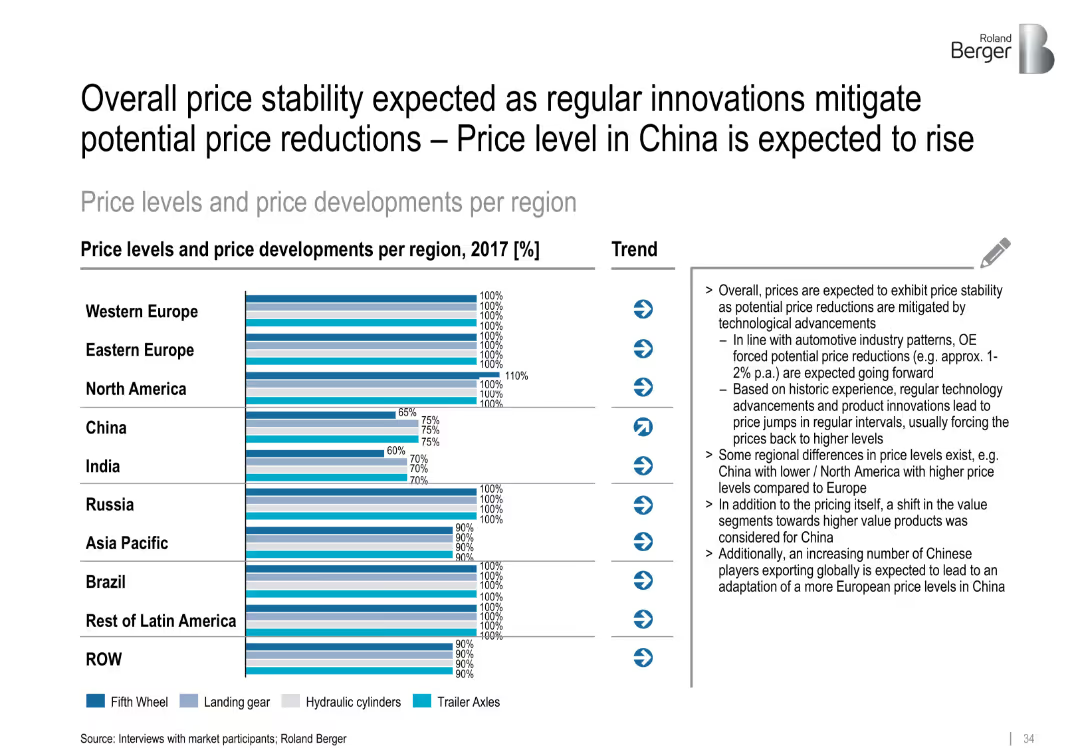
Horizontal bar chart with four component types per region; trend arrows and right-aligned detailed notes
Pricing Strategies
Transportation & Logistics
The slide highlights regional price levels and developments for trailer components in 2017. Western markets show uniform 100% pricing, while developing markets show lower relative price levels. Innovations are expected to stabilize prices, especially in China.
price stability, trailer components, China, pricing forecast, innovation impact, global regions, trailer axles, fifth wheel
Mixed Chart
Roland Berger
Saved
The slide uses a color scheme with gray and purple, featuring a centralized graphic representing China’s technology goals and four numbered segments with icons and brief descriptions around it. It contains moderate text and data visualizations like charts or graphs are not present.
Industry Overview
Technology & Software
This slide presents China's strategic focus in technology as outlined in their 14th Five-Year Plan, highlighting key imperatives to become a global digital powerhouse within the next five years. It breaks down the plan into four main objectives such as investment in digital infrastructure and enhancing education quality, aimed at fostering international collaboration and maintaining a policy of openness.
China, Technology, Five-Year Plan, Digital Powerhouse, Infrastructure, Education, Collaboration, Policy, Global Leader, Investment
Single Chart
Kearney
Saved
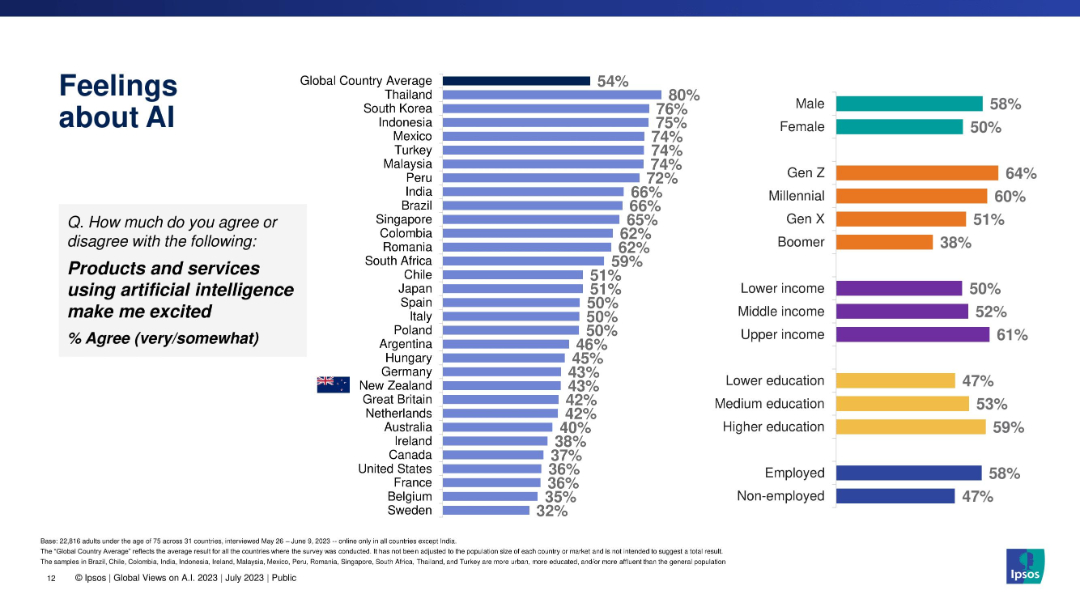
Similar dual-column bar chart layout as previous slide, illustrating excitement about AI by country/group.
Market Analysis and Trends
Artificial Intelligence
This slide evaluates how excited people are about AI-powered products/services across various countries and demographic groups, highlighting enthusiasm levels globally.
excitement, AI products, public sentiment, country comparison, demographics, Ipsos, emotional response
Multiple Chart
IPSOS
Saved
The slide is packed with visual elements like icons and small images, descriptions, and various colors to differentiate the tools. It’s well-organized despite the high information density, making use of grids and alignment to maintain clarity.
Technology and Digital Transformation
Professional Services
Introduces THRIVE, a platform with tools for cost management and digital transformation, aimed at improving operational efficiency. The slide outlines each tool’s features and intended use, enhancing understanding of how digital tools can drive business improvements.
THRIVE, digital transformation, cost management, operational efficiency, tools
Pillar
Deloitte
Saved
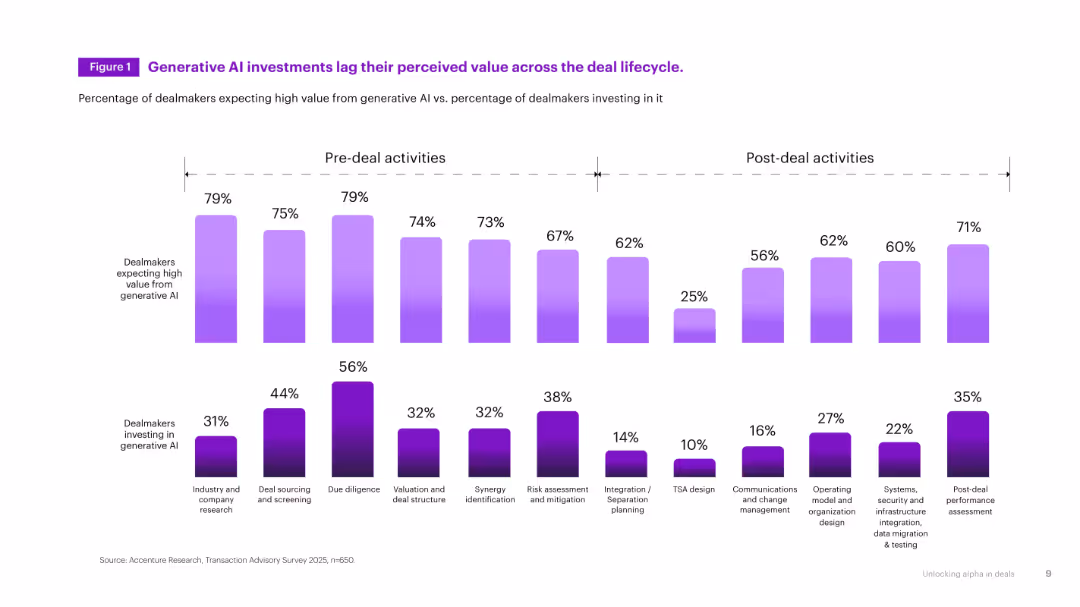
Dual-bar chart with vertical bars split between pre-deal and post-deal activities. Two rows of bars compare "expecting value" vs. "investing in AI." Purple gradient.
Technology and Digital Transformation
Artificial Intelligence
Highlights a significant gap between where dealmakers expect value from generative AI and where they are actually investing in it across the M&A lifecycle. Emphasizes pre- and post-deal stages.
generative AI, M&A, investment gap, pre-deal, post-deal, value, survey
Single Chart
Accenture
Saved
Column chart showing asset classes considered for tokenization, alongside a circular diagram detailing motivations for tokenizing assets. Highlights the interest in public funds, private funds, and real estate.
Market Analysis and Trends
Financial Services
Examines the interest in tokenizing various asset classes among institutions, with motivations including increased liquidity, operational efficiencies, and access to new investors and capital.
tokenization, asset classes, institutions, motivations, liquidity
Mixed Chart
EY
Saved
Previous
Next
If nothing, comes up, please save your slides first
Create a FREE account to continue browsing
Receive Instant Access to 1,000+ slides from companies like McKinsey, Google, and Goldman Sachs
First Name
Last Name
Email
Password
I agree to all
Terms & Privacy Policy
Thank you! Your submission has been received!
Oops! Something went wrong while submitting the form.
Have an account?
Sign in
Column Chart
Heatmap
Chevron
Org Chart
Infographic
Callouts
Timeline
List
Graphic
Picture
Process Flow
Diagram
Paragraph
Map
Table
Framework
Subtitle
Takeaway Box
Icon
Other Chart
Radar Chart
Waterfall Chart
Mekko Chart
Pie Chart
Scatter Plot
Line Chart
Bar chart
Bullet points