My Account
My Slides
Search by Category
Templates
Leave Feedback
Login
Logout
Get Started
Browse all Slides
Browse all Slides
Create a FREE Account
Instant access to 1,000+ real slides from top companies like McKinsey, BCG, Goldman Sachs, Google and many more!
First Name
Last Name
Email
Password
I agree to all
Terms & Privacy Policy
Thank you! Your submission has been received!
Oops! Something went wrong while submitting the form.
Have an account?
Sign in
Saved Slides
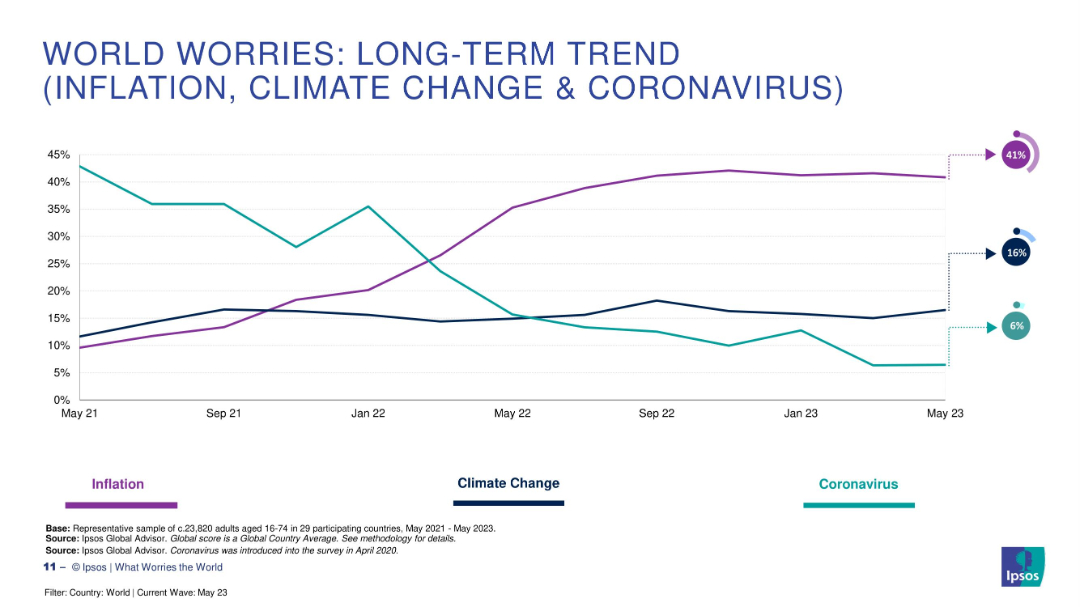
Focused line graph comparing inflation, climate change, and coronavirus trends since May 2021
Market Analysis and Trends
Environmental Services & Sustainability
This slide narrows in on three specific concerns—Inflation, Climate Change, and Coronavirus—highlighting how public anxiety over these issues has shifted in the past two years. Inflation surged while COVID-19 concern dropped sharply. Climate change worry remains relatively stable.
inflation, climate change, coronavirus, trends, opinions
Multiple Chart
IPSOS
Saved
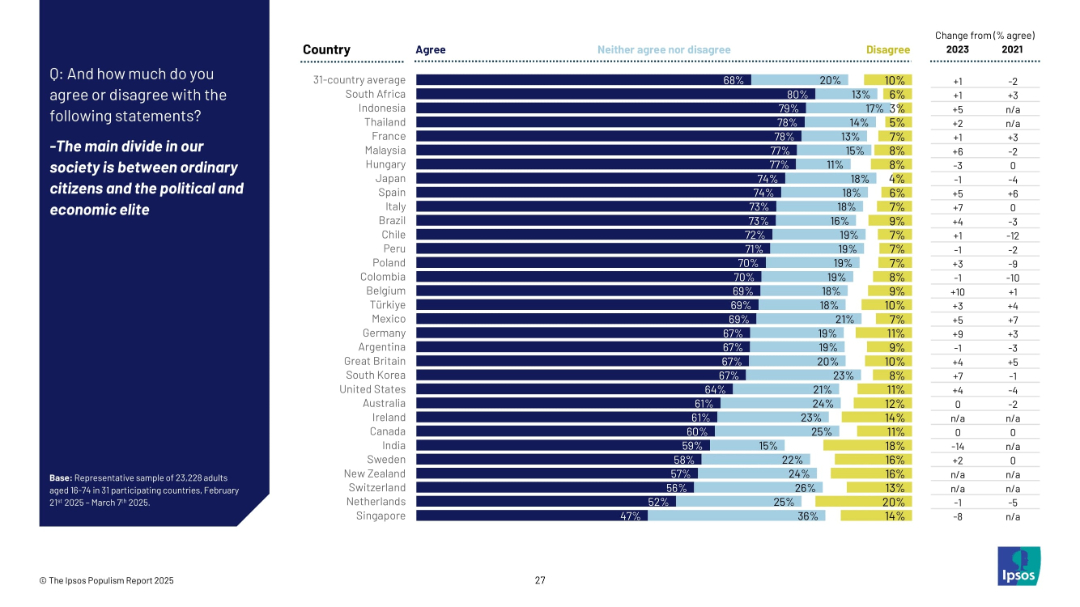
Left title box; right side contains a horizontal bar chart with countries sorted by agreement levels and change percentages over time.
Market Analysis and Trends
Government & Public Sector
The chart illustrates agreement with the idea that the primary societal divide is between ordinary people and elites. South Africa, Indonesia, and Thailand top the list, while Japan also shows high agreement at 74%.
elite, divide, society, perception, inequality, global sentiment, Ipsos, populism, ordinary citizens, 2025
Mixed Chart
IPSOS
Saved
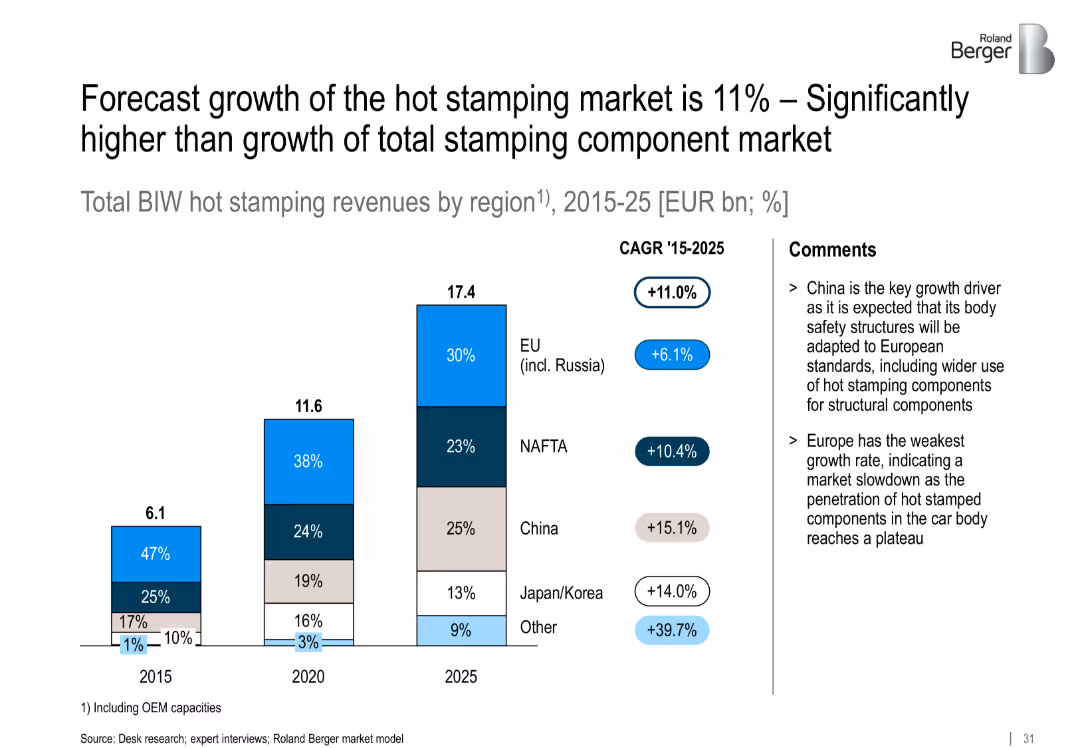
Stacked vertical bar charts (2015, 2020, 2025) comparing regional revenue contributions to hot stamping market. CAGR figures appear alongside a right-side comment box.
Market Analysis and Trends
Industrial & Manufacturing
This slide shows regional CAGR differences in hot stamping adoption. China and Other markets lead in growth, while Europe lags. Hot stamping is becoming essential in body safety designs globally.
CAGR, hot stamping, automotive regions, revenue growth, structural parts, OEM
Pillar
Roland Berger
Saved
Donut chart paired with a bar chart. The donut chart shows 34% have an HR tech strategy, while the bar chart details the strategy prevalence by sector like banking and engineering.
Human Resources and Talent Management
Professional Services
Evaluates the presence of formal HR technology strategies within various sectors, highlighting a significant strategy adoption in banking and engineering.
HR strategy, sectors, technology, donut chart, bar chart
Multiple Chart
PwC/Strategy&
Saved
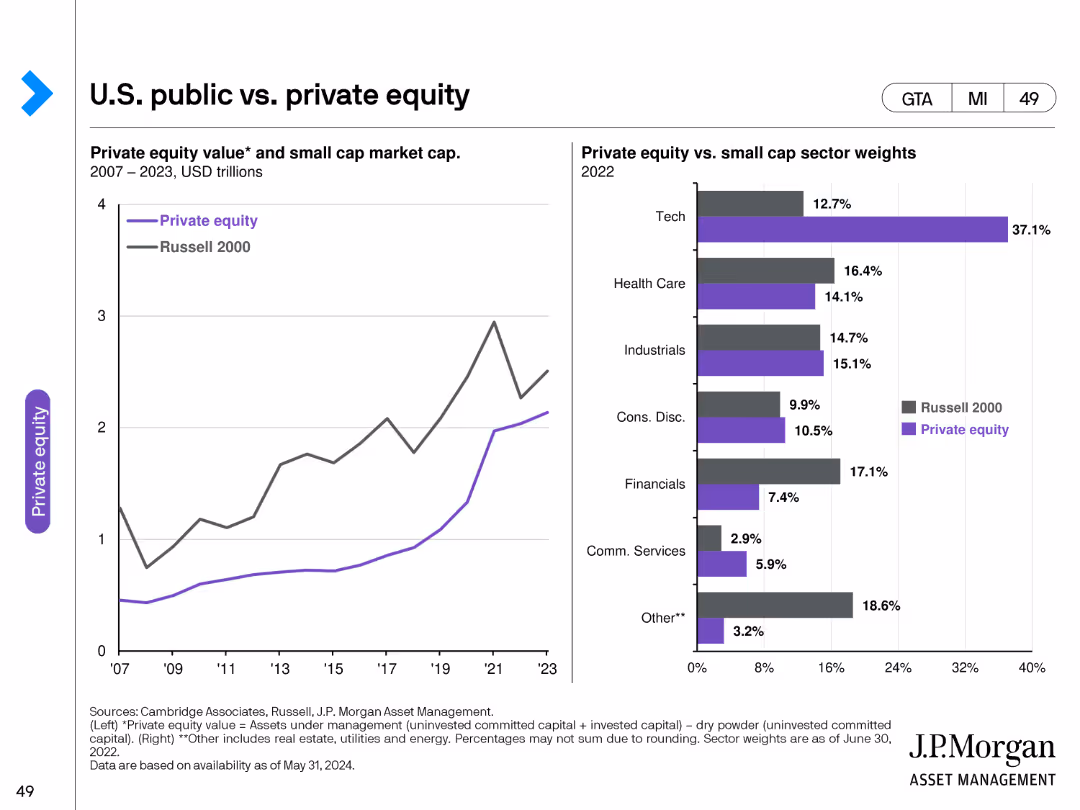
The slide features two charts: a line chart on the left showing the private equity value and small cap market cap from 2007 to 2023, and a bar chart on the right comparing private equity and small cap sector weights in 2022. The charts use distinct colors to differentiate data points and sectors.
Market Analysis and Trends
Financial Services
This slide compares the U.S. public and private equity markets, highlighting trends in private equity value, small cap market capitalization, and sector weights. It is intended to provide insights into the relative performance and sector distribution of these equity markets.
Private equity, small cap market, sector weights, equity comparison, financial analysis, investment trends
Multiple Chart
JP Morgan
Saved
The slide features a world map with highlighted regions, specifically Africa. It indicates areas where L.E.K. Global Education Practice has on-ground experience, with a focus on 20+ African countries. The slide uses shading to highlight regions and a callout for additional emphasis.
Market Analysis and Trends
Education & Training
This slide highlights L.E.K. Consulting’s global education practice, particularly their experience in Africa. It underscores the firm's extensive on-ground experience in over 20 African countries, emphasizing their global reach and specialized expertise in education.
education, global practice, Africa, experience, consulting
Graphic
LEK
Saved
The slide features a column chart showing quarterly revenue and contribution margin along with text summarizing the mission and value of conferences.
Performance Metrics and KPIs
Professional Services
It highlights the value and engagement of conferences, showing revenue and margin trends, and aligns the content to the roles and functions served.
Conferences, value, audience, revenue, margin, engagement, mission, professional, performance, trends
Multiple Chart
Gartner
Saved
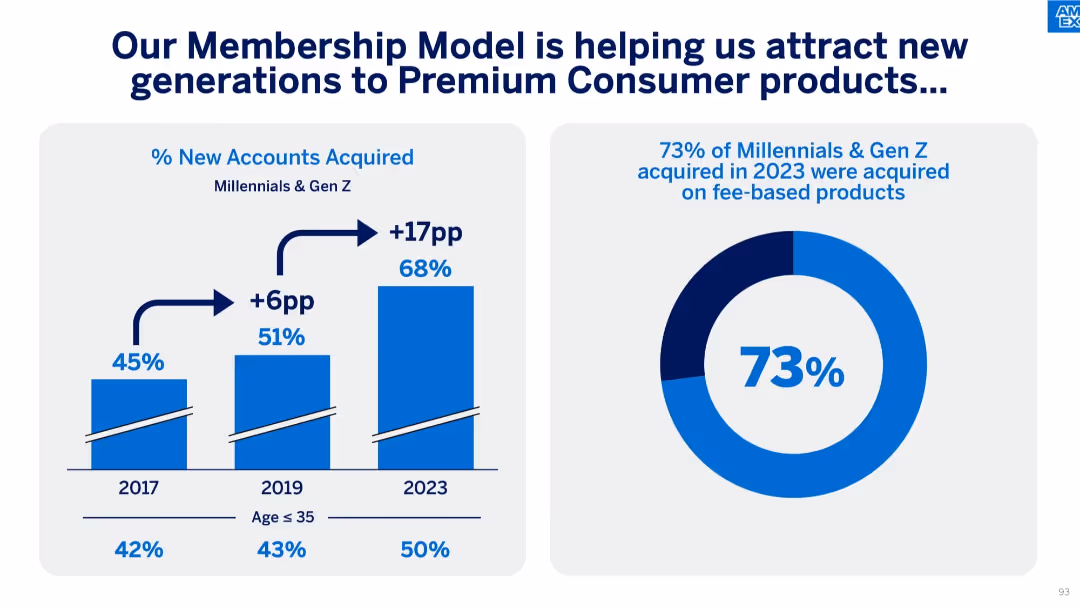
Two-panel layout with a vertical bar chart on the left and a donut chart on the right.
Customer and Market Segmentation
Financial Services
This slide outlines how American Express is attracting Millennials and Gen Z to premium products, with data showing significant increases in fee-based account acquisition among those under 35.
Millennials, Gen Z, Membership Model, Premium Products, New Accounts, Age Segmentation, Fee-based Acquisition
Multiple Chart
McKinsey
Saved
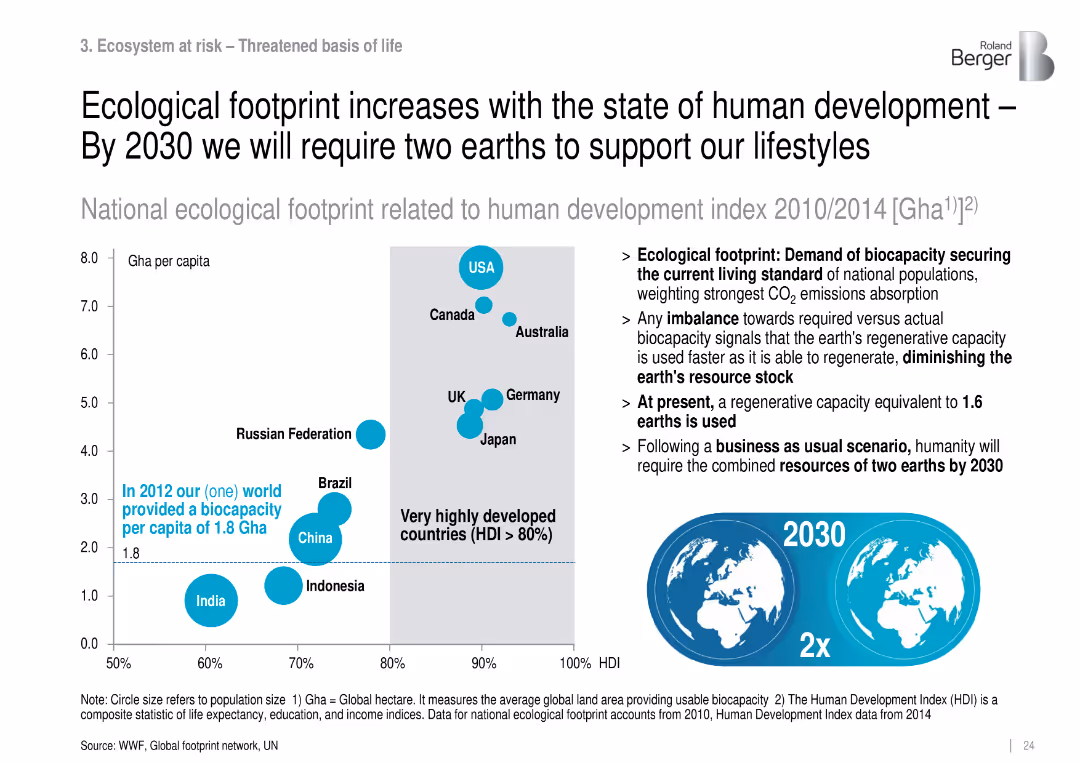
Scatter plot of footprint vs. HDI, with bubble sizes for population; includes 2030 projection.
Market Analysis and Trends
Environmental Services & Sustainability
Explores the link between HDI and ecological footprint, projecting a need for two earths by 2030 if current consumption trends continue.
ecological footprint, HDI, consumption, sustainability, overshoot
Mixed Chart
Roland Berger
Saved
Contains a circular diagram with icons representing the firm's strengths, supplemented by text descriptions around the diagram's perimeter.
Strategic Planning
Financial Services
Articulates the unique position of the firm to support clients with their strengths, emphasizing on client experience.
Client Experience, Differentiation, Talent, Balance Sheet, Innovation, Strategic Integration
Linear Flow
JP Morgan
Saved
The slide features a comparative analysis with column charts illustrating refueling speed, space requirements, and investment costs for petrol, H2 station, and electric fast charger.
Operational Efficiency
Energy & Utilities
The slide compares hydrogen refueling with petrol and electric fast chargers in terms of refueling speed, space requirements, and investment costs, highlighting efficiency benefits.
hydrogen, refueling, space, investment, efficiency
Multiple Chart
Kearney
Saved
Slide with two sections, each with column charts and bullet points of text analysis. Blue, gray, and white dominate the color scheme. Dense with data and text.
Financial Performance
Financial Services
Divides the focus between FICC and equities for global markets, analyzing revenue trends and market conditions, ideal for in-depth financial review.
FICC, Equities, Revenue, Trends, Analysis, Global, Markets, Conditions, Financial, Review
Multiple Chart
Goldman Sachs
Saved
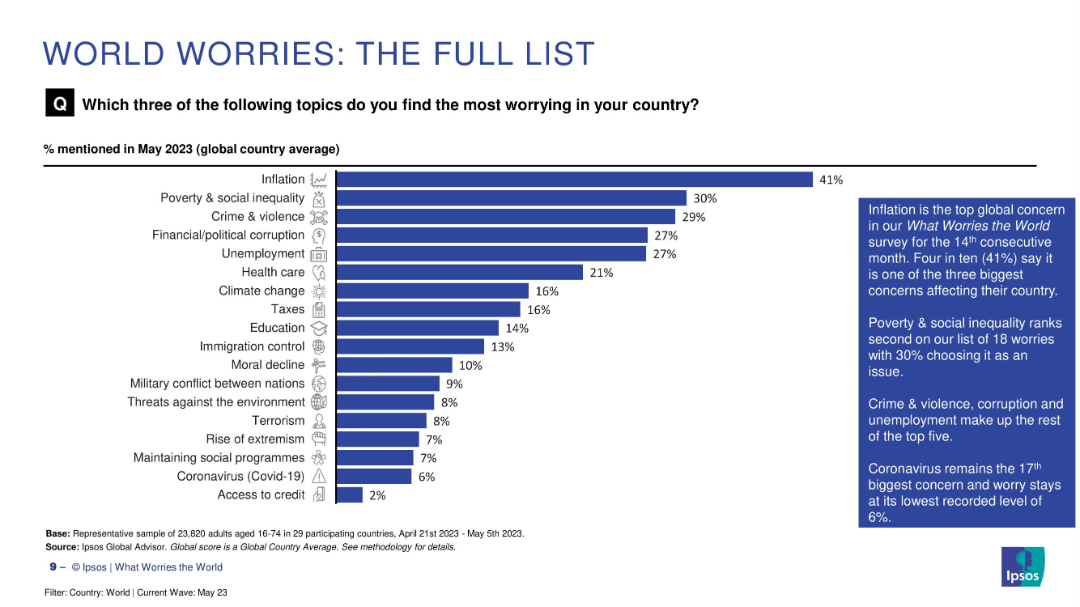
Vertical bar chart showing top 18 global concerns in descending order with annotated summary on the side
Market Analysis and Trends
Professional Services
This slide presents a ranked list of 18 key global worries. Inflation leads at 41%, followed by poverty, crime, and corruption. Less pressing concerns include extremism, terrorism, and COVID-19. Annotations summarize top themes and note declining concern levels for some long-standing issues.
global concerns, ranking, inflation, corruption, health
Mixed Chart
IPSOS
Saved
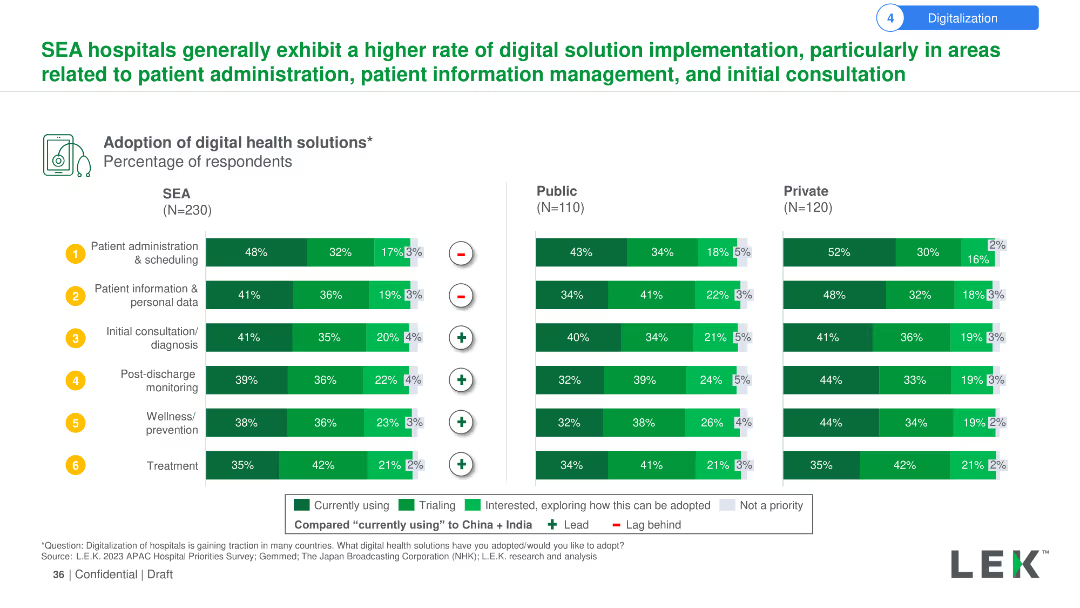
The slide uses a column chart to depict the adoption of various digital health solutions among hospitals in Southeast Asia, with comparisons to public and private hospitals. Each solution is marked with symbols indicating its priority and status compared to China and India.
Technology and Digital Transformation
Healthcare & Pharmaceuticals
The slide details the adoption rates of digital health solutions in SEA hospitals, comparing public and private sectors and indicating current use, trials, and interest levels. Highlights the leading solutions and their comparative status against China and India.
Digital health, adoption, solutions, hospitals, public, private, Southeast Asia, China, India, comparison
Multiple Chart
LEK
Saved
Features a multi-colored line chart tracking the total shareholder return over ten years, comparing company performance against peers and the S&P 500.
Investment Analysis
Consumer Goods
Highlights the exceptional shareholder returns generated by the company over a decade, comparing favorably against industry peers and market averages.
shareholder return, long-term performance, S&P 500, peers, market comparison
Single Chart
Barclays
Saved
The slide features bar charts and tables showcasing the function by ethnicity, and the gender breakdown for Hispanic employees across different years.
Human Resources and Talent Management
Professional Services
The slide analyzes the ethnic diversity of employees, with a focus on Hispanic employees and their roles in investment, finance, and other functions.
ethnic diversity, Hispanic employees, gender diversity, employee functions, investment firms
Mixed Chart
Deloitte
Saved
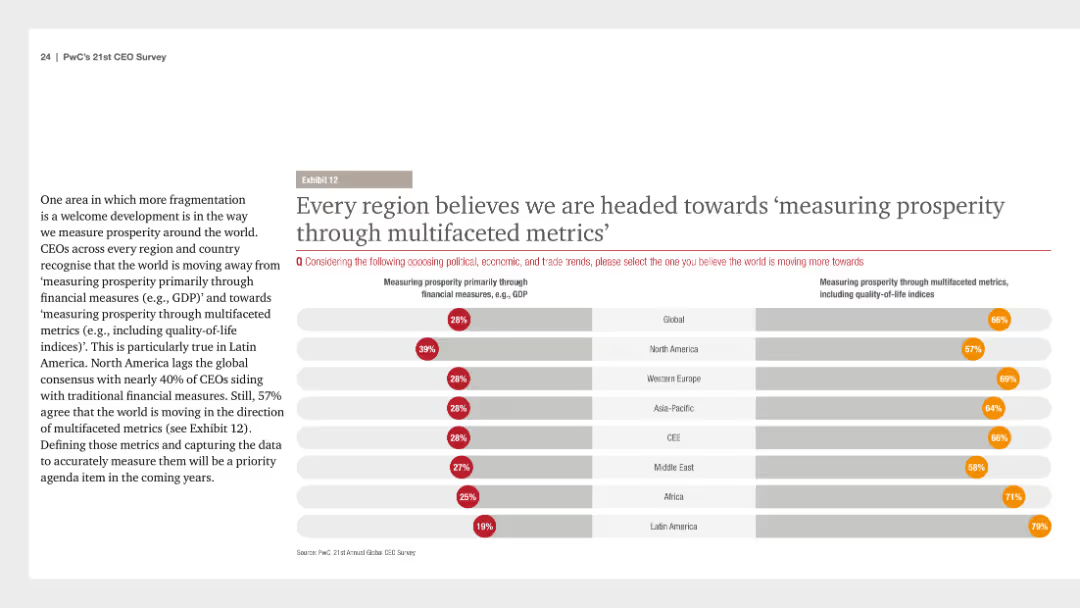
A column chart depicting regional perspectives on measuring prosperity through multifaceted metrics versus financial measures. Text provides context about global CEO opinions.
Market Analysis and Trends
Financial Services
CEOs across regions believe that measuring prosperity is moving towards multifaceted metrics including quality-of-life indices. The chart shows the percentage split between traditional financial measures and multifaceted metrics.
prosperity, metrics, CEOs, financial, regional
Multiple Chart
PwC/Strategy&
Saved
Displays column charts and bullet points illustrating changes in the CET1 ratio over time.
Financial Performance
Financial Services
Explains the factors influencing the CET1 capital ratio, crucial for understanding financial stability.
CET1 ratio, financial stability, capital, regulation
Multiple Chart
Citigroup
Saved
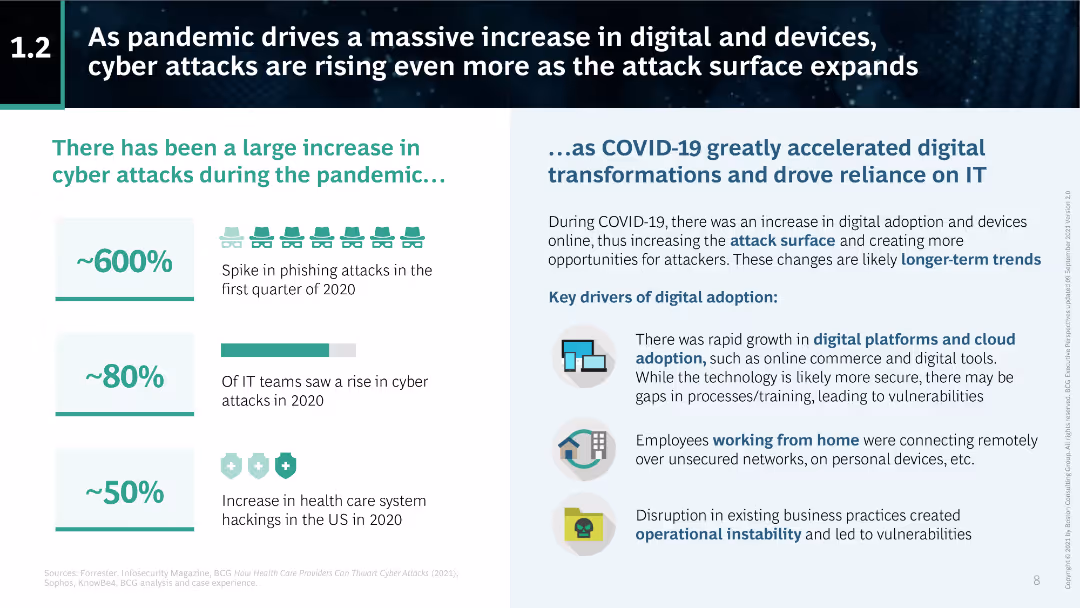
The slide includes several statistics and icons highlighting the increase in cyber attacks during the pandemic and the drivers of digital adoption.
Risk Assessment and Management
Technology & Software
This slide explains the rise in cyber attacks during the COVID-19 pandemic, citing a 600% increase in phishing attacks and an 80% rise in cyber attacks on IT teams. It also discusses key drivers of digital adoption.
pandemic, digital adoption, cyber attacks, COVID-19, phishing, IT security, statistics, cybersecurity, BCG
Boxed
BCG
Saved
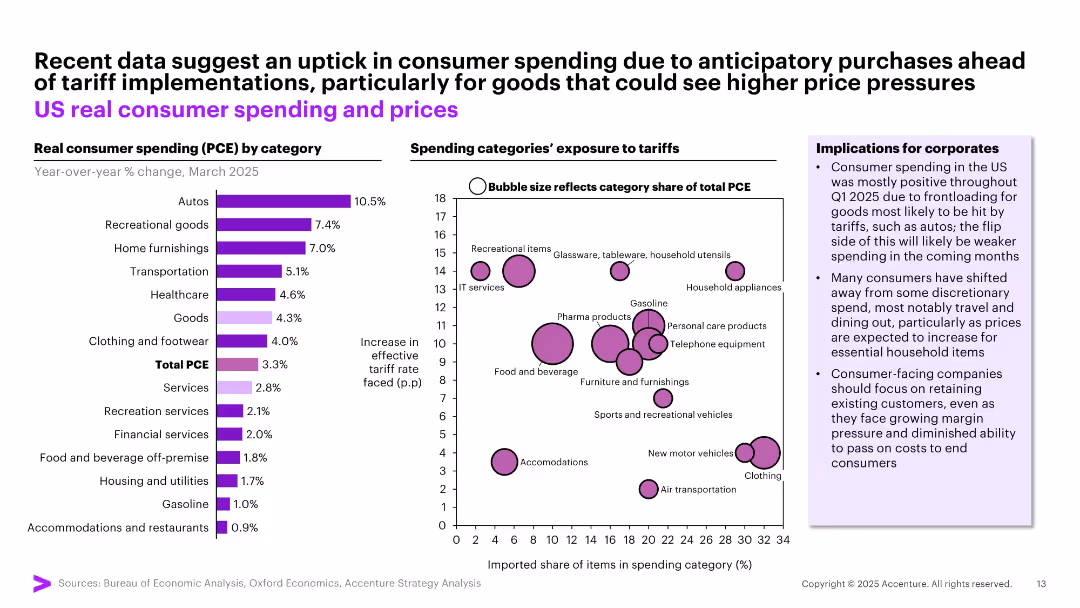
Left: Bar chart of real consumer spending by category. Right: Bubble chart showing spending category exposure to tariffs.
Pricing Strategies
Consumer Goods
Indicates temporary increases in US consumer spending due to anticipatory purchases ahead of tariffs—especially for autos and recreational goods. Accompanied by bubble plot detailing categories most exposed to tariff hikes, highlighting risks and opportunities for pricing strategy.
tariff impact, consumer behavior, pricing, spending categories, strategy
Multiple Chart
Accenture
Saved
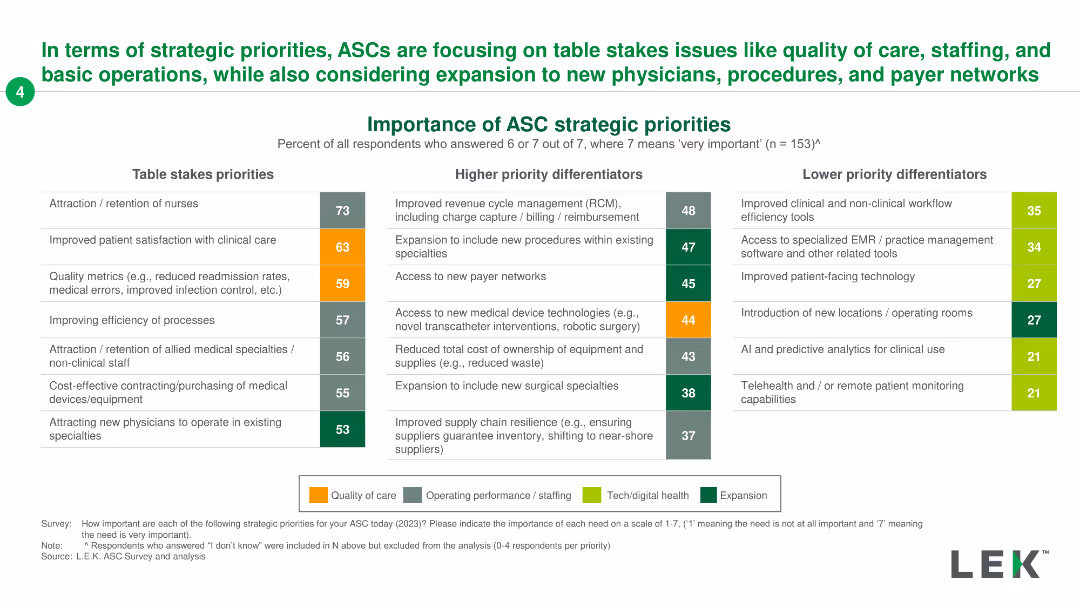
The slide features a two-column chart listing table stakes priorities and higher priority differentiators for ASC strategies, with emphasis on various operational aspects.
Strategic Planning
Healthcare & Pharmaceuticals
It outlines the strategic priorities for ASCs, emphasizing critical areas like staffing, patient care, and operational improvements, along with high-priority differentiators.
ASC, strategic, priorities, staffing, care
Table
LEK
Saved
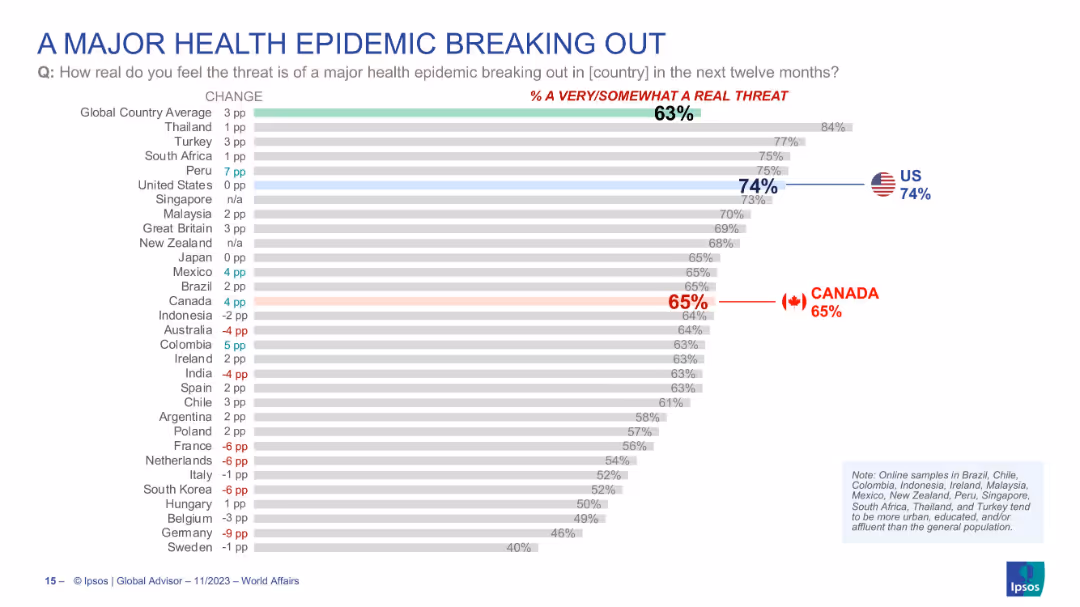
Horizontal bar chart showing how real people perceive the threat of a health epidemic in their country, with countries ranked by concern level.
Risk Assessment and Management
Healthcare & Pharmaceuticals
Country comparison of how real people think the risk of a major health epidemic is. U.S. (74%) ranks highly, with global average at 63%. Canada’s concern is at 65%. Includes % change from previous year, showing shifting perceptions of epidemic threat.
health epidemic, public threat, perception, global concern, pandemic, Ipsos, national comparison, risk
Single Chart
IPSOS
Saved
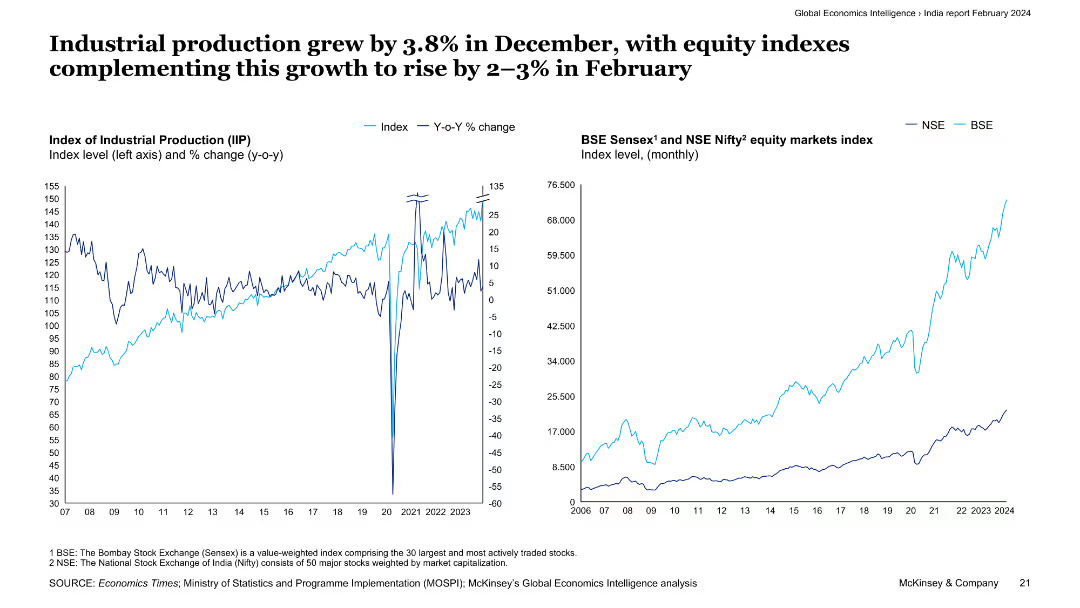
Two line charts are shown: the left chart illustrates the index and year-on-year change in industrial production, while the right chart depicts the BSE Sensex and NSE Nifty equity market indexes.
Market Analysis and Trends
Industrial & Manufacturing
The slide highlights a 3.8% growth in industrial production for December, supported by rising equity indexes in February. It provides an analysis of industrial output and stock market performance in India.
industrial production, equity indexes, BSE Sensex, NSE Nifty, market performance
Multiple Chart
McKinsey
Saved
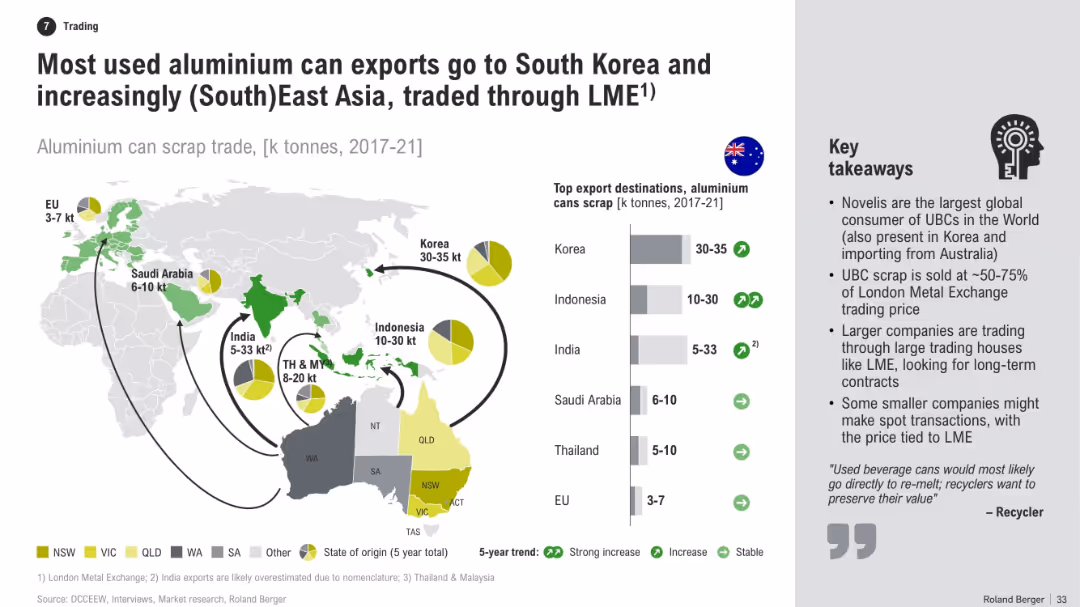
World map with flow arrows showing export volumes of aluminium can scrap, accompanied by bar chart and pie charts indicating top destinations. Right side includes key takeaways in bullet points.
Market Analysis and Trends
Industrial & Manufacturing
This slide illustrates Australia’s export destinations for used aluminium cans, emphasizing major trading partners in Asia. It highlights trade volume trends, the role of the LME, and the business models of companies involved in aluminium scrap exports.
aluminium, scrap, exports, Korea, LME, trading, recycling, Asia, destinations, trends
Multiple Chart
Roland Berger
Saved
Image and text layout explaining three strategic steps: Get a head start, Embed value-based models, and Amplify benefits with larger partners.
Strategic Planning
Professional Services
Advises on strategic managed services engagement for investment, emphasizing early involvement and collaboration with large partners for operational improvements.
strategy, managed services, investment, benefits, partners
Linear Flow
Accenture
Saved
Previous
Next
If nothing, comes up, please save your slides first
Create a FREE account to continue browsing
Receive Instant Access to 1,000+ slides from companies like McKinsey, Google, and Goldman Sachs
First Name
Last Name
Email
Password
I agree to all
Terms & Privacy Policy
Thank you! Your submission has been received!
Oops! Something went wrong while submitting the form.
Have an account?
Sign in
Column Chart
Heatmap
Chevron
Org Chart
Infographic
Callouts
Timeline
List
Graphic
Picture
Process Flow
Diagram
Paragraph
Map
Table
Framework
Subtitle
Takeaway Box
Icon
Other Chart
Radar Chart
Waterfall Chart
Mekko Chart
Pie Chart
Scatter Plot
Line Chart
Bar chart
Bullet points