My Account
My Slides
Search by Category
Templates
Leave Feedback
Login
Logout
Get Started
Browse all Slides
Browse all Slides
Create a FREE Account
Instant access to 1,000+ real slides from top companies like McKinsey, BCG, Goldman Sachs, Google and many more!
First Name
Last Name
Email
Password
I agree to all
Terms & Privacy Policy
Thank you! Your submission has been received!
Oops! Something went wrong while submitting the form.
Have an account?
Sign in
Saved Slides
Line graph showing the yearly variance of NCDOT's cash balance from forecasts, marking a shift in FY19 with a detailed analysis of trends over time.
Regulatory and Compliance
Government & Public Sector
Analyzes the shift in cash balance variance for NCDOT in FY19, highlighting issues in fiscal management. Useful for government finance and policy analysis.
fiscal management, variance, government, NCDOT, trends
Single Chart
McKinsey
Saved
Various pie charts and maps showing the composition of survey respondents by jurisdiction, title/role, revenue, and industry sectors.
Market Analysis and Trends
Professional Services
This slide provides an overview of survey respondents' profiles, including their jurisdiction, revenue, roles, and industry sectors, offering insights into the survey's demographic.
Survey, respondents, jurisdiction, revenue, roles, industry, composition, demographics, analysis, profile
Multiple Chart
EY
Saved
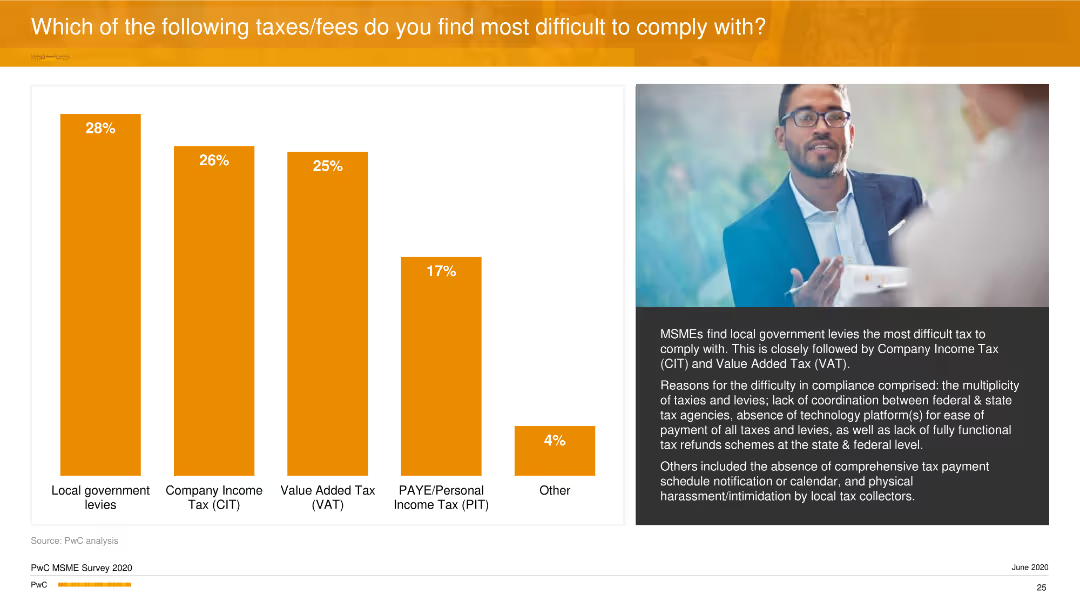
A vertical column chart ranks the difficulty of compliance with various taxes and fees. An image of a man with glasses is featured on the right side.
Regulatory and Compliance
Financial Services
The slide examines the challenges MSMEs face in complying with different taxes, highlighting local government levies and company income tax as the most problematic. It discusses the reasons behind these difficulties.
Taxes, Compliance, MSMEs, Business, PwC
Mixed Chart
PwC/Strategy&
Saved
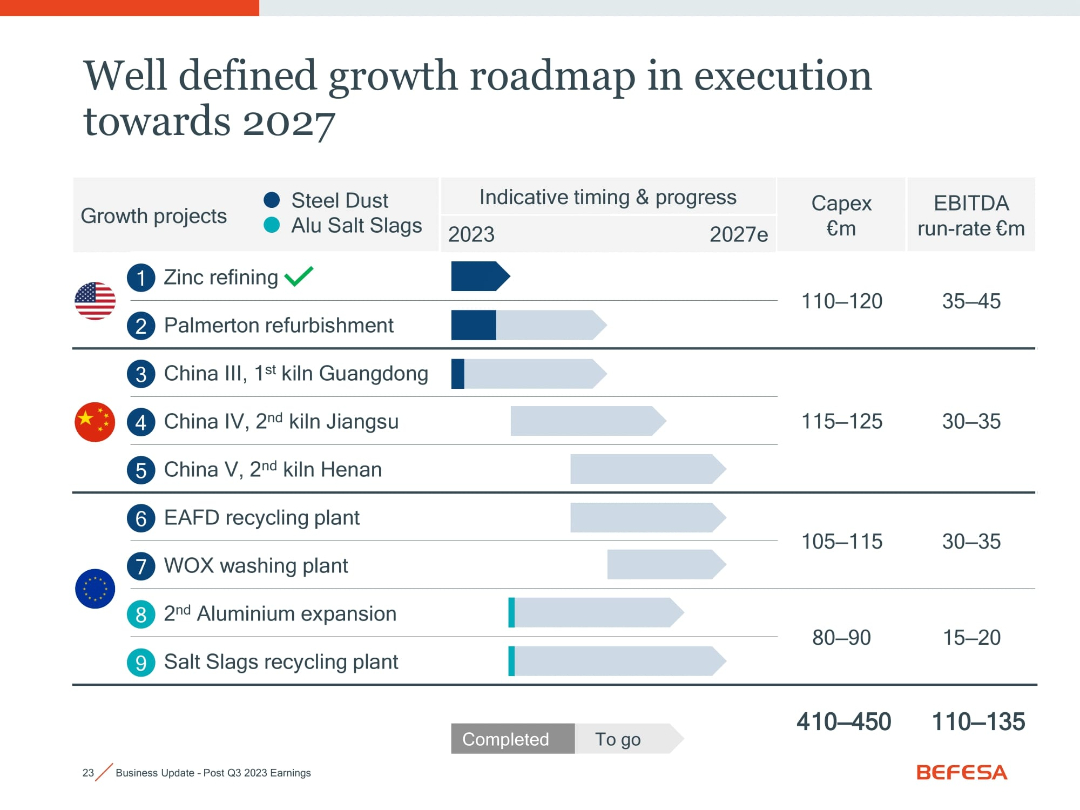
Identical layout as slide 18021; duplicate showing project timelines, status, Capex, and EBITDA across growth initiatives.
Strategic Planning
Industrial & Manufacturing
Repeats the visual and data of slide 18021: summarizing strategic initiatives through 2027, with emphasis on progress tracking and return expectations for steel dust and aluminum slag projects globally.
growth roadmap, strategy, Capex, recycling, aluminum, steel dust, 2027
Single Chart
Goldman Sachs
Saved
Contains a bar chart comparing the importance of AI applications in risk management and ethics.
Risk Assessment and Management
Technology & Software
Analyzes the critical AI applications for managing risks and improving AI ethics in businesses.
AI, risk management, ethics, applications, importance
Single Chart
PwC/Strategy&
Saved
The slide includes multiple bar charts comparing the change in transportation modes across different regions. Each chart represents changes in percentages and is colored based on region.
Market Analysis and Trends
Transportation & Logistics
Compares regional responses in transportation mode usage shifts before and after a global crisis.
transportation, regional, mode shift, crisis, comparison
Multiple Chart
McKinsey
Saved
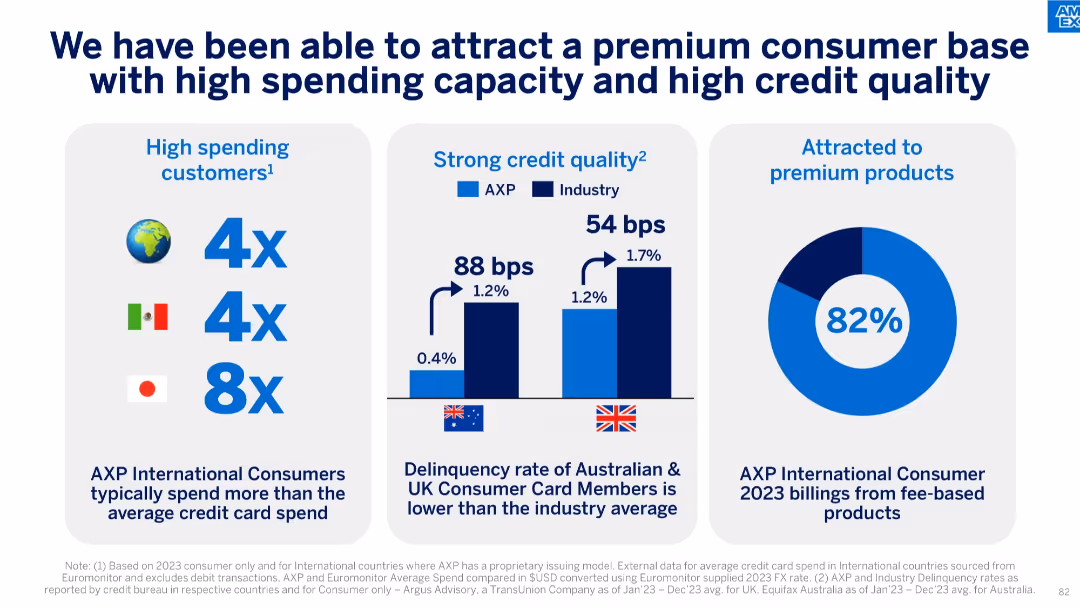
Three-column layout with charts and text; shows high spend, low delinquency, and premium product adoption.
Customer and Market Segmentation
Financial Services
Emphasizes that AXP attracts high-spending and low-risk international consumers, particularly in Japan, Mexico, UK, and Australia. Also shows that 82% of 2023 international consumer billing came from premium fee-based products.
premium customers, credit quality, card spend, delinquency rate, fee-based products, international consumers, segmentation
Multiple Chart
McKinsey
Saved
Slide includes diagrams and text comparing production methods of grey, blue, and green hydrogen, highlighting CO2 emissions and investment requirements.
Strategic Planning
Energy & Utilities
Provides an overview of different hydrogen production methods with a focus on their potential, investment needs, and carbon footprint, relevant for strategic planning in energy sector.
hydrogen, energy, low-carbon, investment, production methods, CO2 emissions
Table
McKinsey
Saved
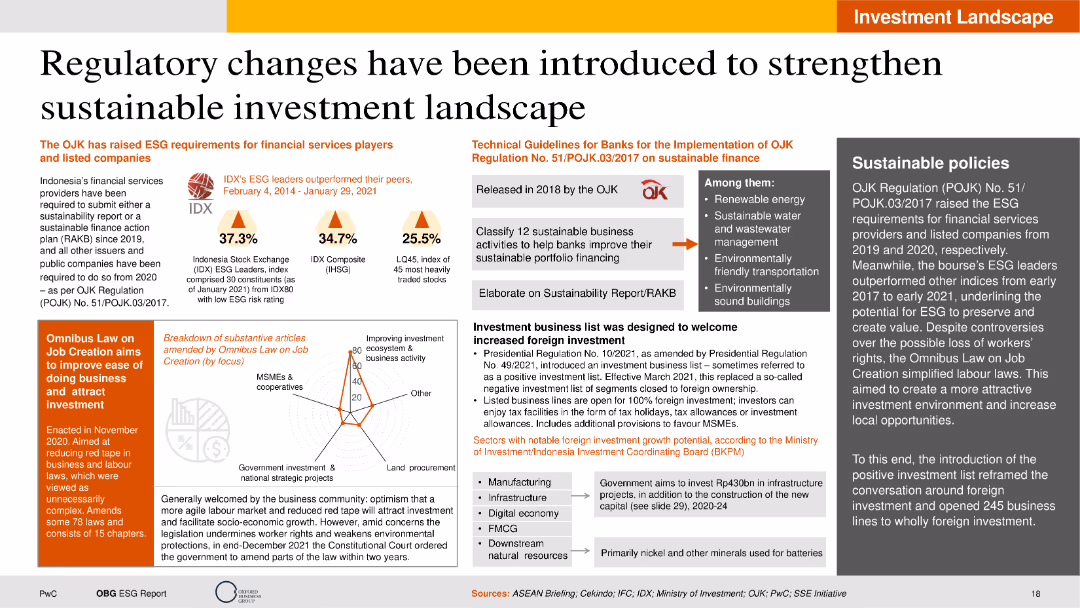
The slide is moderately dense with a combination of text, column charts, icons, and infographics. It has a clear layout featuring sections with distinct background colors for easy distinction. Key metrics are highlighted using column charts.
Regulatory and Compliance
Financial Services
The slide discusses recent regulatory changes in Indonesia aimed at strengthening the sustainable investment landscape. It covers the introduction of ESG requirements, technical guidelines for banks, and the impact of the Omnibus Law on job creation. The slide includes statistical performance data of IDX ESG leaders and highlights key areas for sustainable business activities.
Regulatory changes, ESG requirements, sustainable finance, Omnibus Law, IDX performance
Mixed Chart
PwC/Strategy&
Saved
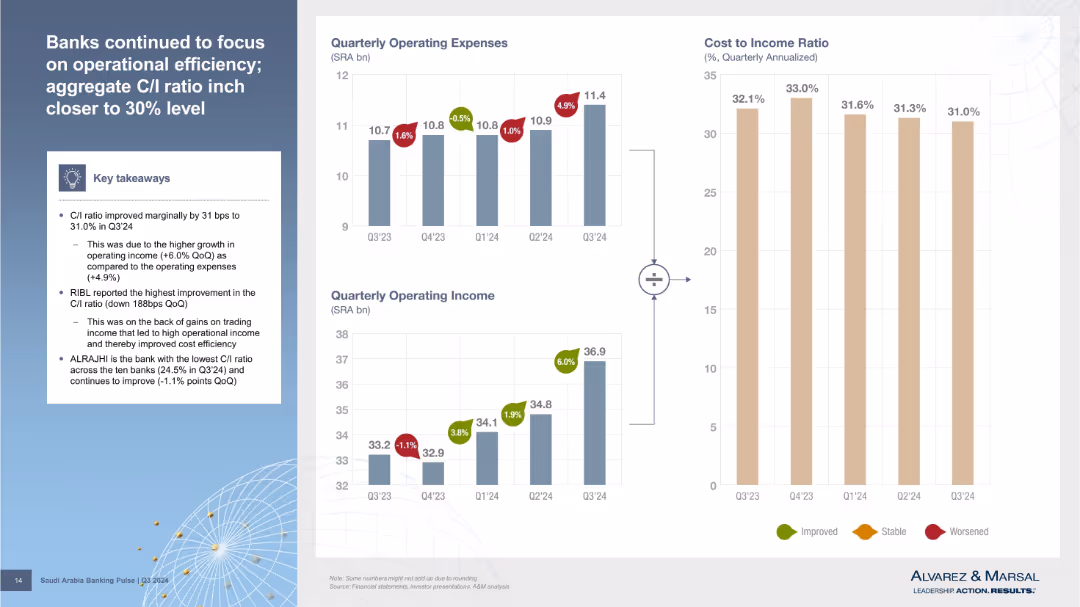
Three bar charts (Operating Expenses, Operating Income, Cost-to-Income Ratio) with callouts and a textbox of key takeaways on the left. Visual style is clean with color-coded indicators (green/red/yellow) for improvement, stability, or worsening metrics.
Performance Metrics and KPIs
Financial Services
The slide shows a marginal improvement in the cost-to-income (C/I) ratio driven by higher income growth over expenses. RIBL had the best improvement, while ALRAJHI maintained the lowest C/I ratio. The visual aids illustrate these financial efficiency trends across Q3’24.
cost-to-income ratio, operating income, operating expenses, bank efficiency, Q3 2024
Multiple Chart
Alvarez & Marsal
Saved
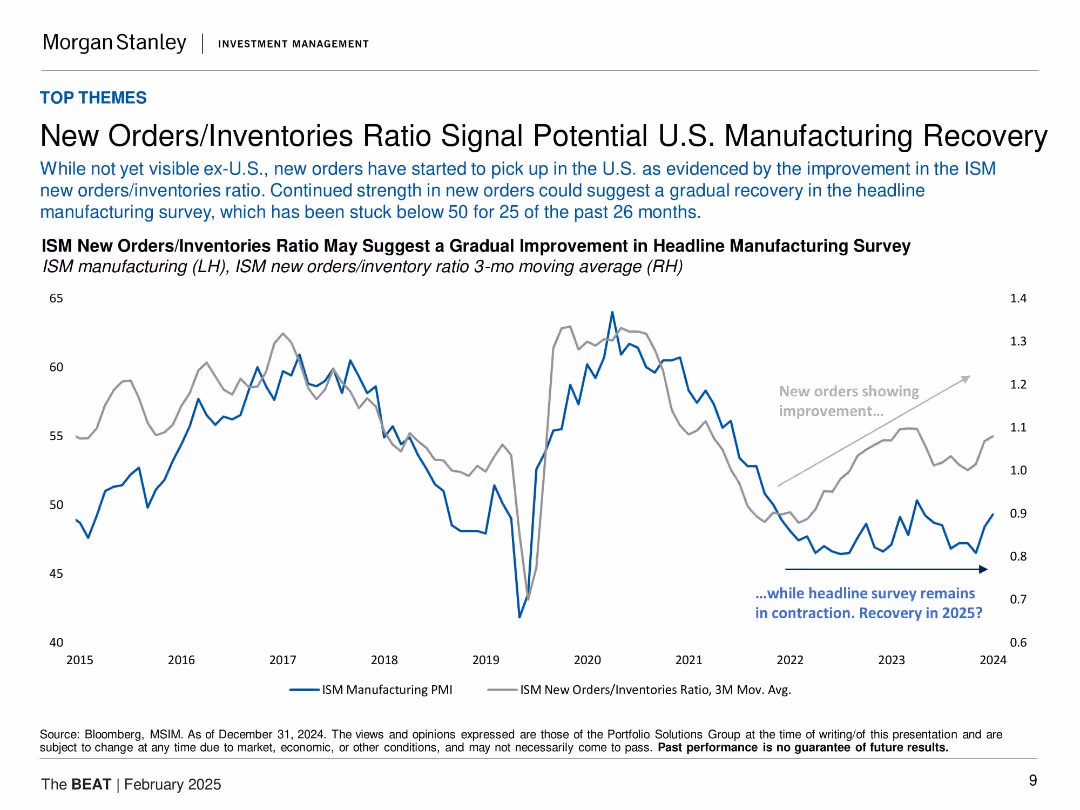
Dual-axis line chart comparing ISM Manufacturing PMI and new orders/inventories ratio from 2015–2024. Gray annotation indicating trend shift.
Performance Metrics and KPIs
Industrial & Manufacturing
The slide presents evidence of an early U.S. manufacturing recovery through rising new orders relative to inventories, despite the ISM headline manufacturing survey remaining below 50. It suggests cautious optimism for a recovery in 2025, with visual trends showing divergence between new orders and PMI metrics over time.
ISM PMI, new orders, inventories, U.S. manufacturing, recovery, economic signal, KPIs, factory output
Single Chart
Morgan Stanley
Saved
The slide contains a table listing various investment projects in the Greek T&T sector, detailing submarkets, locations, brands, and investment amounts. There is a text box on the right summarizing the hotel sector's performance.
Investment Analysis
Hospitality & Tourism
Highlights investment projects in the Greek T&T sector as of September 2022. It shows submarkets, locations, brands, and investment amounts. The text box explains the positive outlook for the hotel sector despite the impact of COVID-19.
Investment, Greek T&T, Projects, Hotels, COVID-19
Mixed Chart
EY
Saved
Contains images and graphs relating to emotional consumer behavior and its impact on health and brand interactions, including timelines of discussion popularity.
Customer and Market Segmentation
Technology & Software
Explores the emotional dimensions of consumer behavior, focusing on topics like "toxic positivity" and digital wellbeing.
emotional impact, health, advertising, consumer behavior, wellbeing
Multiple Chart
Bain
Saved
A data-driven slide with bar graphs, column charts, and a pie chart. High density of information, contrasting colors, and significant textual content.
Market Analysis and Trends
Technology & Software
It presents a detailed analysis of digital consumer behavior in Indonesia, covering e-commerce, media usage, and a breakdown of the willingness to pay for sustainable products, intended for market analysis purposes.
digital consumers, Indonesia, e-commerce, media usage, sustainability
Multiple Chart
Bain
Saved
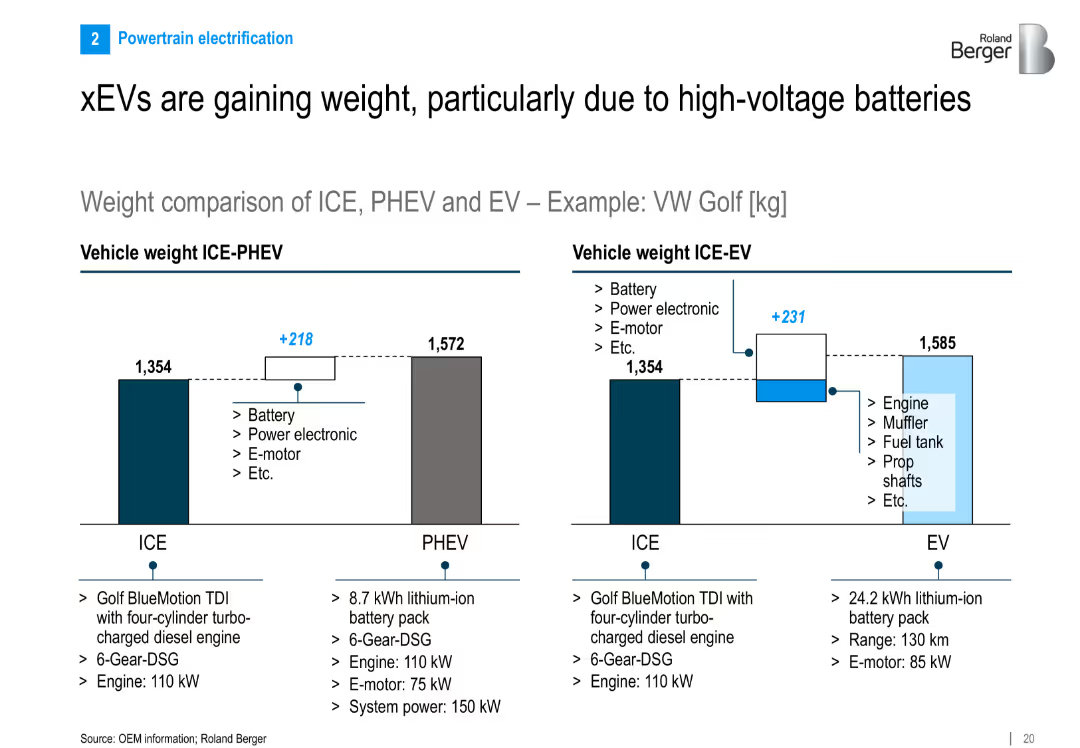
Side-by-side bar charts comparing weight of ICE, PHEV, and EV variants of VW Golf; includes breakdown of added components
Product and Service Analysis
Industrial & Manufacturing
Shows that electrified vehicles (PHEV, EV) are heavier than ICE vehicles due to components like batteries and motors. Uses VW Golf as an example to quantify weight differences and contributing components.
EV weight, PHEV, ICE, battery pack, vehicle mass, VW Golf, e-motor, power electronics
Multiple Chart
Roland Berger
Saved
The left side of the slide provides text information on power generation capacity additions in Turkey, while the right side features a stacked column chart showing the breakdown of power generation by source (hydropower, coal, natural gas, etc.) from 2007 to 2022.
Market Analysis and Trends
Energy & Utilities
The slide discusses the significant growth and diversification of power generation capacity in Turkey over the past 15 years, with a focus on renewable energy sources like wind, solar, and geothermal. It includes a column chart showing the changes in power generation sources over time.
Turkey, power, generation, renewable, diversification
Mixed Chart
Kearney
Saved
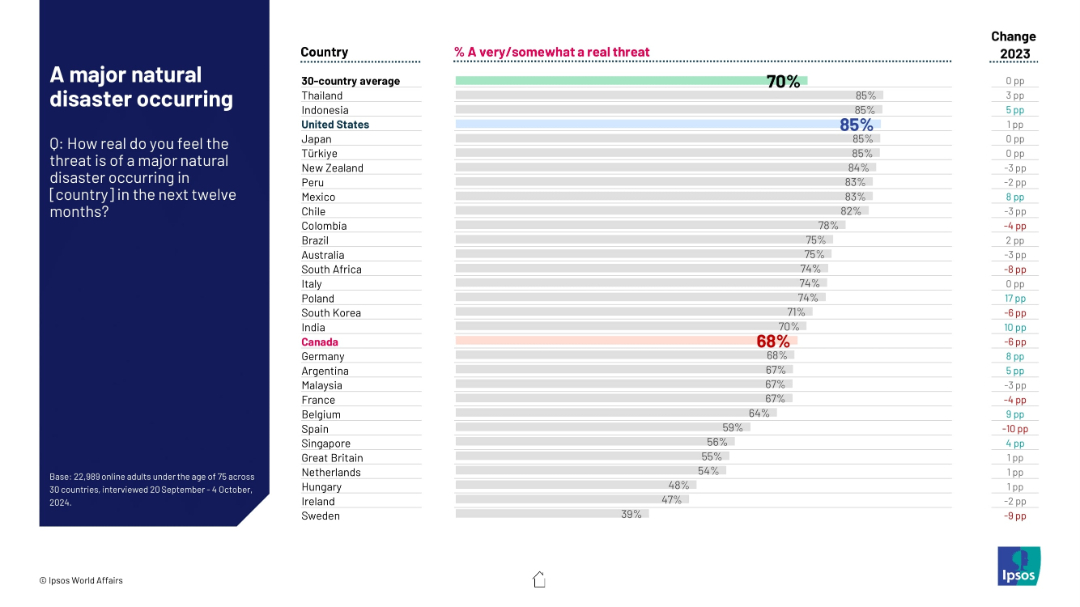
Horizontal bar chart showing likelihood of major disaster by country; global average at top, Canada highlighted.
Risk Assessment and Management
Environmental Services & Sustainability
This slide reflects how real people think the threat of a major natural disaster is in their country. The global average is 70%, with high concern in the U.S., Thailand, and Indonesia (85%). Canada, at 68%, shows a 10-point rise over last year.
natural disaster, climate risk, environmental concern, public safety, Ipsos, disaster prediction, regional threat, global average, year-over-year
Mixed Chart
IPSOS
Saved
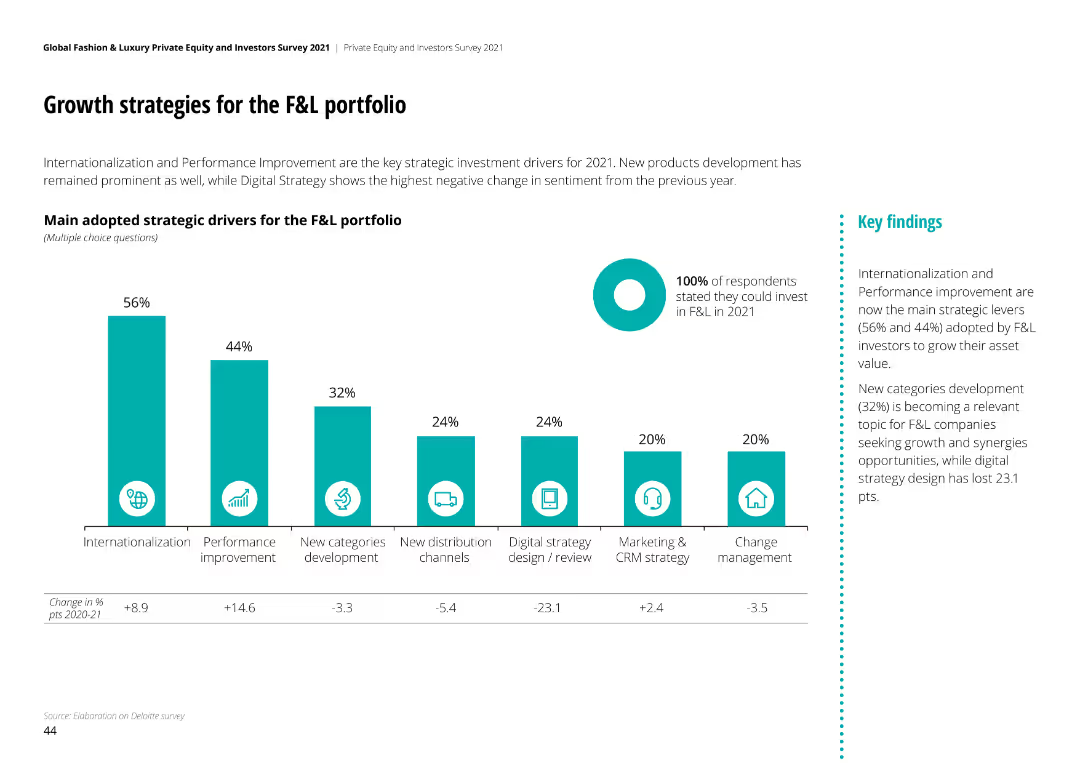
Column chart showing strategic drivers for F&L portfolio growth, with Internationalization and Performance Improvement leading.
Strategic Planning
Financial Services
Key strategic investment drivers for 2021 include Internationalization (56%) and Performance Improvement (44%), with Digital Strategy seeing the largest negative change.
growth strategies, F&L portfolio, strategic planning, investment drivers, performance improvement
Mixed Chart
Deloitte
Saved
Presents a flow chart with elements classified into Traditional, Next Generation, and Digital Optimization phases, each with icons and text.
Strategic Planning
Professional Services
Explores the evolution of cost reduction programs, from traditional levers focused on operating model efficiency to digital optimization incorporating advanced technologies for real-time insights and automation.
Cost Reduction, Digital Optimization, Traditional Levers, Next Generation, Evolution
Table
Deloitte
Saved
Includes a line graph and pie charts, showing the global internet advertising revenue and the shift towards mobile display.
Market Analysis and Trends
Media & Entertainment
Details the trends in internet advertising with a focus on the rise of mobile display ads, driven by advancements in 5G and IoT.
internet advertising, mobile display, global, 5G, IoT
Multiple Chart
PwC/Strategy&
Saved
The slide features column charts displaying Revenue Growth, EBITDA Growth, and EBIT Margins for Waste Management and Environmental Services sectors from 2018 to 2020. Key points are listed in bullet points at the top.
Financial Performance
Financial Services
This slide evaluates the revenue, EBITDA, and EBIT margin trends in the Waste Management and Environmental Services sectors from 2018 to 2020, indicating minimal revenue contraction and stable EBITDA margins despite market challenges.
Revenue Growth, EBITDA, EBIT Margins, Waste Management, Environmental Services
Multiple Chart
LEK
Saved
Rocket-shaped diagram with five steps explaining how emerging countries can increase their technological competitiveness. Text details each step, from FDI to robust educational systems.
Technology and Digital Transformation
Technology & Software
The slide outlines a five-step approach for emerging countries to enhance their technological competitiveness. It emphasizes the role of FDI, capital inflows, robust educational systems, and sectoral supply chains in transforming these countries into competitive innovation leaders.
Technological Competitiveness, Emerging Countries, FDI
Vertical Flow
Roland Berger
Saved
A diamond-shaped quadrant with four segments shows Goldman Sachs services, juxtaposed with Orsted’s services on the right.
Organizational Structure and Change
Financial Services
Describes Goldman Sachs' comprehensive service structure and how it supports a local client with global capabilities through different services.
Goldman Sachs, Global Markets, Asset Management, Investment Banking, Client Services, Orsted, Financing, Advising
Header Vertical
Goldman Sachs
Saved
Features a comparison of different battery technologies, including lithium-ion, flow batteries, and sodium-ion. The slide uses bar graphs to depict expected global demand and Australia's relative strength in these technologies. Color coding and icons are used to visually differentiate each technology type, with additional textual descriptions providing context on their applications and advantages.
Competitive Landscape
Energy & Utilities
Analyzes the market potential and advantages of various battery technologies, focusing on Australia's strengths and opportunities in sectors like lithium-ion and flow batteries.
battery technologies, Australia, global market, lithium-ion, flow batteries, sodium-ion, market analysis, technology strengths, future potential, energy storage
Mixed Chart
Accenture
Saved
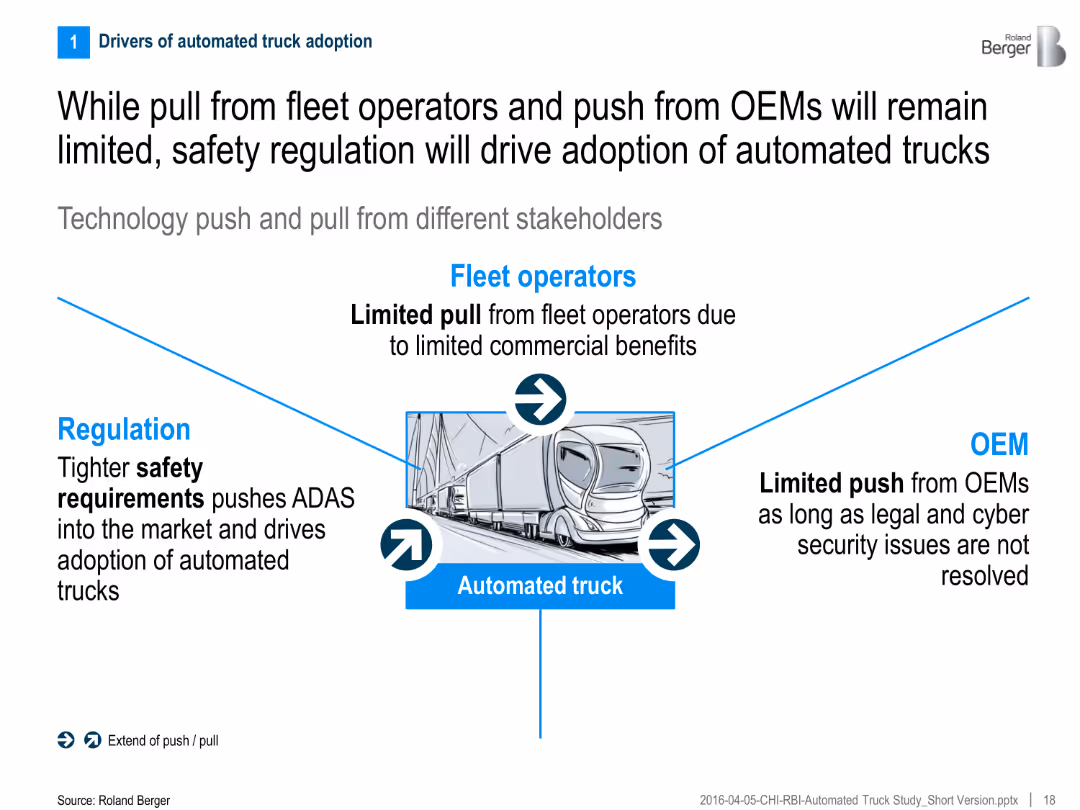
Central graphic showing push/pull from regulation, fleet operators, and OEMs toward automated truck adoption
Regulatory and Compliance
Transportation & Logistics
The slide highlights the limited commercial incentives from fleet operators and OEMs, stressing that regulation—especially safety requirements—is the key driver for automated truck adoption.
Regulation, OEMs, fleet operators, safety, automated trucks, adoption drivers, technology push/pull
Linear Flow
Roland Berger
Saved
Previous
Next
If nothing, comes up, please save your slides first
Create a FREE account to continue browsing
Receive Instant Access to 1,000+ slides from companies like McKinsey, Google, and Goldman Sachs
First Name
Last Name
Email
Password
I agree to all
Terms & Privacy Policy
Thank you! Your submission has been received!
Oops! Something went wrong while submitting the form.
Have an account?
Sign in
Column Chart
Heatmap
Chevron
Org Chart
Infographic
Callouts
Timeline
List
Graphic
Picture
Process Flow
Diagram
Paragraph
Map
Table
Framework
Subtitle
Takeaway Box
Icon
Other Chart
Radar Chart
Waterfall Chart
Mekko Chart
Pie Chart
Scatter Plot
Line Chart
Bar chart
Bullet points