My Account
My Slides
Search by Category
Templates
Leave Feedback
Login
Logout
Get Started
Browse all Slides
Browse all Slides
Create a FREE Account
Instant access to 1,000+ real slides from top companies like McKinsey, BCG, Goldman Sachs, Google and many more!
First Name
Last Name
Email
Password
I agree to all
Terms & Privacy Policy
Thank you! Your submission has been received!
Oops! Something went wrong while submitting the form.
Have an account?
Sign in
Saved Slides
This slide presents column charts showing the growth of gaming revenues in Hong Kong and Singapore from 2020 to 2025, differentiating between traditional and social/casual gaming with red and grey bars. The slide layout is clear with annotations explaining shifts due to the pandemic.
Market Analysis and Trends
Media & Entertainment
Discusses the shifting dynamics of the gaming industry in Hong Kong and Singapore between 2020 and 2025, highlighting how pandemic-related changes affected traditional and social/casual gaming revenues. It points out Singapore's rise as a gaming hub due to policy support.
gaming industry, Hong Kong, Singapore, revenue trends, pandemic impact
Multiple Chart
PwC/Strategy&
Saved
This slide has a composite column chart depicting banking and wealth management deposit balances over time.
Market Analysis and Trends
Financial Services
Illustrates customer growth and activities influencing banking and wealth management deposits, capturing money in motion.
banking, wealth management, deposit balances, customer growth, yield-seeking, JPMorgan Chase & Co
Single Chart
JP Morgan
Saved
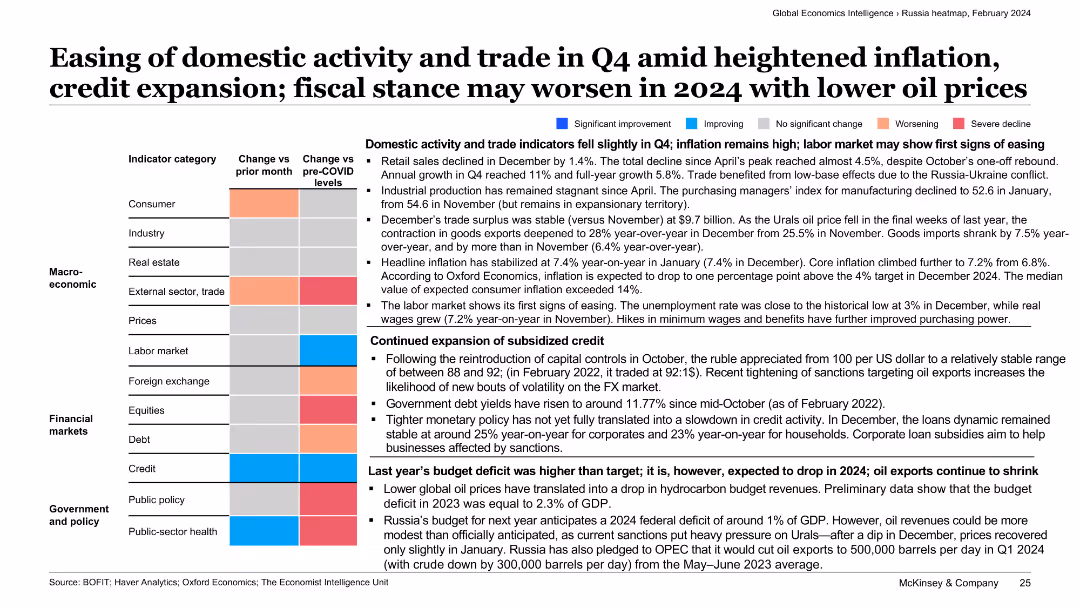
The slide presents a categorized text summary with color-coded economic indicators. It covers aspects like domestic activity, inflation, labor market, and fiscal stance in Russia.
Market Analysis and Trends
Transportation & Logistics
This slide discusses the easing of domestic activity and trade in Q4 amid heightened inflation and credit expansion. It also covers Russia’s fiscal stance and potential economic challenges in 2024.
domestic activity, trade, inflation, credit expansion, fiscal stance
Table
McKinsey
Saved
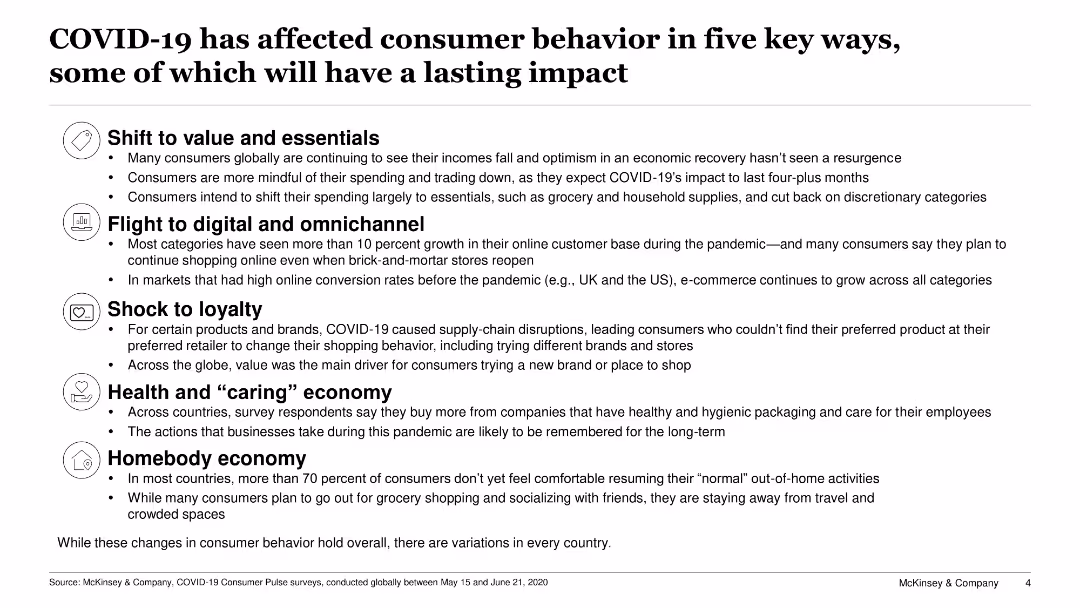
Lists five key impacts of COVID-19 on consumer behavior with bullet points for each, including value shift, digital shift, loyalty shock, health economy, and homebody economy.
Strategic Planning
Consumer Goods
The slide details the long-term impacts of COVID-19 on consumer behavior, emphasizing shifts towards value and essentials, digital adoption, changes in loyalty, and health-focused buying.
COVID-19, consumer behavior, long-term impact, digital shift, health economy
Header Vertical
McKinsey
Saved
The slide includes a donut chart displaying responses to a true/false question about the safety of company stocks versus mutual funds. The layout is moderately complex.
Market Analysis and Trends
Financial Services
This slide evaluates the perception of the safety of investing in company stocks versus mutual funds, showing that 51% correctly identified mutual funds as generally safer. It aims to assess investment knowledge.
stocks, mutual funds, safety, perception, investment
Single Chart
IPSOS
Saved
A column chart displays the order intake from 2018 to 2021, with a blue gradient. The slide includes red text boxes with bullet points on strategic outlook and future projections.
Sales and Business Development
Industrial & Manufacturing
It displays a positive trend in order intake, with strategic notes on market positioning and future expectations. This is likely used in sales meetings or investor briefings to demonstrate sales momentum and business growth.
Order Intake, Sales Trend, Strategic Outlook, Aerospace, Defense
Mixed Chart
Goldman Sachs
Saved
Slide features a historical comparison using column chart in gray and purple, showing the workload impact of technology on underwriters.
Human Resources and Talent Management
Financial Services
Shows the trend of technology impact on underwriters' workload from 2008 to 2021, with comparative analysis.
workload, trends, technology, underwriters, comparison
Mixed Chart
Accenture
Saved
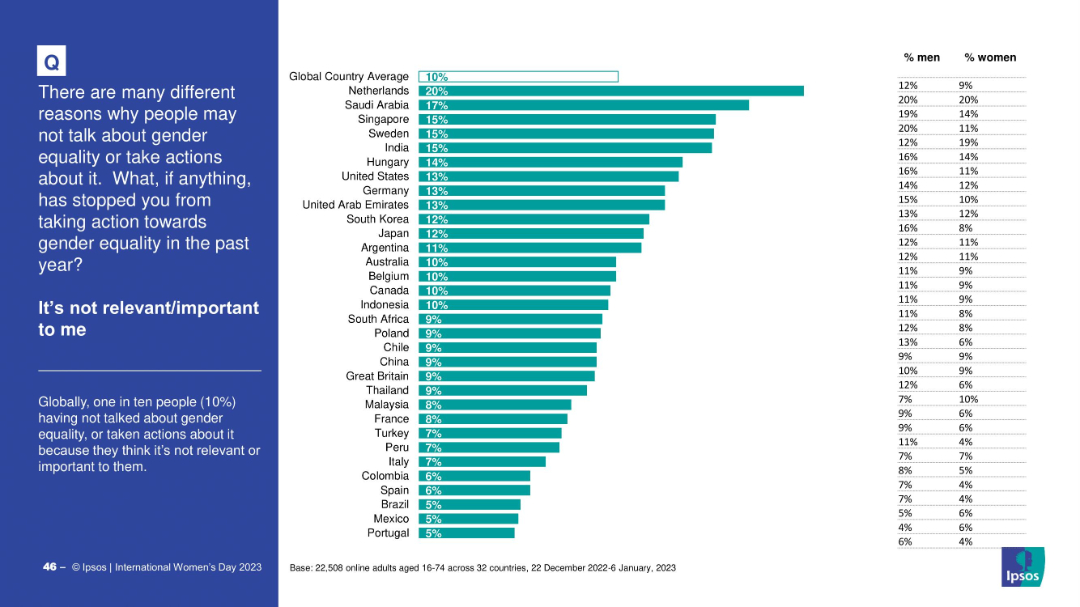
Bar chart with horizontal bars ranked by country, placed on a clean white background; explanatory text and title in a blue left-hand panel.
Market Analysis and Trends
Government & Public Sector
The slide visualizes the percentage of people in different countries who did not act on gender equality because they felt it was not relevant to them. The global average is 10%, with country-specific breakdowns and gender splits on the right side.
gender equality, relevance, global average, country comparison, survey, Ipsos, men vs women, attitudes, public opinion
Mixed Chart
IPSOS
Saved
Contains a column chart comparing the importance of future food priorities to businesses and the applications companies are working on, such as plant-based proteins and conservation.
Strategic Planning
Agriculture & Food Production
Explores corporate strategies towards future food trends, revealing that most companies prioritize sustainable practices but recognize a need for capabilities improvement. It also highlights areas like conservation and plant-based innovations.
future food trends, sustainability, corporate strategies, priorities
Mixed Chart
Deloitte
Saved
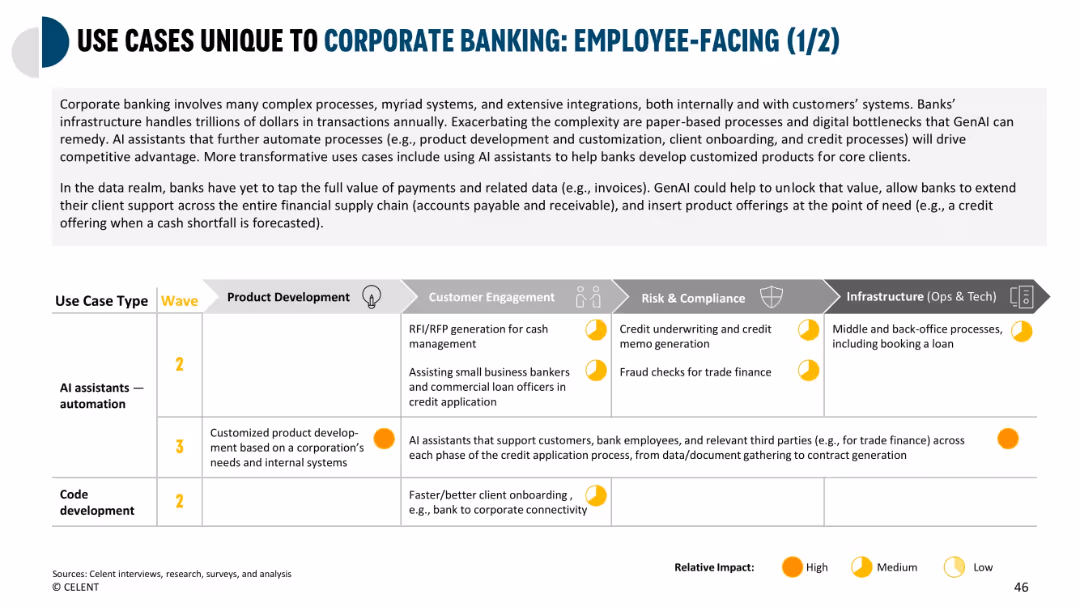
Large grid format categorizing corporate use cases by department, wave, and impact level.
Product and Service Analysis
Financial Services
Explores how GenAI can be used in corporate banking for product development, onboarding, and credit underwriting. Emphasizes the value in automating RFP responses and customizing offerings based on business needs.
corporate banking, GenAI, product development, onboarding, underwriting, credit processing
Mixed Chart
Oliver Wyman
Saved
The slide has two line charts. The first chart shows Tier 1 risk-based capital ratios by bank asset size from 1996 to 2023. The second chart depicts primary market sources of financing for broadly syndicated loans from 1999 to 2022.
Market Analysis and Trends
Financial Services
This slide provides an analysis of U.S. bank capital ratios and the sources of financing for syndicated loans, giving insights into the stability and funding sources in the credit market.
banks, credit market, capital ratios, syndicated loans, U.S. market
Multiple Chart
JP Morgan
Saved
Features a three-part diagram in shades of purple, each part highlighting a different social impact goal (access to finance, save money, reduce debt).
Operational Efficiency
Financial Services
This slide presents Experian's mission to leverage its platform to provide social benefits, detailing goals to improve financial access, save money for consumers, and reduce debt among US consumers.
social good, financial access, consumer savings, debt reduction, Experian
Pillar
Barclays
Saved
The slide shows column charts, bar graphs, and numerical key performance indicators. The design is streamlined with clear visual separation of sections.
Financial Performance
Financial Services
A comprehensive review of the digital financial services in Indonesia, including payment solutions and investment platforms, aimed at financial analysts or investors interested in the fintech sector.
financial services, Indonesia, fintech, investments, digital payments
Multiple Chart
Bain
Saved
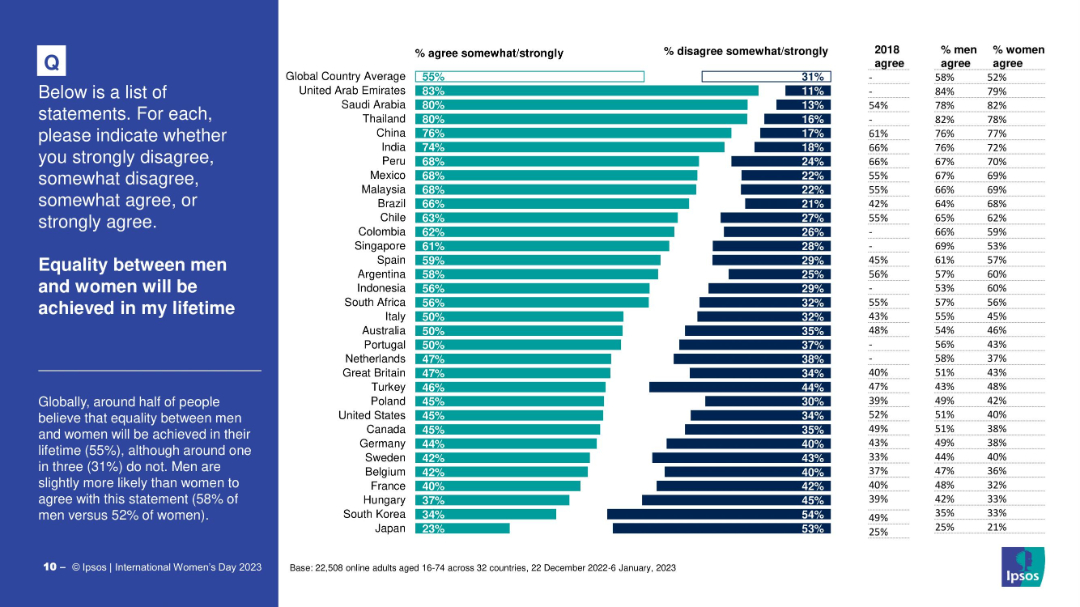
Country-ranked bar chart of % agreeing; includes gender breakdown and historical context.
Human Resources and Talent Management
Government & Public Sector
Depicts belief levels by country on achieving gender equality within one’s lifetime; men generally express more optimism than women.
gender equality timeline, optimism, future vision, gender differences, international comparison, Ipsos
Mixed Chart
IPSOS
Saved
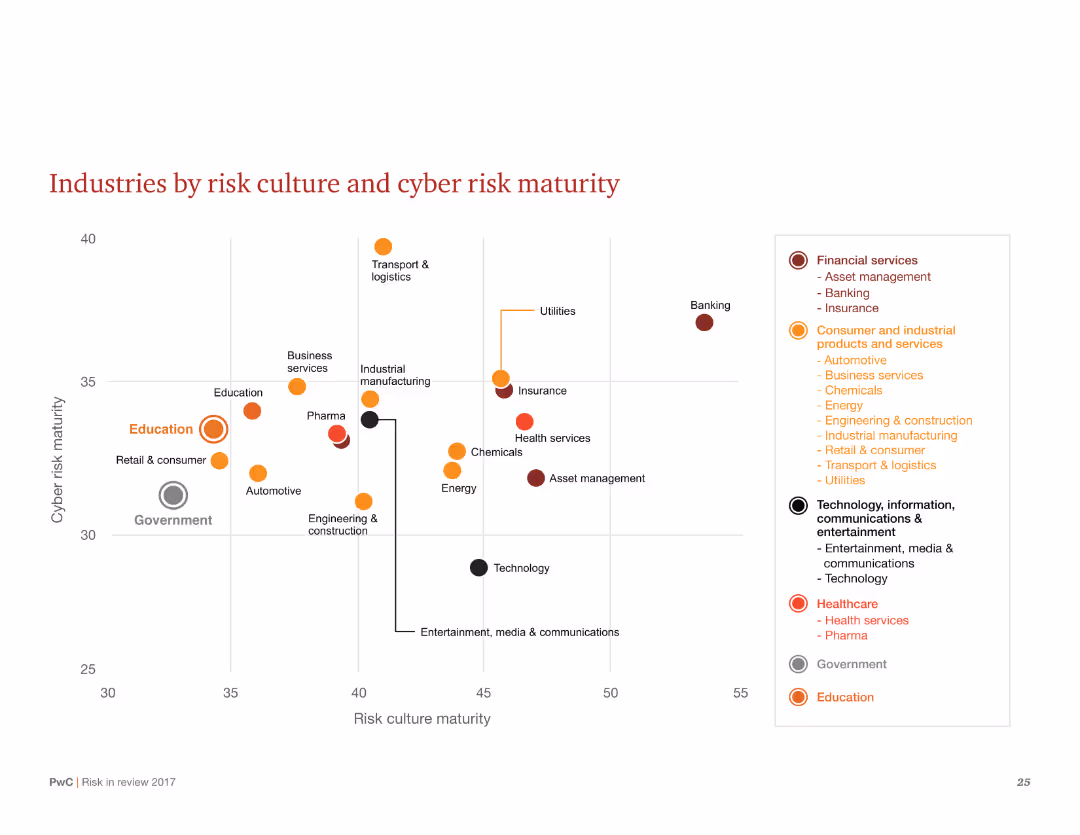
A scatter plot showing industries by their risk culture and cyber risk maturity, with different industry sectors marked on the chart.
Market Analysis and Trends
Financial Services
Visualizes the relationship between risk culture and cyber risk maturity across various industries. Highlights sectors like financial services and education in terms of their maturity levels.
Risk culture, cyber risk, maturity, scatter plot, industries, sectors, financial services, education, chart
Single Chart
PwC/Strategy&
Saved
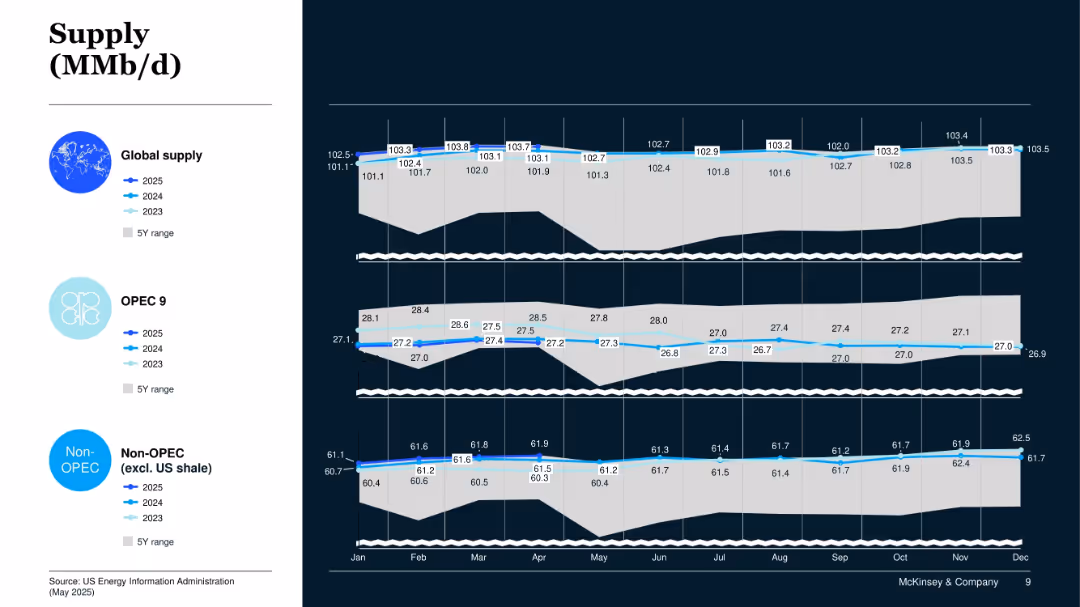
Three-panel line chart showing 2023–2025 global oil supply by global total, OPEC 9, and Non-OPEC; includes 5Y range.
Operational Efficiency
Energy & Utilities
This slide tracks supply trends from 2023 to 2025, focusing on global, OPEC 9, and Non-OPEC sources. It shows moderate growth in global output driven mainly by Non-OPEC sources.
Global Oil Supply, OPEC, Non-OPEC, Supply Trends, Production Forecast
Mixed Chart
McKinsey
Saved
Two sets of complex visual data represented by column and line graphs are displayed side by side for 'Branded Cards' and 'Retail Services'. The graphs detail normalized NCL rates, 90+ DPD rates, NCL, ACLL Balance, and ACLL/EOP Loans, providing a comprehensive overview of credit trends over time.
Financial Performance
Financial Services
The slide compares the credit performance and trends for branded cards with retail services, highlighting key financial indicators such as past due rates and credit losses. Intended for financial analysis and risk assessment, it is crucial for professionals in the financial services industry.
Credit Trends, Branded Cards, Retail Services, Financial Analysis, Risk Management, NCL Rate, Past Due, ACLL, EOP Loans, Financial Services
Multiple Chart
Citigroup
Saved
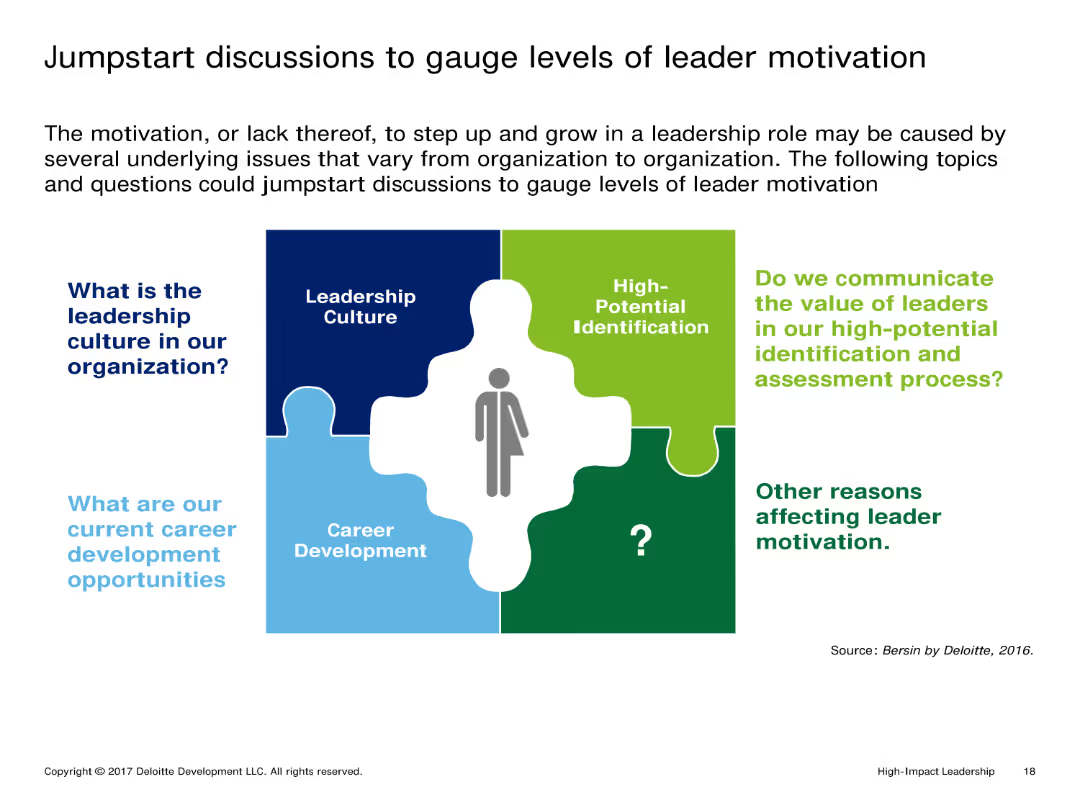
The slide uses a puzzle piece layout, with each piece representing different aspects of leader motivation. There is a mix of text and icons, with a person icon in the center linking the components together.
Market Analysis and Trends
Professional Services
It discusses various factors affecting leader motivation, including leadership culture, career development opportunities, and the value communicated to leaders in high-potential identification and assessment processes.
Leadership, Motivation, Career Development, Culture, Assessment
Diagram
Deloitte
Saved
Compares AR and VR technologies, discussing current status and future requirements.
Technology and Digital Transformation
Technology & Software
Evaluates AR and VR's current technological capabilities and the significant advancements needed for widespread adoption.
augmented reality, virtual reality, technology development, immersive experience, industry application
Boxed
McKinsey
Saved
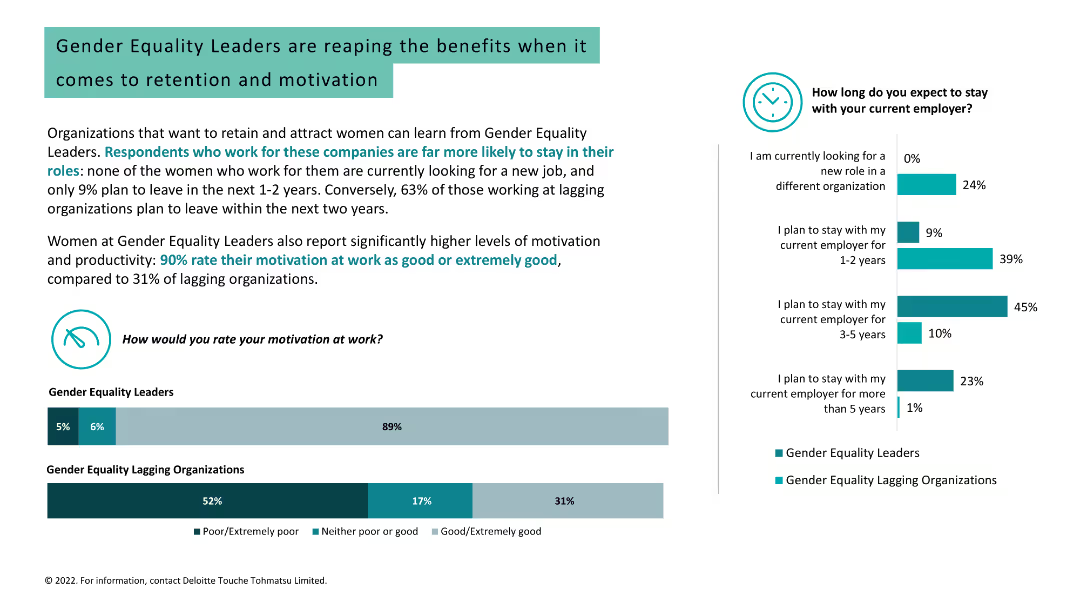
Column charts, text, and image. Data on motivation, retention, and job search intentions among women in gender equality leader vs. lagging organizations.
Human Resources and Talent Management
Professional Services
Highlights the higher retention and motivation levels among women working for gender equality leaders compared to lagging organizations.
gender equality, retention, motivation, job search, women, workplace, leadership, engagement, organization
Multiple Chart
Deloitte
Saved
Features bar charts detailing the frequency of monitoring and reporting structures for digital transformation efforts.
Strategic Planning
Technology & Software
Highlights the significant role of executive leadership, especially CEOs, in overseeing digital transformation efforts.
digital transformation, leadership, CEO involvement, monitoring, reporting
Multiple Chart
BCG
Saved
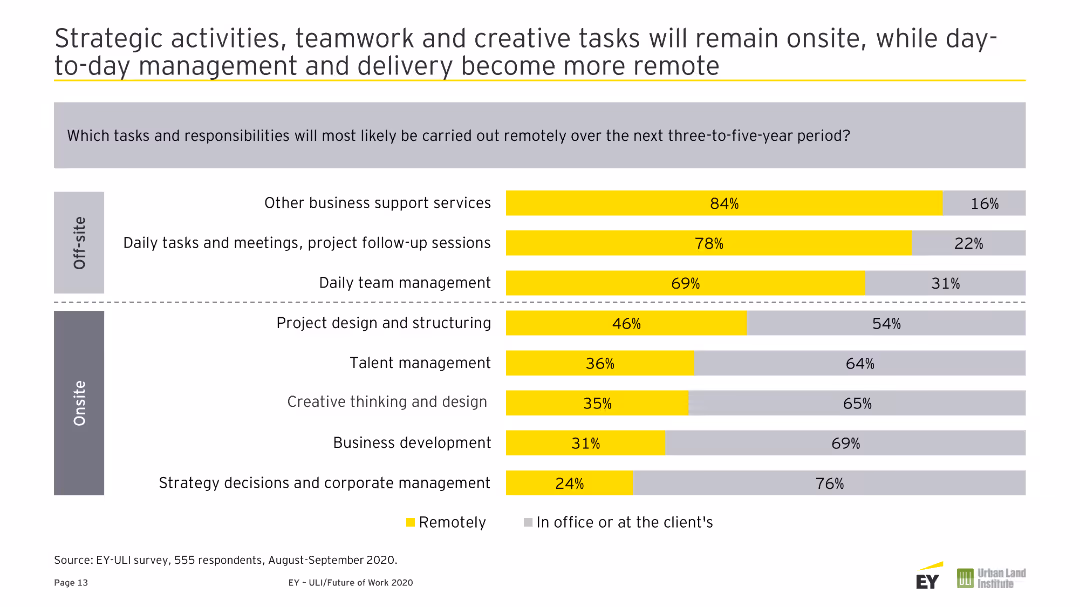
Column chart depicting potential benefits from the Future of Work. The right side of the slide contains two text quotes in gray boxes. Colors are primarily yellow and gray.
Strategic Planning
Real Estate & Construction
Highlights the top 5 benefits of the Future of Work, including increased work flexibility, reduced commuting, and better workplace environments.
Agility, Flexibility, Work, Corporate, Office, Real Estate, Environment, Commuting, Costs, Savings
Single Chart
EY
Saved
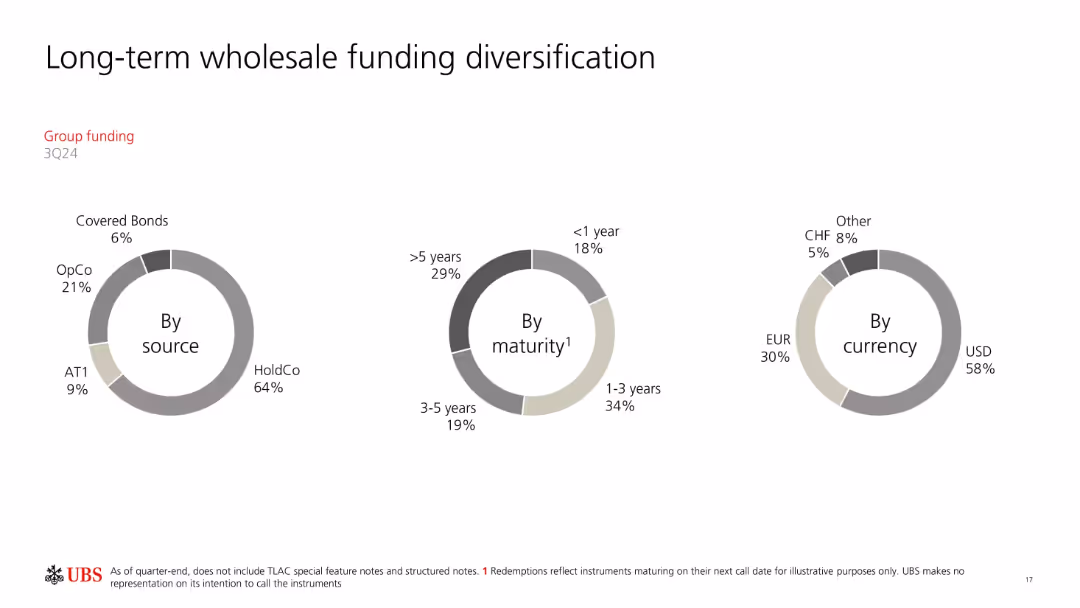
Three donut charts categorizing funding by source, maturity, and currency.
Investment Analysis
Financial Services
Displays the diversification of UBS’s long-term wholesale funding portfolio. Categorizes by instrument type (e.g., HoldCo, OpCo), maturity periods, and currency mix. Emphasizes UBS's broad funding base and balanced risk structure.
funding diversification, maturity, currency mix, UBS, wholesale funding
Single Chart
UBS
Saved
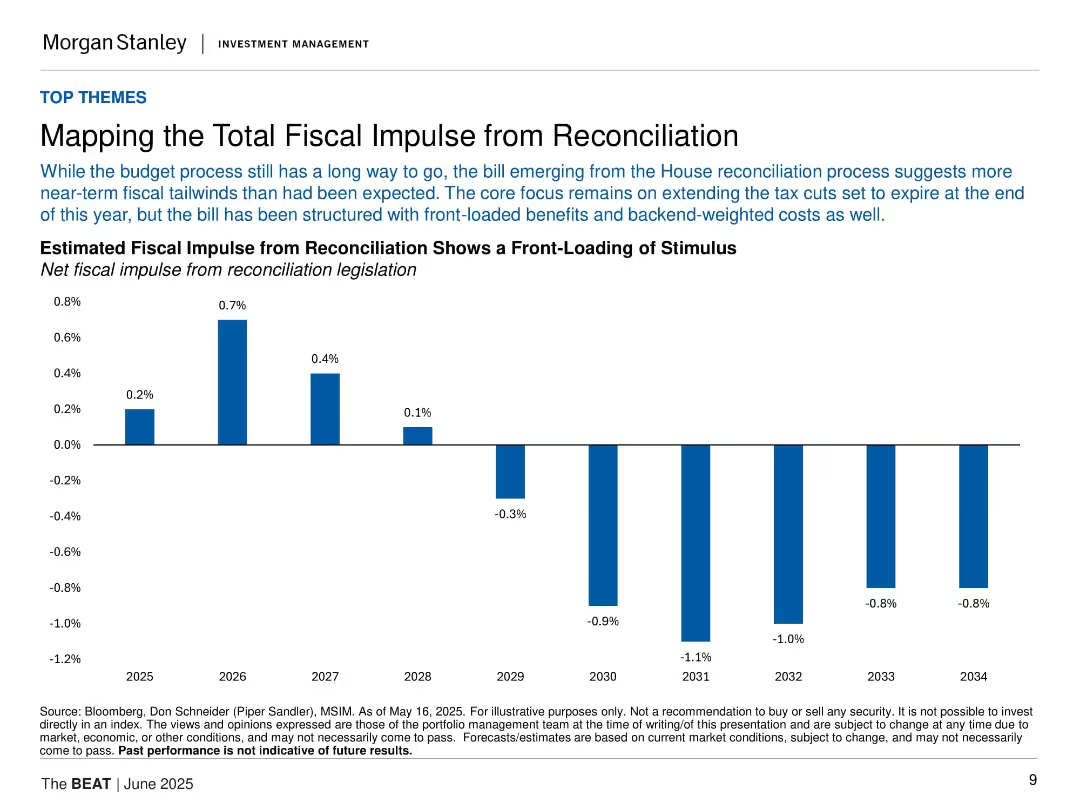
Bar chart showing net fiscal impulse from 2025 to 2034; structured in a clean layout with text above the graph.
Market Analysis and Trends
Financial Services
This slide outlines the projected fiscal impact of House reconciliation legislation, highlighting a front-loading of stimulus in the early years followed by fiscal tightening. A bar chart displays the impulse by year from 2025–2034.
fiscal impulse, reconciliation, budget, stimulus, taxes, 2025–2034, macroeconomics, House bill, Morgan Stanley, projections
Single Chart
Morgan Stanley
Saved
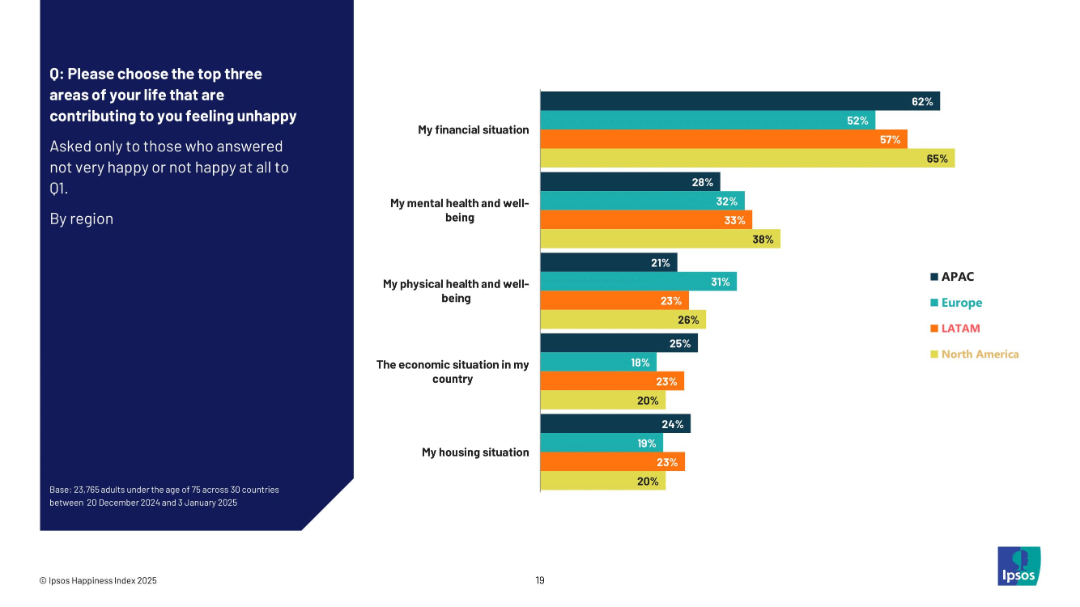
Similar split layout as 18941. Left side has question text, right side presents a horizontal bar chart showing top factors for unhappiness by region.
Market Analysis and Trends
Professional Services
This slide displays insights from respondents who reported feeling unhappy, identifying the most influential areas contributing to this state. Financial situation is the top concern globally, followed by mental and physical well-being. Regional breakdowns highlight differences in how these areas affect overall unhappiness.
unhappiness, mental health, financial situation, regional data, survey insights, public opinion, well-being
Mixed Chart
IPSOS
Saved
Previous
Next
If nothing, comes up, please save your slides first
Create a FREE account to continue browsing
Receive Instant Access to 1,000+ slides from companies like McKinsey, Google, and Goldman Sachs
First Name
Last Name
Email
Password
I agree to all
Terms & Privacy Policy
Thank you! Your submission has been received!
Oops! Something went wrong while submitting the form.
Have an account?
Sign in
Column Chart
Heatmap
Chevron
Org Chart
Infographic
Callouts
Timeline
List
Graphic
Picture
Process Flow
Diagram
Paragraph
Map
Table
Framework
Subtitle
Takeaway Box
Icon
Other Chart
Radar Chart
Waterfall Chart
Mekko Chart
Pie Chart
Scatter Plot
Line Chart
Bar chart
Bullet points