My Account
My Slides
Search by Category
Templates
Leave Feedback
Login
Logout
Get Started
Browse all Slides
Browse all Slides
Create a FREE Account
Instant access to 1,000+ real slides from top companies like McKinsey, BCG, Goldman Sachs, Google and many more!
First Name
Last Name
Email
Password
I agree to all
Terms & Privacy Policy
Thank you! Your submission has been received!
Oops! Something went wrong while submitting the form.
Have an account?
Sign in
Saved Slides
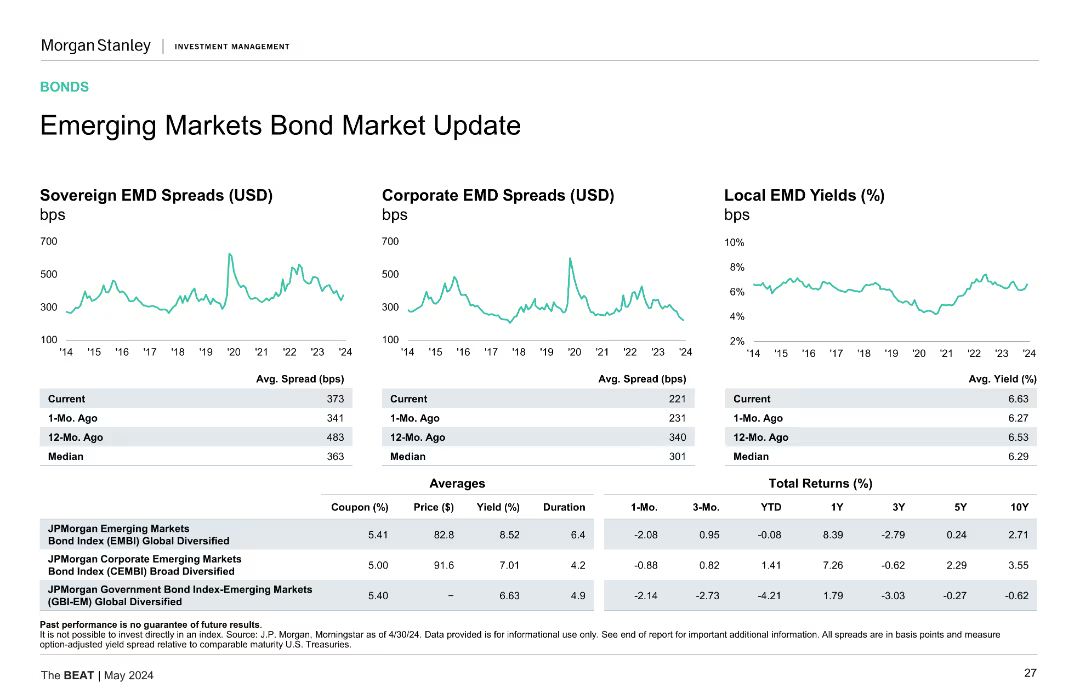
This slide features three line charts showing Sovereign EMD Spreads (USD), Corporate EMD Spreads (USD), and Local EMD Yields (%). The charts display data from 2014 to 2024, with tables providing current, 1-Mo. Ago, 12-Mo. Ago, and Median values. Additionally, there are tables showing coupon, price, yield, duration, and total returns.
Market Analysis and Trends
Financial Services
The slide provides an overview of the emerging markets bond market, highlighting sovereign and corporate EMD spreads, local EMD yields, and total returns.
Emerging markets, bond spreads, EMD, yields, returns, sovereign, corporate
Multiple Chart
Morgan Stanley
Saved
Slide contains a bar chart showing hydrogen production costs over time comparing grey, blue, and green hydrogen.
Investment Analysis
Energy & Utilities
Analyzes cost trends in hydrogen production, emphasizing the economic shift towards green hydrogen as a viable future investment in energy.
hydrogen, green energy, cost trends, investment analysis, energy sector
Linear Flow
McKinsey
Saved
Includes pie charts and a stacked bar chart, presenting survey data about C-level executives. Visual elements are clearly structured with labels and percentages.
Market Analysis and Trends
Professional Services
Describes the methodology of a survey conducted among C-level executives from various industries, focusing on the number of employees, revenue, and job titles within surveyed companies.
survey methodology, C-level executives, industry distribution, company size, revenue analysis
Multiple Chart
Deloitte
Saved
Features an individual making adjustments to machinery, symbolizing proactive engagement. Includes statistics about public DEI commitments and funding.
Regulatory and Compliance
Professional Services
Highlights recent trends in DEI commitments among multinational companies and the importance of integrating DEI into business practices.
DEI, commitments, funding, multinational companies, business practices, equity
Multiple Chart
Deloitte
Saved
The slide displays multiple line graphs with color-coded lines representing different countries.
Strategic Planning
Healthcare & Pharmaceuticals
This slide compares COVID-19 case trends in various countries, categorized into groups like 'Continuation' and 'Crush and contain', useful for analyzing pandemic responses.
COVID-19, cases, trends, countries, graphs
Multiple Chart
BCG
Saved
Features a pie chart of market opportunities and a column chart showing annual revenue run rate by business vertical.
Market Analysis and Trends
Financial Services
Details the company's new business verticals in North America, focusing on the financial potential and strategic importance of each sector, from insurance to personal loans, highlighting both current investments and future opportunities.
business lines, market opportunity, investment, revenue, strategic planning
Multiple Chart
Barclays
Saved
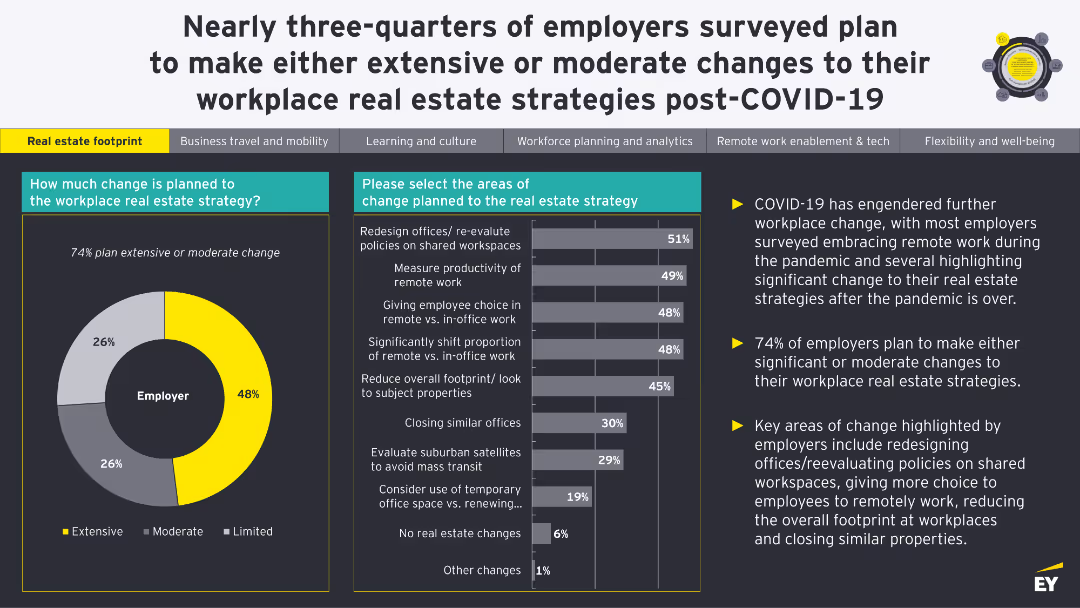
The slide includes bar charts and pie charts depicting changes in business travel and mobility plans post-COVID-19, highlighting employee preferences and employer strategies.
Market Analysis and Trends
Transportation & Logistics
The slide focuses on changes in business travel and mobility post-COVID-19, showing how employee travel frequency and preferences have shifted, and detailing employer plans to adapt to these changes.
business travel, mobility, COVID-19, changes, strategies
Multiple Chart
EY
Saved
This slide contains column charts showing potential future revenue increases from digital marketing, contrasting current and potential impacts. The layout is clear with direct comparisons highlighted.
Financial Performance
Media & Entertainment
Discusses the revenue impact of digital marketing on brands at different maturity levels, suggesting that more mature brands anticipate higher revenue increases. This slide is crucial for financial planning and strategic decision-making in digital marketing investments.
digital marketing, revenue impact, maturity levels, financial planning, strategic decision-making, column chart, revenue increases, investment planning
Multiple Chart
BCG
Saved
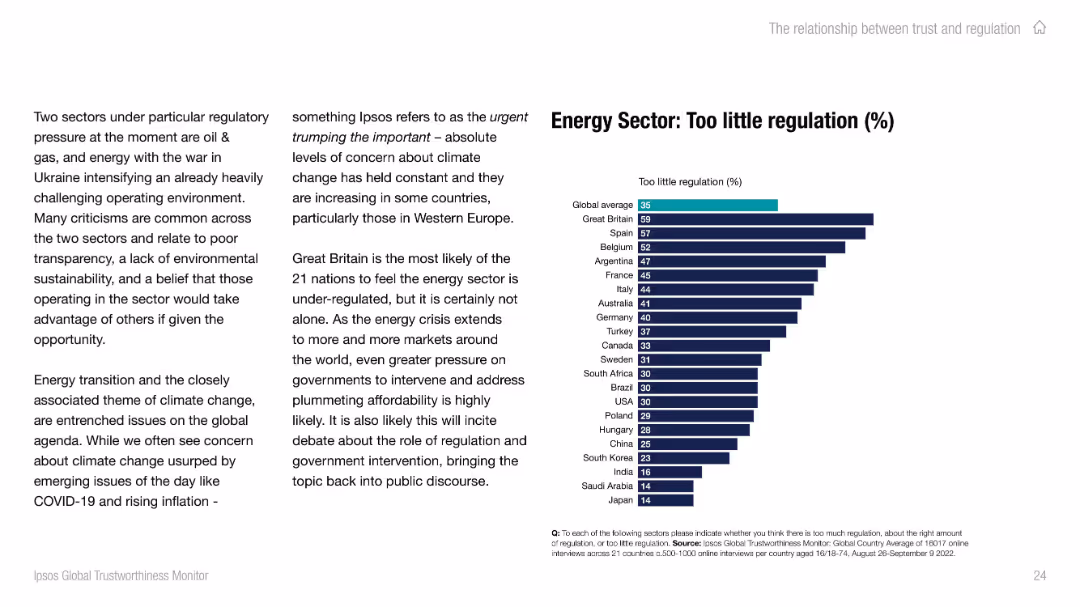
Split slide layout; left side contains paragraph text, right side features a horizontal bar chart comparing "Too little regulation (%)" by country with bold headings and teal/navy color scheme.
Regulatory and Compliance
Energy & Utilities
The slide highlights global perceptions of under-regulation in the energy sector, emphasizing the impact of climate concerns and geopolitical issues. A chart shows country-specific sentiment, with the UK having the highest concern and Japan the least.
regulation, energy, trust, climate, public opinion, global, Ipsos, chart, UK, Western Europe
Mixed Chart
IPSOS
Saved
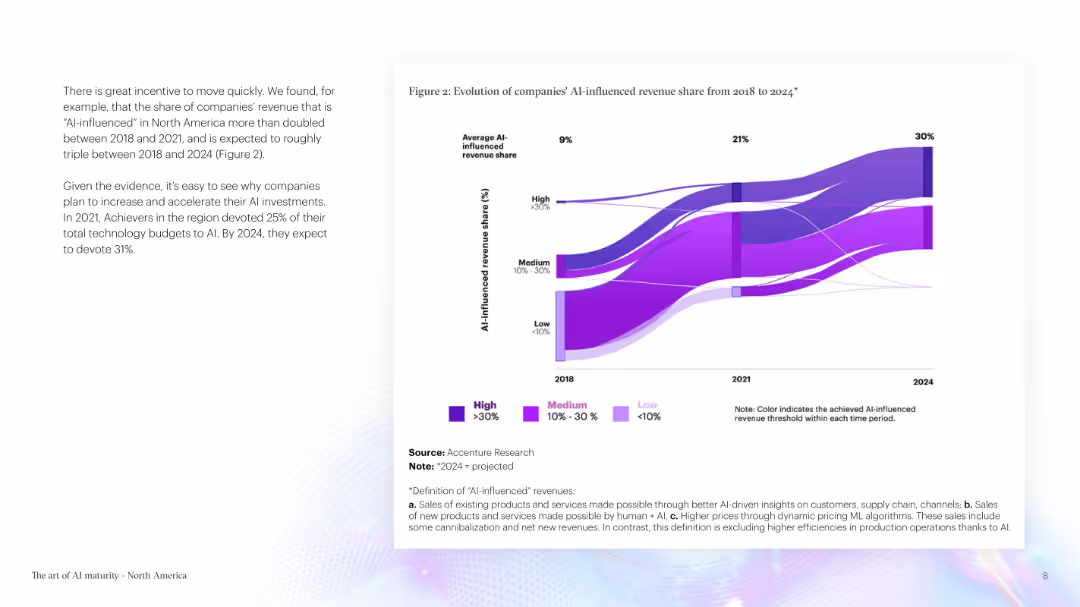
The slide includes text and a flow chart displaying the evolution of AI-influenced revenue share. The color scheme is purple and white.
Technology and Digital Transformation
Technology & Software
The slide highlights the increasing influence of AI on company revenue, presenting projected data on AI investments and their expected impact by 2024.
AI Revenue, AI Influence, Technology Investment, Projected Data, Revenue Growth, Technology
Mixed Chart
Accenture
Saved
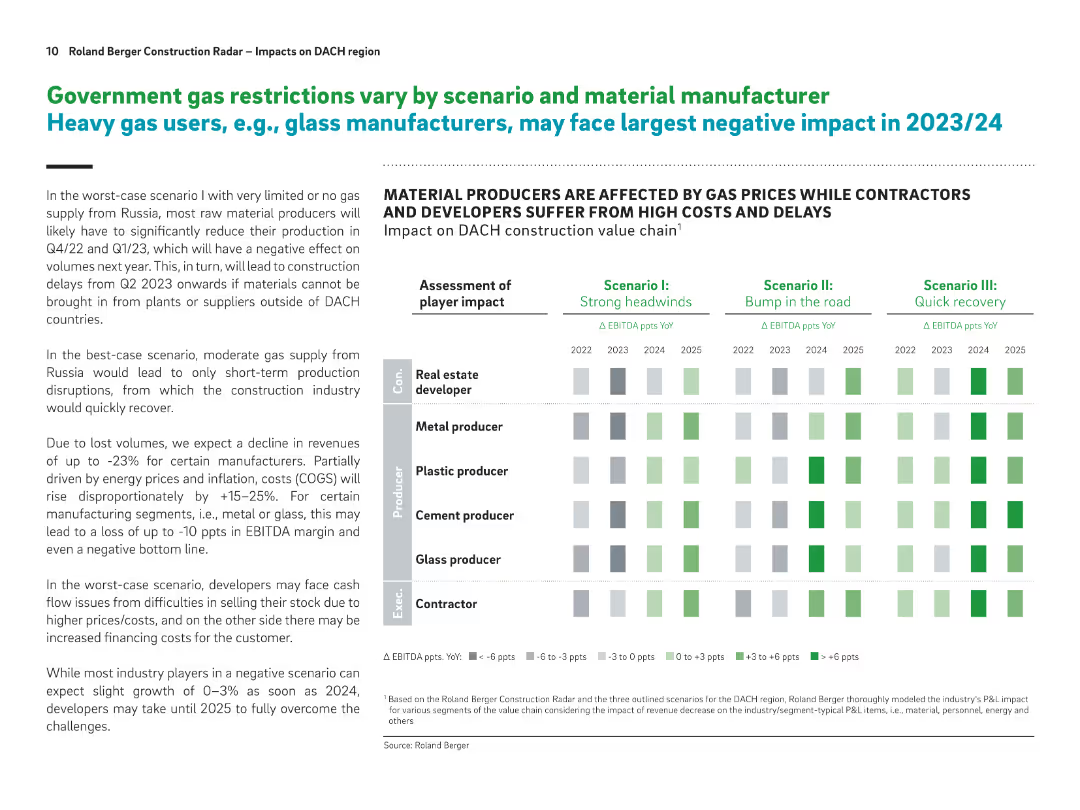
Split layout with text on the left and a heatmap-style matrix on the right. Uses bold headers, shaded boxes, and a structured grid to show impacts across scenarios.
Risk Assessment and Management
Industrial & Manufacturing
This slide assesses the impact of gas supply restrictions on various construction-related industries, focusing on how material manufacturers and developers will be affected under different scenarios. It presents EBITDA impacts across years and scenarios, indicating heavy losses for glass and metal producers in worst-case scenarios.
gas supply, EBITDA impact, construction, scenario planning, raw materials, manufacturing, cost pressures, DACH, delays, recovery
Table
Roland Berger
Saved
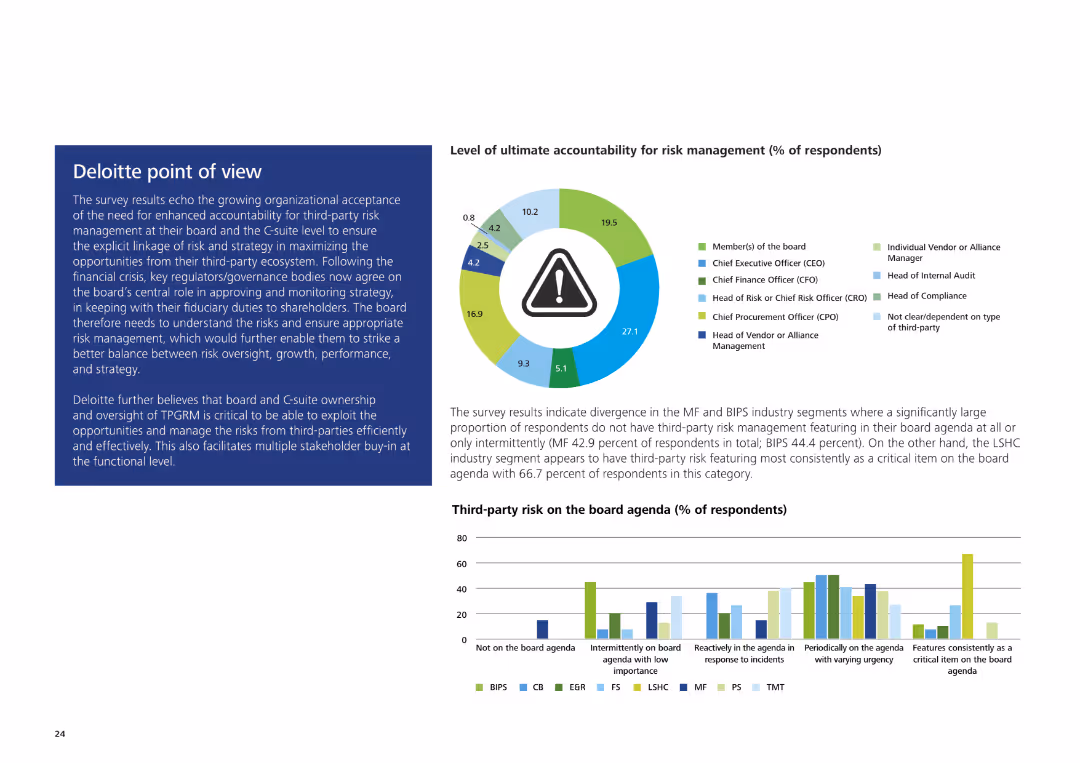
The slide includes a pie chart showing levels of ultimate accountability for risk management and a text box with Deloitte's analysis on the right.
Strategic Planning
Professional Services
The slide discusses survey results about organizational acceptance of third-party risk management accountability at the board and C-suite levels, emphasizing strategic opportunities.
Third-party risk management, accountability, Deloitte, board level, C-suite, strategic opportunities
Multiple Chart
Deloitte
Saved
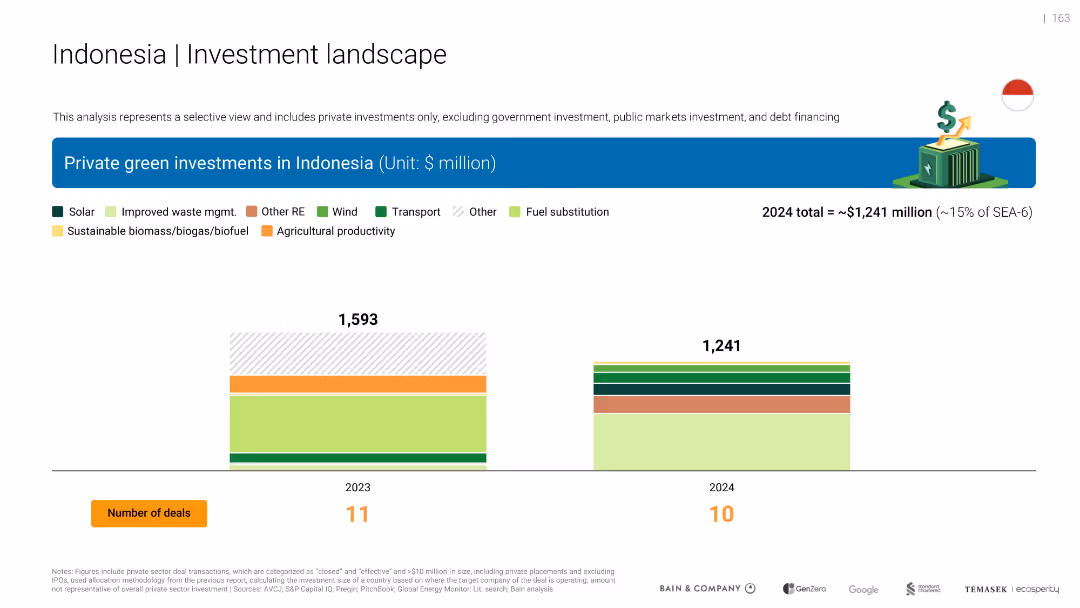
Bar chart showing investment breakdown by sector and year; legend for types of investment (solar, wind, etc.)
Financial Performance
Environmental Services & Sustainability
Displays Indonesia's private green investment by type from 2023 to 2024. Investments dropped by ~22%, with fewer deals and significant drop in waste management and fuel substitution.
Investment, fuel substitution
Single Chart
Bain
Saved
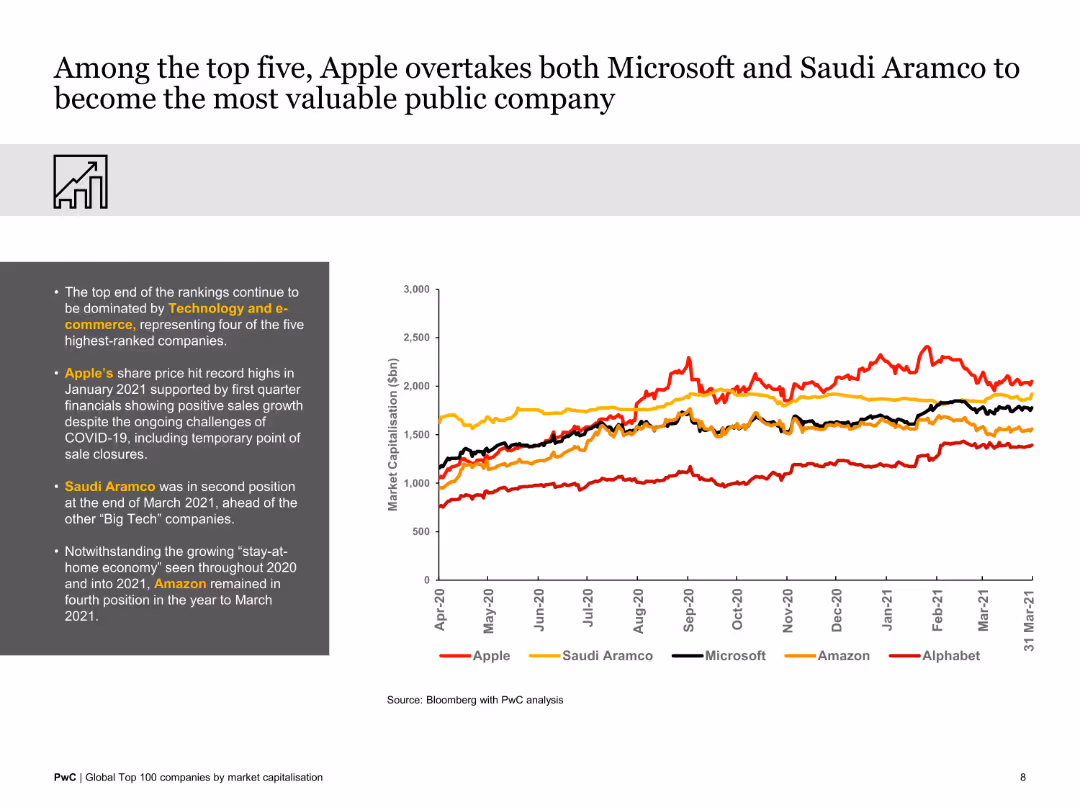
The slide features a line graph comparing the market capitalizations of top tech companies over a year. The visual is clean and focused on trends among the top five companies.
Market Analysis and Trends
Technology & Software
This slide illustrates how Apple surpassed Microsoft and Saudi Aramco to become the most valuable public company, highlighting trends from April 2020 to March 2021.
Apple, Microsoft, Saudi Aramco, market value, tech companies, 2020-2021, comparative analysis
Mixed Chart
PwC/Strategy&
Saved
Split layout with bar chart on left, text explanation in center-right, image of businesspeople top-right, and sidebar navigation on right
Strategic Planning
Professional Services
The slide outlines the top initiatives businesses are taking to address challenges such as cost reduction, revenue growth, and cash management. A bar chart shows frequency of actions like changing management, equity raise, and debt restructuring. Survey insights and expert commentary are included.
cost reduction, revenue growth, cash management, survey, business strategy, equity raise, restructuring, turnaround, corporate response, insights
Mixed Chart
Alvarez & Marsal
Saved
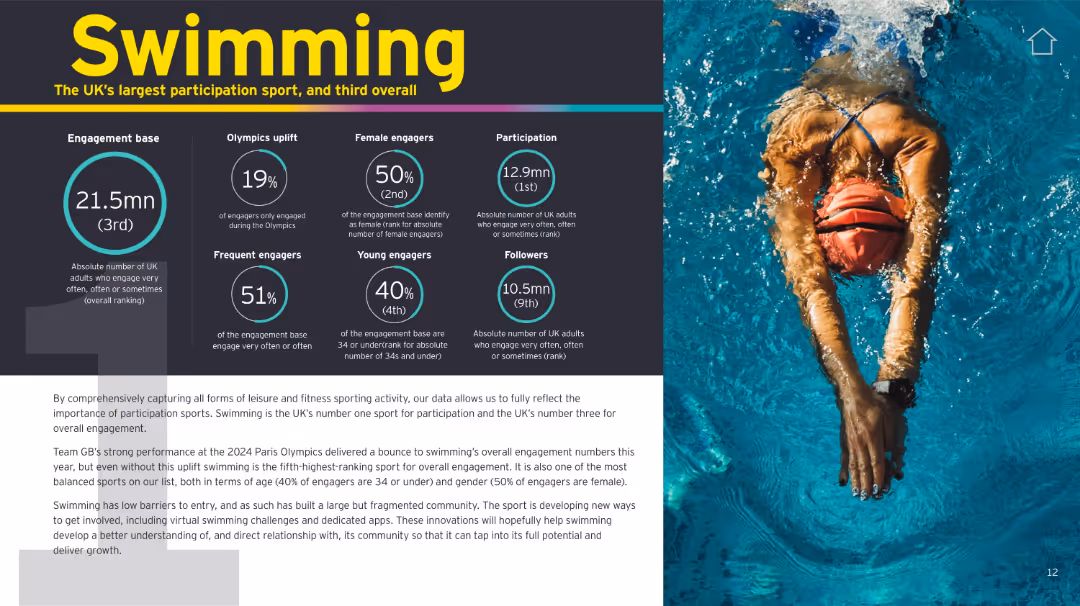
Split-screen: Left has infographics and text summary, right has a large action photo. Black, teal, and white theme.
Customer and Market Segmentation
Media & Entertainment
Swimming is highlighted as the UK’s top participation sport and third in overall engagement, with strong gender and youth representation. The slide also emphasizes its Olympic impact and future growth opportunities.
swimming, participation, gender balance, Olympics, youth, engagement, UK sports
Mixed Chart
EY
Saved
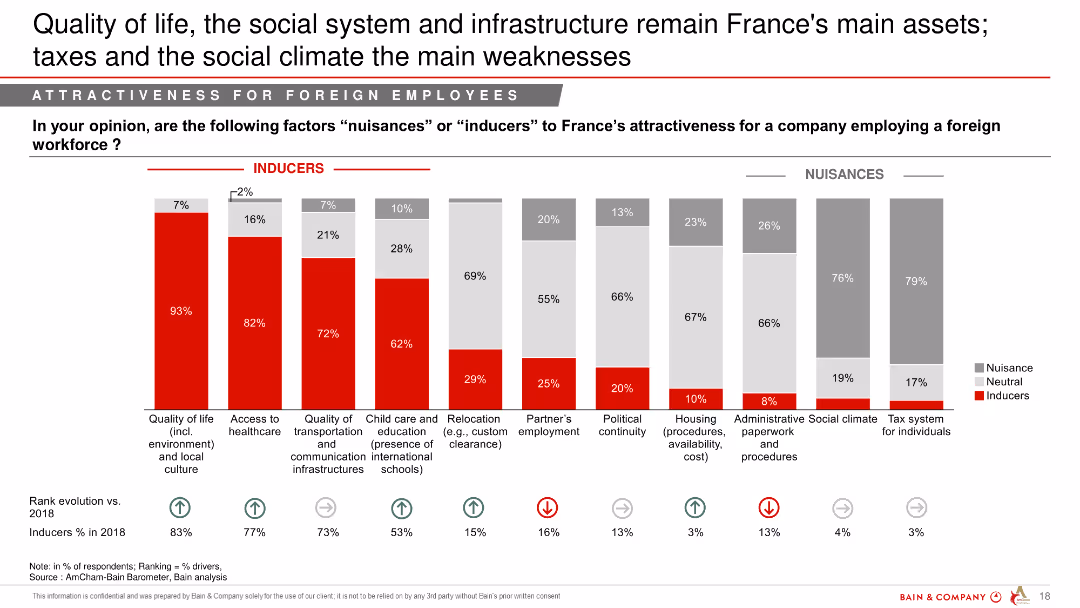
Column chart showing factors considered as "Inducers" or "Nuisances" by foreign employees regarding France's attractiveness for a foreign workforce.
Market Analysis and Trends
Professional Services
This slide analyzes the factors that make France attractive or unattractive to foreign employees, emphasizing quality of life and infrastructure as strengths, and taxes as weaknesses.
quality of life, social system, infrastructure, attractiveness, foreign workforce, taxes
Single Chart
Bain
Saved
The slide includes detailed financial data presented as table and a list. Blue highlights draw attention to positive figures, and gray to negative ones. A side panel adds context with bullet points summarizing base fees, performance fees, and other financial insights.
Financial Performance
Financial Services
Summarizes the financial results of Macquarie Asset Management, including base and performance fees, and provides an analysis of net operating income and equity under management, pertinent for financial review and strategy planning.
asset management, financial results, base fees, performance fees, operating income, equity management
Table
Goldman Sachs
Saved
This slide includes checklists, a circular flow diagram in the center with three labeled points, and a bar chart listing types of risks on the right. It is visually balanced with elements well-distributed across the slide.
Risk Assessment and Management
Financial Services
The slide outlines the risk management framework, emphasizing the firm's approach through a culture of risk management, process and structural oversight, and continuous improvement. A list details various types of risks such as market, credit, and operational risks. Suitable for a presentation on corporate governance or risk management strategies.
Risk Management, Governance, Framework, Corporate, Oversight, Improvement, Analysis
Linear Flow
Goldman Sachs
Saved
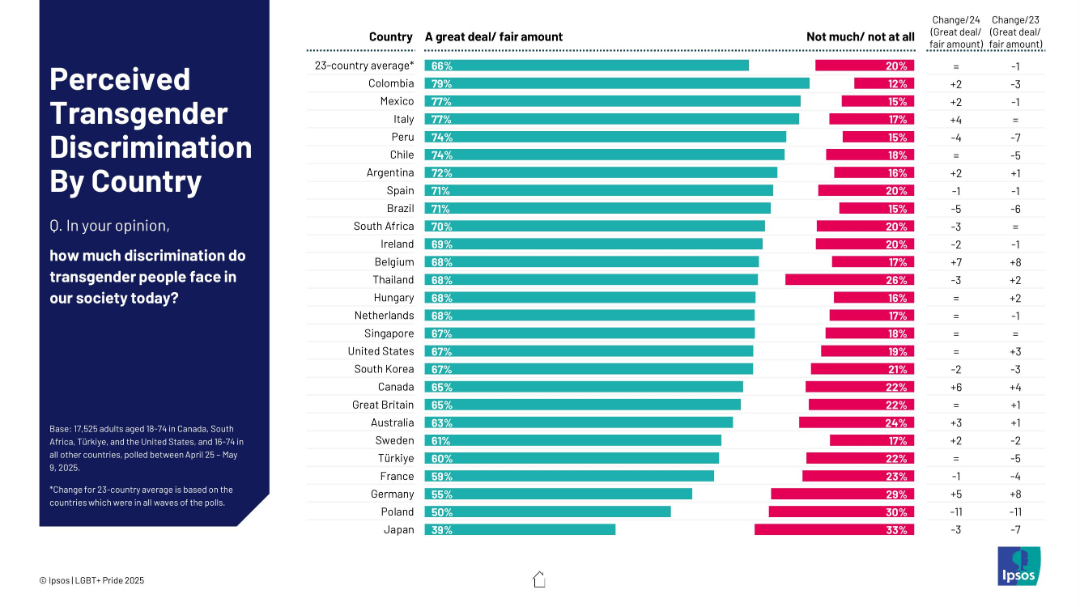
Bar chart showing perceived level of discrimination ("great deal/fair amount")
Risk Assessment and Management
Government & Public Sector
The slide reports public perceptions of transgender discrimination by country. Colombia, Mexico, and Italy top the list with the highest perceived levels. The slide also includes change data, indicating whether perceptions have risen or fallen in recent years.
perceived discrimination, transgender, global survey, public opinion, social risks, Ipsos, comparison
Mixed Chart
IPSOS
Saved
Showcases column charts comparing the capabilities of industry leaders against their peers, with a focus on resilience, optimism, and performance metrics during uncertainties.
Investment Analysis
Financial Services
Highlights how companies with strong resilience capabilities tend to outperform their industry peers in terms of total shareholder returns and operational effectiveness, particularly in times of macroeconomic challenges.
resilience, industry comparison, shareholder returns, macroeconomic challenges
Multiple Chart
BCG
Saved
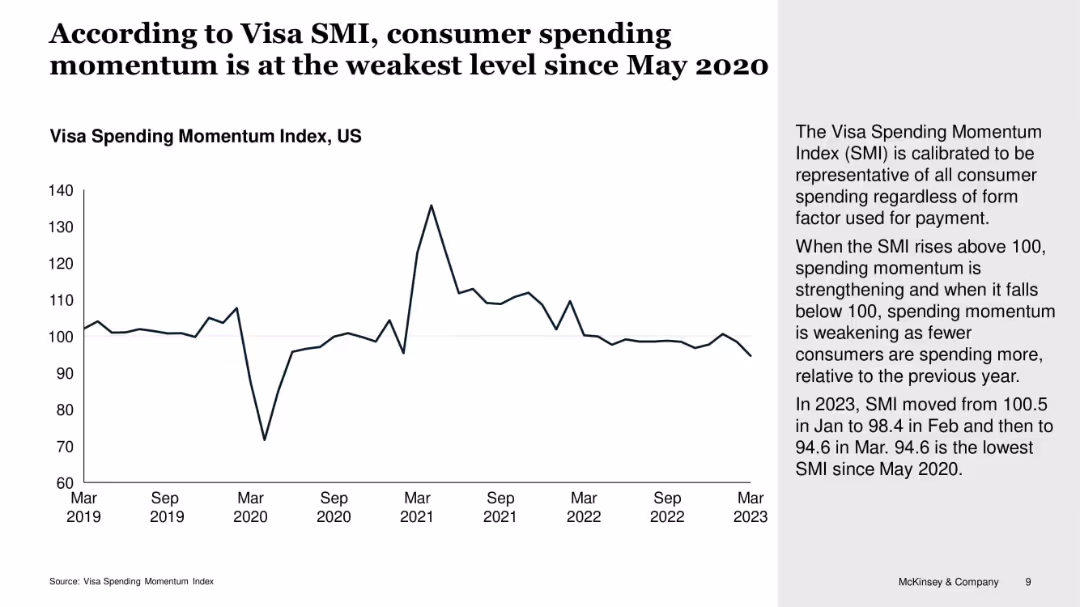
Line chart showing Visa Spending Momentum Index (SMI) from 2019–2023 with side commentary
Market Analysis and Trends
Financial Services
This slide focuses on the Visa Spending Momentum Index (SMI), showing a decline in early 2023 to its lowest level since May 2020. The drop suggests weakening consumer sentiment and reduced spending activity. SMI values below 100 signal deteriorating momentum in consumer expenditures.
Visa SMI, consumer momentum, spending, decline, sentiment, economic indicator, index
Mixed Chart
McKinsey
Saved
The slide features a column chart showing IWM credit volume in CHF bn across different sectors and key risk metrics like investment grade credit exposure and secured loans. Bullet points provide additional insights into the portfolio composition.
Financial Performance
Financial Services
The slide offers an overview of the credit volume portfolio, highlighting the distribution across various sectors like export finance and real estate. It details risk metrics, emphasizing secured loans and the proportion of investment-grade exposure.
credit volume, portfolio, risk metrics, secured loans, investment grade
Mixed Chart
Credit Suisse
Saved
Two large bar charts comparing revenue and EBIT variations of luxury brands from 2014 to 2017, emphasizing the cost of growth.
Financial Performance
Consumer Goods
Highlights the increasing cost of growth for luxury brands over recent years, using revenue and profit metrics to discuss financial sustainability.
Growth, Cost, Luxury Brands
Multiple Chart
Bain
Saved
Circular diagram with multiple sections around a central concept of remote work, highlighting different aspects like tax compliance, data technology, and workforce strategies.
Strategic Planning
Professional Services
This slide outlines the cross-functional nature of remote work, touching on corporate tax, employment law, data/technology, regulatory considerations, and workforce strategies, emphasizing the need for a coordinated approach.
Remote work, compliance, technology, workforce, strategy
Diagram
Deloitte
Saved
Previous
Next
If nothing, comes up, please save your slides first
Create a FREE account to continue browsing
Receive Instant Access to 1,000+ slides from companies like McKinsey, Google, and Goldman Sachs
First Name
Last Name
Email
Password
I agree to all
Terms & Privacy Policy
Thank you! Your submission has been received!
Oops! Something went wrong while submitting the form.
Have an account?
Sign in
Column Chart
Heatmap
Chevron
Org Chart
Infographic
Callouts
Timeline
List
Graphic
Picture
Process Flow
Diagram
Paragraph
Map
Table
Framework
Subtitle
Takeaway Box
Icon
Other Chart
Radar Chart
Waterfall Chart
Mekko Chart
Pie Chart
Scatter Plot
Line Chart
Bar chart
Bullet points