My Account
My Slides
Search by Category
Templates
Leave Feedback
Login
Logout
Get Started
Browse all Slides
Browse all Slides
Create a FREE Account
Instant access to 1,000+ real slides from top companies like McKinsey, BCG, Goldman Sachs, Google and many more!
First Name
Last Name
Email
Password
I agree to all
Terms & Privacy Policy
Thank you! Your submission has been received!
Oops! Something went wrong while submitting the form.
Have an account?
Sign in
Saved Slides
Presents bar and column charts with financial results and revenues related to asset management, along with detailed textual information on performance metrics and asset under management (AuM) growth.
Financial Performance
Financial Services
This slide focuses on the Q2 2023 financial results for Deutsche Bank's Asset Management division, detailing revenue distribution and highlighting growth in assets under management.
Asset management, financial results, revenue distribution, AuM growth, Deutsche Bank, Q2 2023
Multiple Chart
Deutsche Bank
Saved
This slide juxtaposes text with icons and diagrams. The left side has bullet points, and the right side displays a flowchart of a digital banking platform ecosystem. The use of space is balanced, with the Macquarie logo at the bottom left.
Technology and Digital Transformation
Financial Services
The slide communicates the bank's commitment to technology, detailing cloud migration strategies and data analytics platforms. It highlights key technological advancements within banking services, emphasizing a move towards cloud-based platforms to enhance service delivery and operations.
digital banking, cloud migration, data analytics, technology, platform, services, strategy
Header Vertical
Morgan Stanley
Saved
Features a column chart depicting the deployment of risk-weighted assets (RWA) across various divisions within the bank from 2023 to 2026.
Financial Performance
Financial Services
This slide shows the strategic allocation of approximately £30 billion in risk-weighted assets across different banking divisions to bolster market presence and share, particularly focusing on competitive pricing and enhanced decision-making. Essential for understanding strategic financial allocation.
RWA, Allocation, Banking, Market Share, Strategy
Mixed Chart
Barclays
Saved
Contains a column chart showing percentages for three years under categories such as 'significantly more attention' to 'significantly less attention' regarding employee focus on financial benefits, with an emphasis on the increase since 2022.
Performance Metrics and KPIs
Financial Services
Analyzes the trends of employee attention to financial benefits over the years, with a focus on the increased attention in the recent year, useful for gauging employee priorities.
Financial Benefits, Employee Attention, Trend Analysis, Year-over-Year, Bar Graph
Single Chart
Goldman Sachs
Saved
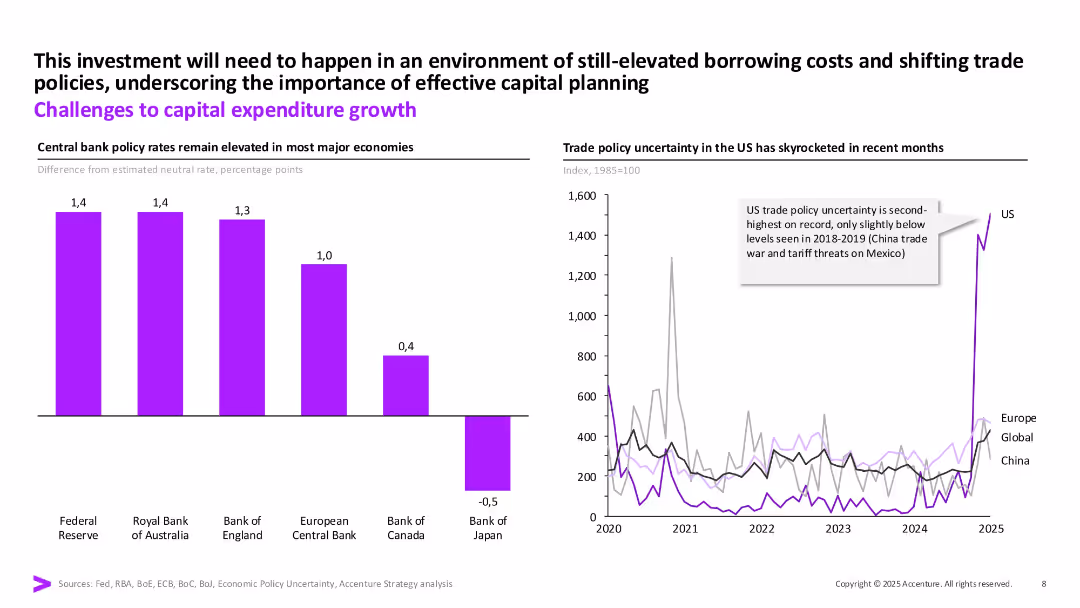
Two-part layout: bar chart of interest rates on left and line graph on right showing trade policy uncertainty. Use of purple for main metrics and annotation callouts.
Risk Assessment and Management
Financial Services
Highlights challenges to capex, including elevated central bank rates and increased trade policy uncertainty (especially in the US). Shows both monetary and geopolitical risks impacting capital planning.
capex, policy rates, risk, trade policy, investment, borrowing costs
Multiple Chart
Accenture
Saved
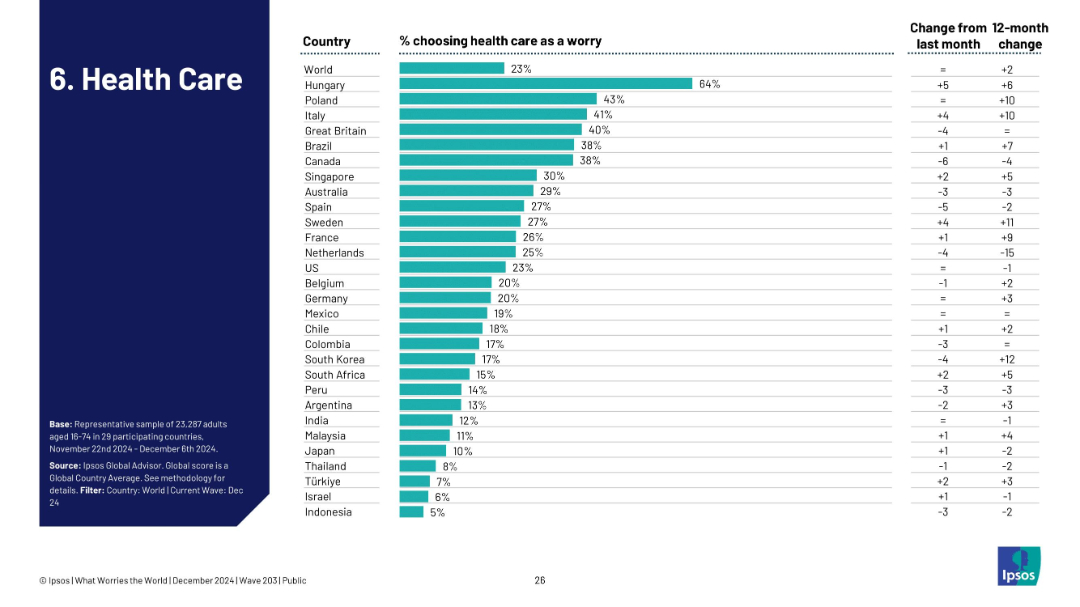
Bar chart showing how many in each country identify health care as a top concern, including trends from the previous month/year.
Risk Assessment and Management
Healthcare & Pharmaceuticals
The slide shows healthcare concerns at 23% globally, led by Hungary (64%). It provides a comparative look at how health systems and concerns differ by region, tracking recent perception changes.
healthcare, system strain, patient care, Ipsos, global health, concern levels
Single Chart
IPSOS
Saved
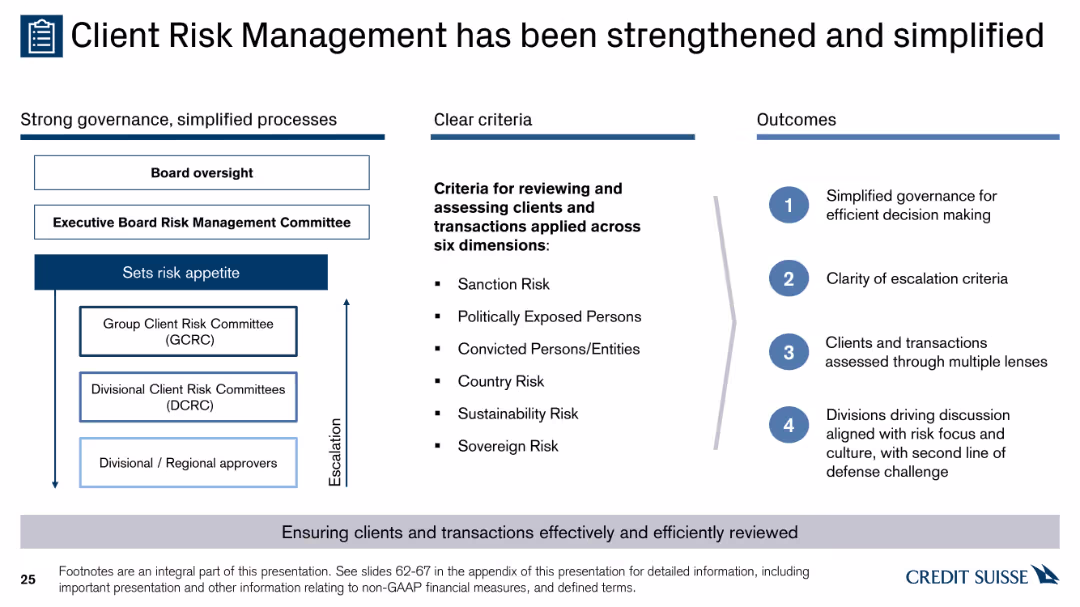
A diagram with three columns showing governance structure, criteria for reviewing clients and transactions, and outcomes. Contains text, bullet points, and arrows for escalation.
Risk Assessment and Management
Financial Services
The slide explains the enhanced and simplified client risk management process, detailing governance structures, risk criteria, and the expected outcomes for effective decision making.
governance, risk, criteria, outcomes, escalation
Header Horizontal
Credit Suisse
Saved
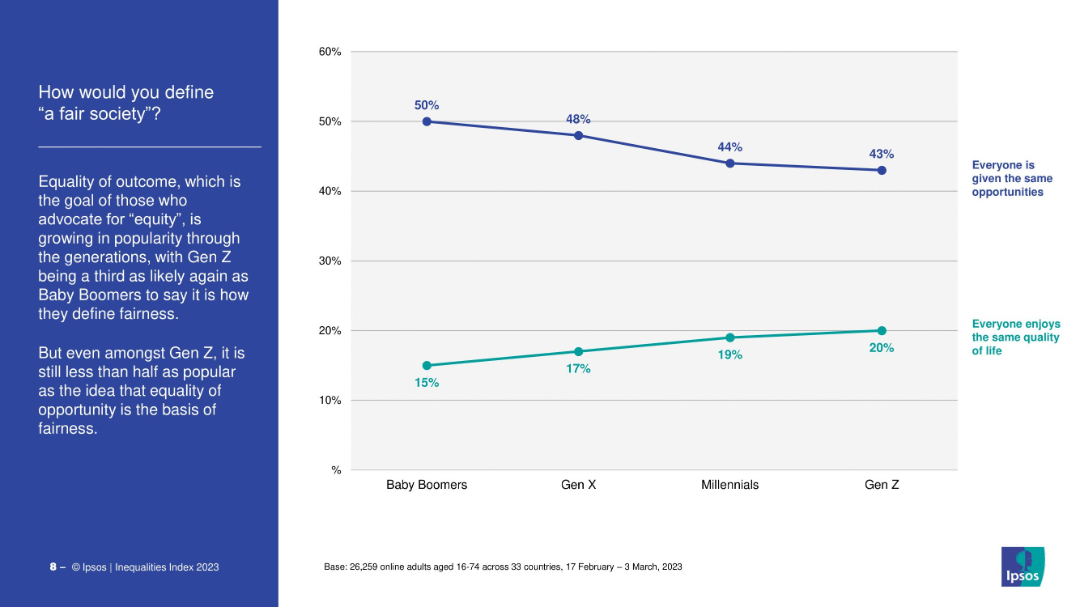
Dual-line chart comparing definitions: “same opportunity” vs. “same quality of life.” Left-aligned narrative and title.
Market Analysis and Trends
Government & Public Sector
The slide contrasts generational views on fairness. While most still define fairness as equal opportunity, support for equal outcome is rising, especially among Gen Z, who show the highest support for equity.
fairness, equity, opportunity, Gen Z, definitions, values
Mixed Chart
IPSOS
Saved
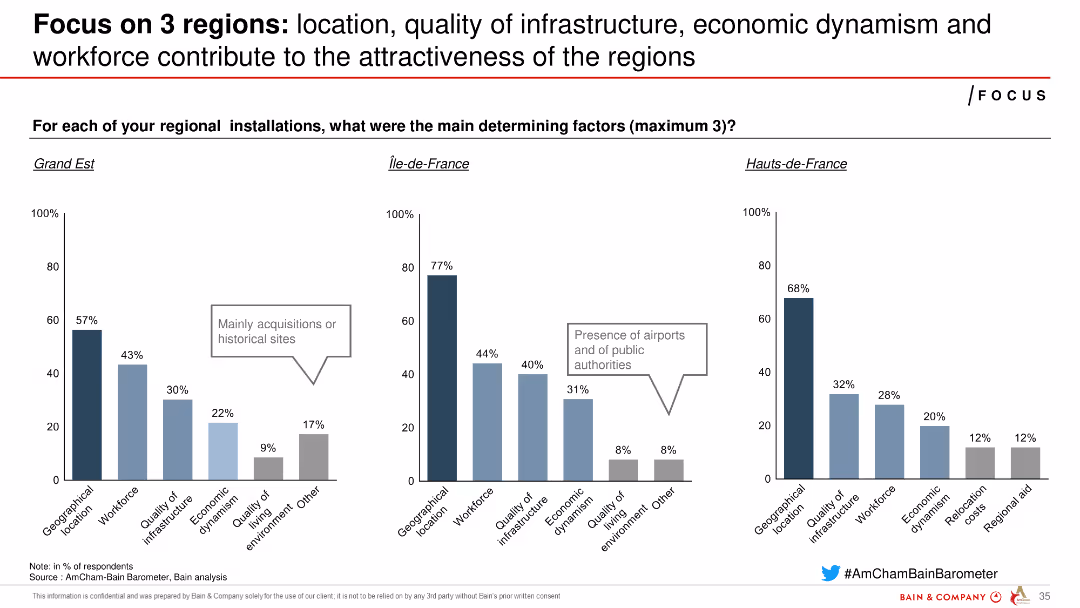
Three column charts comparing determining factors for regional installations in Grand Est, Île-de-France, and Hauts-de-France.
Market Analysis and Trends
Industrial & Manufacturing
Compares the main factors influencing attractiveness in three French regions, focusing on geographical location, infrastructure, economic dynamism, and workforce.
regions, attractiveness, factors, comparison, France
Multiple Chart
Bain
Saved
Graphs and stats display current customer relationships and future improvement plans.
Customer and Market Segmentation
Financial Services
Details current state and strategic plans for enhancing customer relationships in banking.
customer relationships, banking, strategic plans, improvement
Multiple Chart
Barclays
Saved
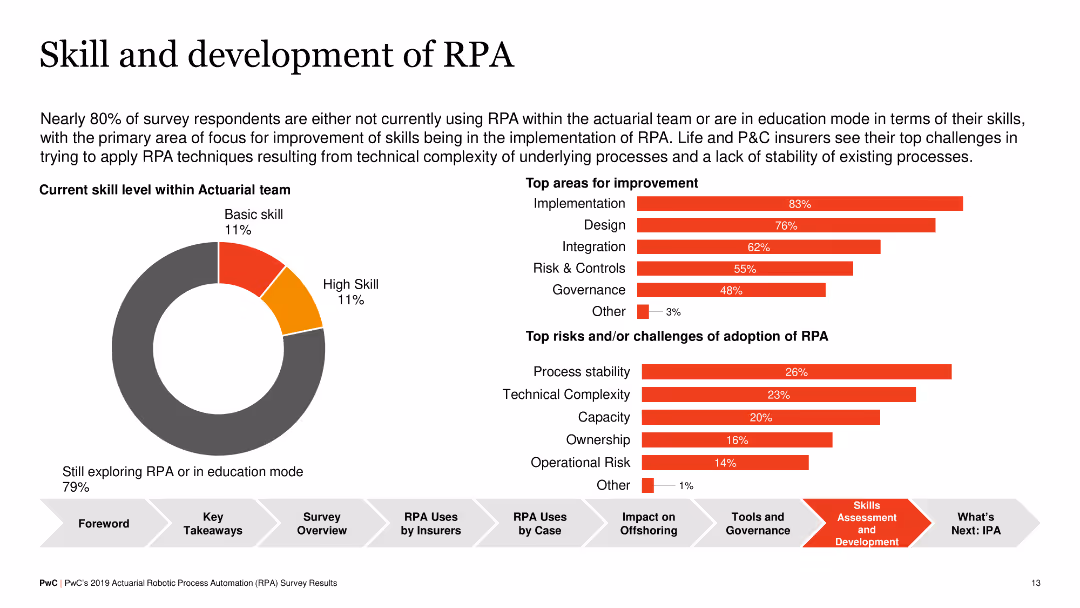
Pie chart showing skill levels within actuarial teams, and horizontal bar charts indicating top areas for improvement and challenges in RPA adoption (e.g., implementation, design, process stability).
Human Resources and Talent Management
Financial Services
The slide discusses the current skill levels in RPA among actuarial teams and identifies key areas for improvement, such as implementation and design, as well as challenges like process stability and technical complexity, aiming to enhance RPA adoption.
RPA, Skills Development, Insurance, Challenges
Multiple Chart
PwC/Strategy&
Saved
The slide combines text blocks with visual elements such as icons and images. A large world map in the background ties into the global theme, and text sections are well defined with bullet points and subheadings.
Strategic Planning
Financial Services
Highlighting the strategic initiatives and achievements of Macquarie Capital, the slide encapsulates key financial contributions and significant deals. It showcases the division's global reach and expertise in various market segments, with an emphasis on infrastructure and energy project development.
macquarie capital, strategic, global, investment, infrastructure, energy, finance, deals
Mixed Chart
Morgan Stanley
Saved
The slide features two sets of bar charts comparing awareness and preference for traditional financial services in 2015 and 2017 across six markets.
Market Analysis and Trends
Financial Services
The slide illustrates the decline in barriers to FinTech adoption, such as lack of awareness and preference for traditional services, from 2015 to 2017 in various markets.
FinTech, barriers, adoption, awareness, traditional services
Single Chart
EY
Saved
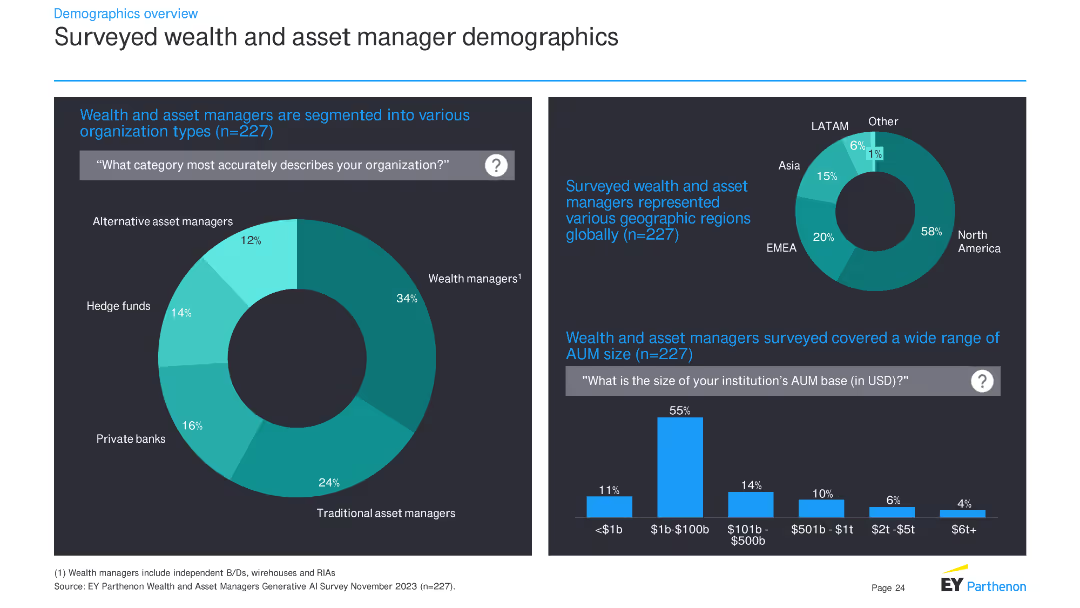
The slide contains two charts: a pie chart showing the types of organizations surveyed and a column chart showing the geographic regions of respondents. It also includes a bar chart for AUM size distribution.
Market Analysis and Trends
Financial Services
This slide provides demographic information about the survey respondents, detailing the types of organizations they represent, their geographic distribution, and the size of their assets under management (AUM).
demographics, survey, financial services, organization types, geographic regions, AUM, pie chart, column chart, bar chart
Multiple Chart
EY
Saved
Slide includes a line graph and column charts illustrating global print and digital news circulation from 2013 to 2018.
Market Analysis and Trends
Media & Entertainment
Discusses global trends in news consumption, focusing on the rise of digital subscriptions and the stability of print circulation.
global trends, news consumption, digital subscriptions, print circulation, rise, stability, media market, circulation data, comparison
Mixed Chart
Accenture
Saved
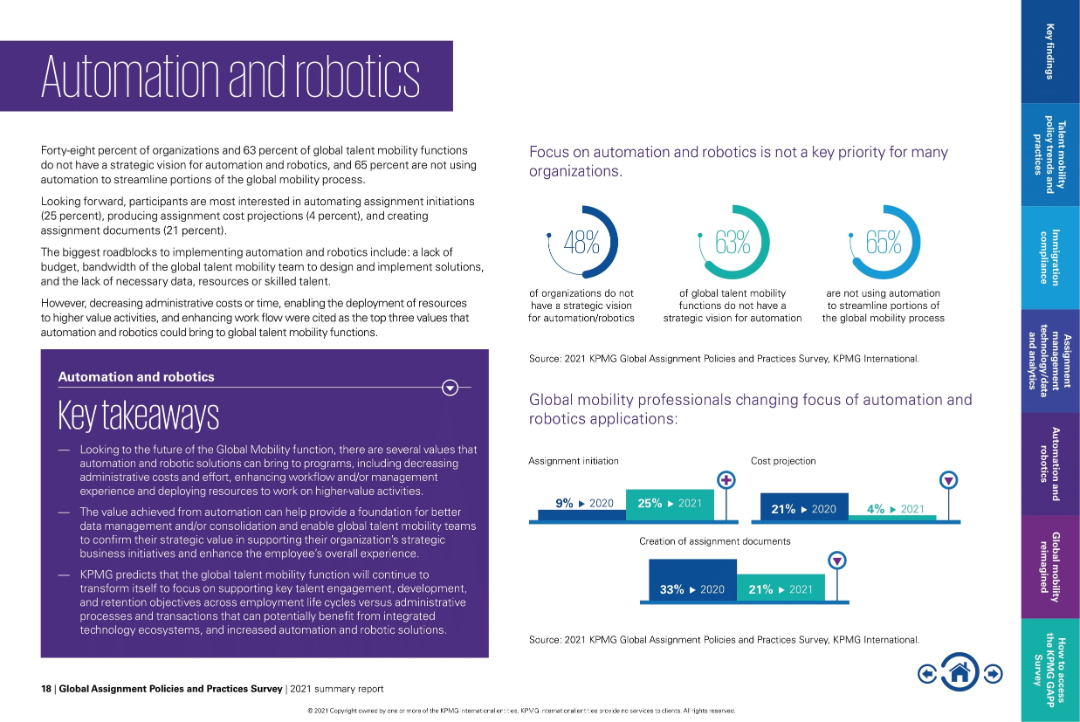
Purple-themed layout with left text box, icon graphs, and bar charts showing adoption shifts.
Technology and Digital Transformation
Technology & Software
Highlights that many organizations lack a strategic vision for automation and are not utilizing it in mobility processes. Shows a shift in automation focus from document creation to assignment initiation. Key values include reduced admin work and better data consolidation.
automation, robotics, assignment initiation, cost projection, workflow automation, technology in mobility, global processes
Multiple Chart
KPMG
Saved
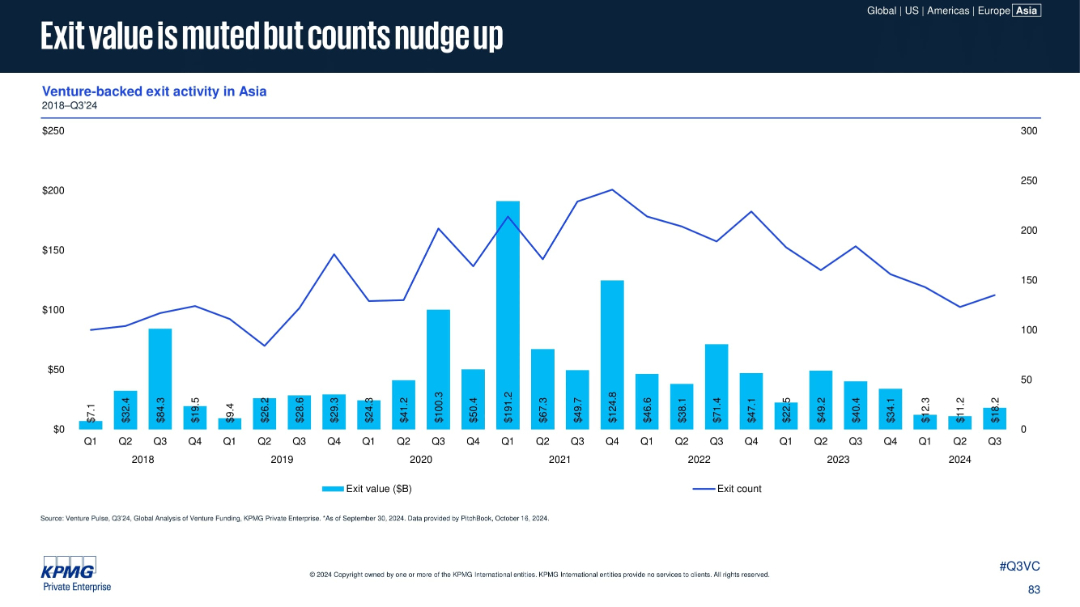
Bar chart with exit value ($B) and line for exit count from 2018–Q3 2024. Bright blue bars and navy line over white background.
Investment Analysis
Financial Services
Details trends in exit activity for VC-backed companies in Asia. While total exit values have declined, the number of exits is slightly increasing—indicating more activity despite reduced returns, likely reflecting lower valuations.
Exit Value, Asia, Venture-backed, Exits, VC Returns, Exit Count, 2024 Q3
Single Chart
KPMG
Saved
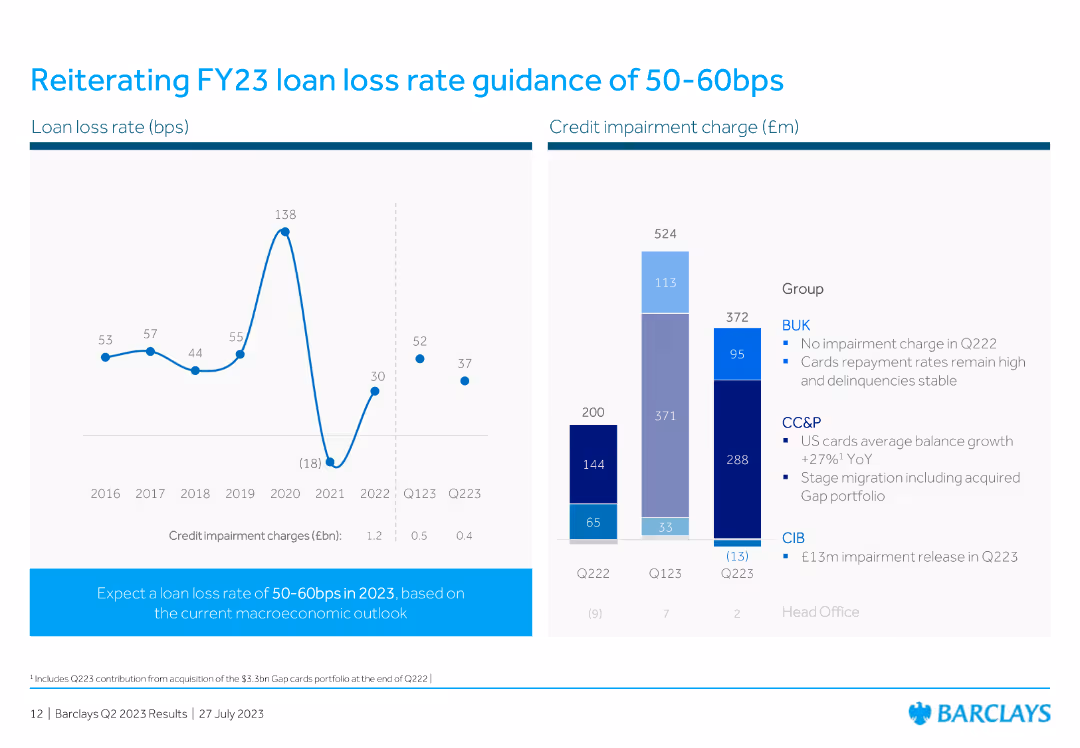
The slide features a line chart and a column chart illustrating loan loss rates and credit impairment charges over time.
Risk Assessment and Management
Financial Services
This slide reiterates the loan loss rate guidance for FY23, supported by historical data and current credit impairment charges, to emphasize risk management.
loan loss, rate, guidance, FY23, credit, impairment, charges, financial, line chart, column chart
Multiple Chart
Barclays
Saved
This slide has a white and blue color theme with a bubble chart categorizing various cash-related initiatives by their typical EBIT impact and time to cash release. The chart uses different shades to distinguish between receivables, inventory, payables, and cross-cutting measures, with annotations for certain initiatives.
Financial Performance
Financial Services
The slide prioritizes cash-related initiatives based on their EBIT impact and time to cash release. It visually categorizes these initiatives into groups like "immediate cash opportunities" or "structural changes," providing a strategic overview for financial planning and cash flow management.
cash management, EBIT impact, financial planning, cash flow, strategic prioritization
Single Chart
McKinsey
Saved
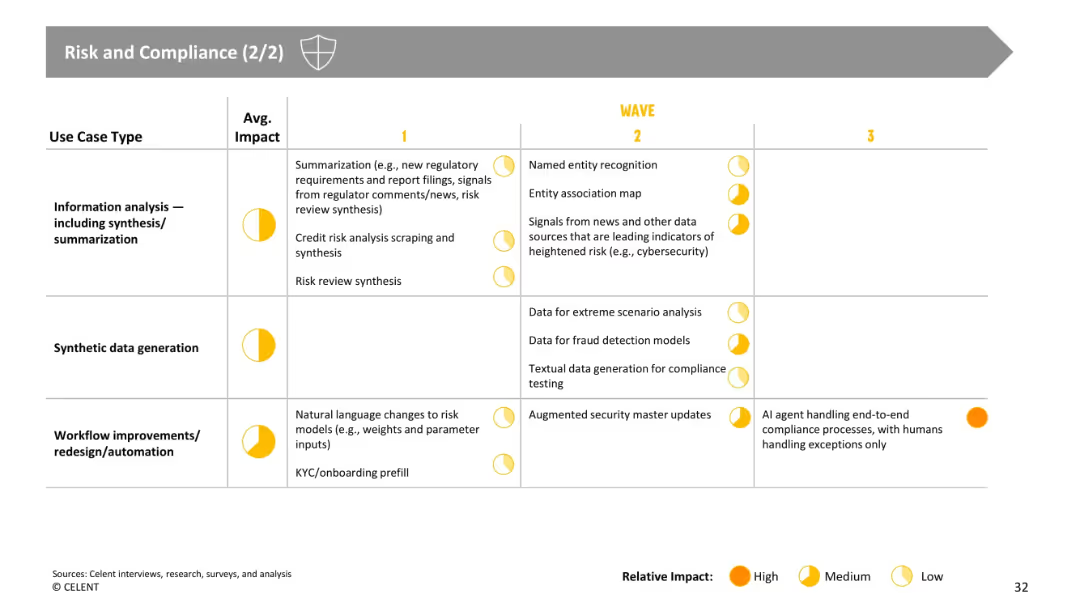
Follows same format; focuses on summarization, risk synthesis, synthetic data, and workflow redesign. High-impact use cases appear in Wave 3 (e.g., full compliance automation).
Risk Assessment and Management
Financial Services
Continues analysis of compliance-related use cases, particularly focused on risk evaluation, fraud modeling, and automated workflows. Points to long-term impact of AI agents handling complex compliance processes with minimal human intervention, highlighting innovation potential.
risk management, workflow, fraud, synthetic data, compliance automation, GenAI
Single Chart
Oliver Wyman
Saved
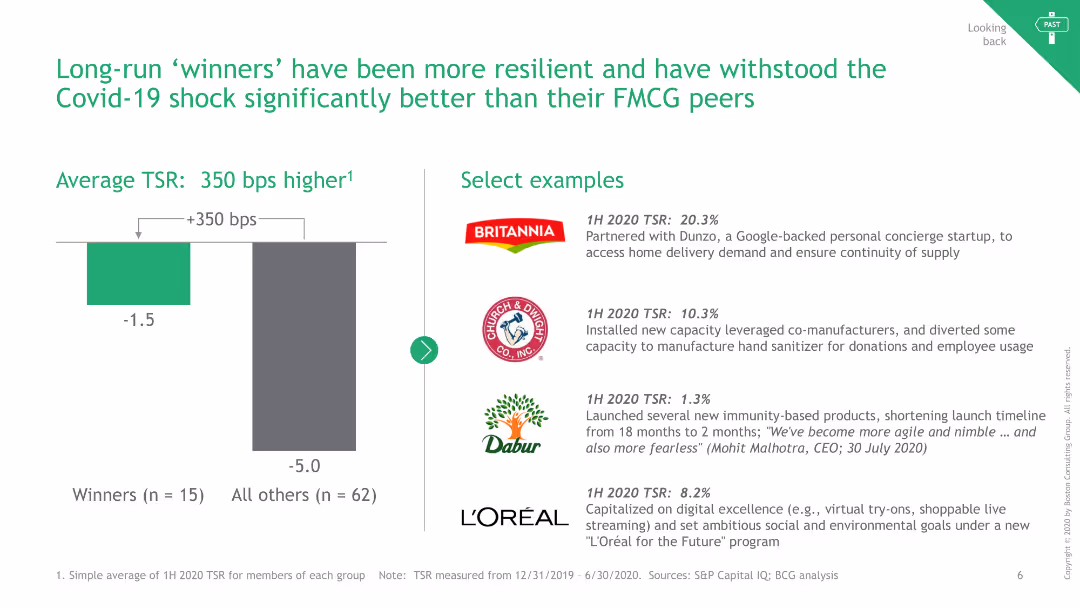
The slide includes a bar chart comparing TSR of winners vs. others and lists select examples of resilient companies.
Strategic Planning
Consumer Goods
It shows how long-run winners have outperformed others during the Covid-19 shock, with examples from different companies.
Winners, TSR, Resilience, Covid-19, Examples
Mixed Chart
BCG
Saved
Features a large split column chart showing assets and liabilities balanced at €1.007 trillion as of June 30, 2023.
Financial Performance
Financial Services
Displays the financial stability of Deutsche Bank with a detailed breakdown of assets and liabilities, highlighting liquidity reserves.
balance sheet, assets, liabilities, financial, stability, bar graph, liquidity, banking, June 2023, reserves
Multiple Chart
Deutsche Bank
Saved
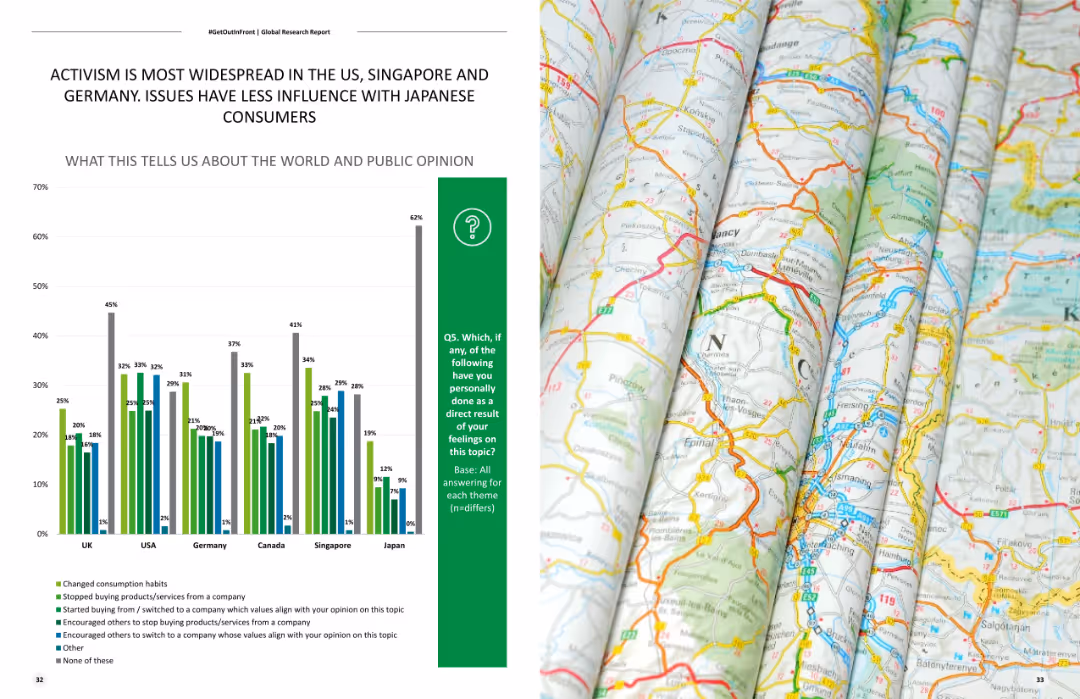
Shows a column chart comparing levels of activism across different countries, highlighting the differences in public engagement with various social issues.
Market Analysis and Trends
Government & Public Sector
Compares levels of activism across multiple countries, focusing on public engagement with social issues in the US, Singapore, Germany, and Japan.
Activism, country comparison, social issues, public engagement, market trends
Mixed Chart
Deloitte
Saved
Contains three overlapping circles, each representing a different aspect of engaging with Web3 (Explore, Partner, Upskill), set against a dark background.
Strategic Planning
Technology & Software
Offers guidance for business leaders on how to begin engaging with Web3, suggesting a reevaluation of business models and partnerships, and highlighting the importance of upskilling the workforce in Web3 technologies.
Leadership, Web3, Business Strategy, Partnerships, Training
Diagram
McKinsey
Saved
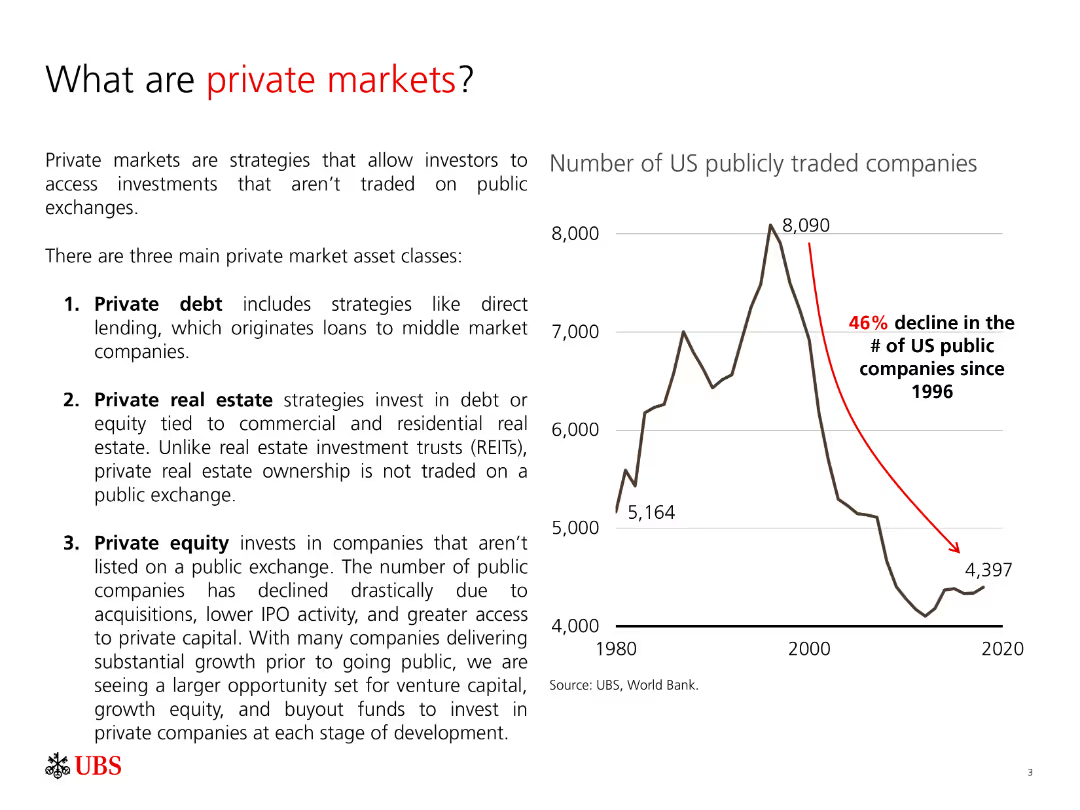
The slide includes a column chart showing the decline in the number of US publicly traded companies from 1996 to 2020. The text explains three main private market asset classes.
Market Analysis and Trends
Financial Services
The slide explains what private markets are, the types of private market asset classes, and provides a visual representation of the decline in US publicly traded companies, illustrating the growing importance of private markets.
Private markets, asset classes, private equity, private debt, private real estate
Mixed Chart
UBS
Saved
Previous
Next
If nothing, comes up, please save your slides first
Create a FREE account to continue browsing
Receive Instant Access to 1,000+ slides from companies like McKinsey, Google, and Goldman Sachs
First Name
Last Name
Email
Password
I agree to all
Terms & Privacy Policy
Thank you! Your submission has been received!
Oops! Something went wrong while submitting the form.
Have an account?
Sign in
Column Chart
Heatmap
Chevron
Org Chart
Infographic
Callouts
Timeline
List
Graphic
Picture
Process Flow
Diagram
Paragraph
Map
Table
Framework
Subtitle
Takeaway Box
Icon
Other Chart
Radar Chart
Waterfall Chart
Mekko Chart
Pie Chart
Scatter Plot
Line Chart
Bar chart
Bullet points