My Account
My Slides
Search by Category
Templates
Leave Feedback
Login
Logout
Get Started
Browse all Slides
Browse all Slides
Create a FREE Account
Instant access to 1,000+ real slides from top companies like McKinsey, BCG, Goldman Sachs, Google and many more!
First Name
Last Name
Email
Password
I agree to all
Terms & Privacy Policy
Thank you! Your submission has been received!
Oops! Something went wrong while submitting the form.
Have an account?
Sign in
Saved Slides
Three main sections with icons and brief bullet points illustrate the company's commitment to Environmental, Social, and Governance (ESG) principles. Clear and straightforward layout with a balance of text and graphics.
Regulatory and Compliance
Financial Services
Slide illustrates company values in ESG, demonstrating the initiatives and achievements in social responsibility. Could be used to underscore the ethical framework and operational philosophy of the company.
ESG, corporate values, social responsibility, governance, sustainability
Pillar
Goldman Sachs
Saved
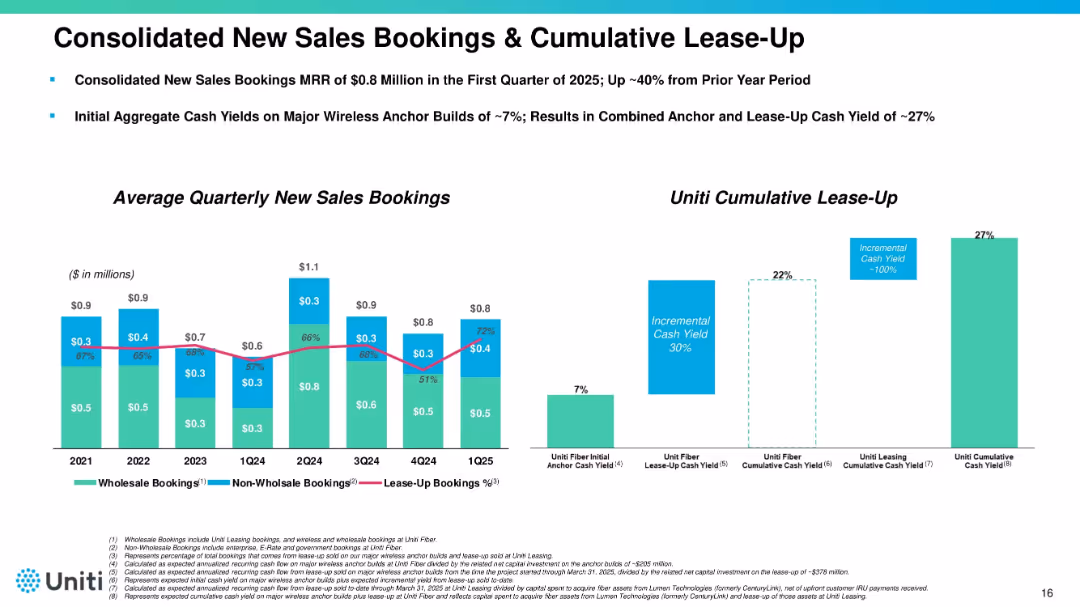
Split into two main sections: bar chart on the left showing quarterly sales bookings (2021–1Q25), and a vertical bar chart on the right illustrating cumulative lease-up metrics. Uses blue, green, and pink colors with a clean layout.
Performance Metrics and KPIs
Telecommunications
Highlights trends in wholesale and non-wholesale sales bookings, with a focus on lease-up contribution over time. Also shows cash yield improvement from initial anchor builds to cumulative impact, demonstrating a 27% cumulative cash yield.
sales bookings, lease-up, MRR, cash yield, wholesale, telecom, 2025
Multiple Chart
Goldman Sachs
Saved
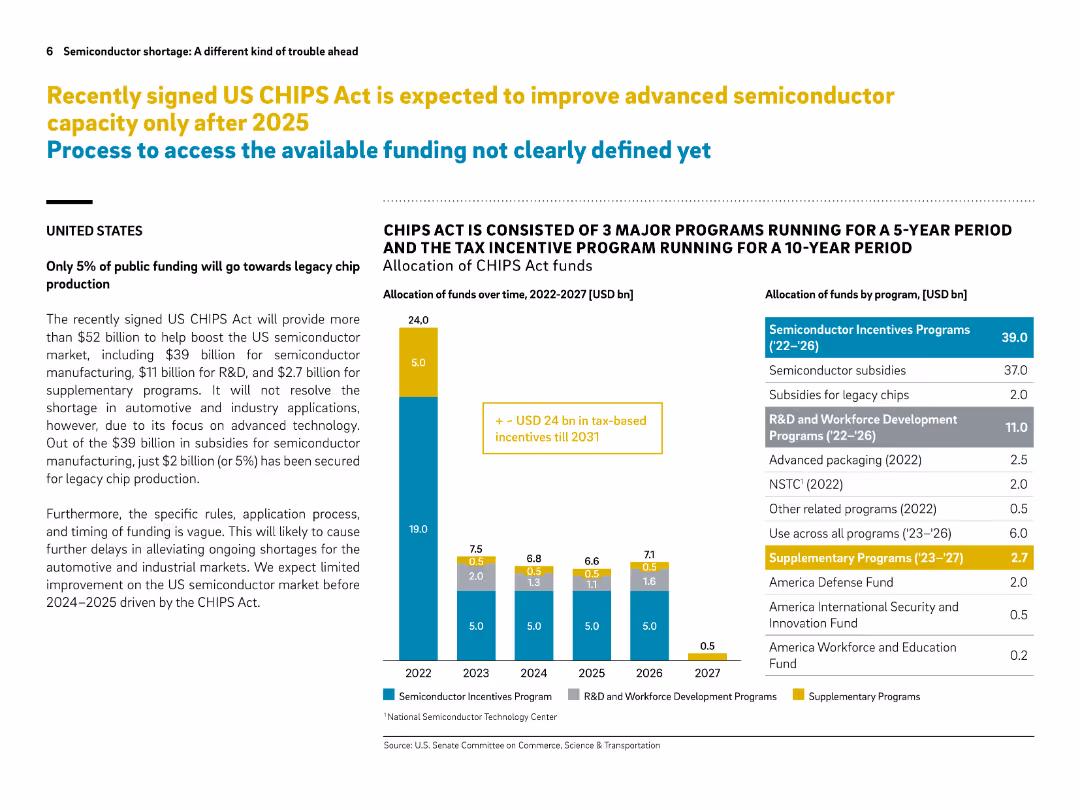
Split layout with left-aligned explanation text and bar chart on the right. Colored segments categorize different fund types.
Regulatory and Compliance
Government & Public Sector
This slide explains the funding allocation under the US CHIPS Act, emphasizing that only 5% is directed to legacy chip production. It breaks down how over $52B will be spent, highlighting delays in impact and lack of support for industrial/automotive applications.
CHIPS Act, funding, semiconductor, legacy chips, US policy, advanced technology, subsidies, R&D, timeline, market support
Mixed Chart
Roland Berger
Saved
This slide includes bar charts showing IG convert issuance over time and the growth of global private debt institutional funds.
Financial Performance
Financial Services
The slide discusses the trend of firms turning to alternative financing methods such as convertible debt and private credit in response to higher interest rates. It highlights the increasing attractiveness and flexibility of these options. The slide can be used for financial strategy and performance analysis discussions.
financing, convertible debt, private credit, interest rates, alternative financing
Multiple Chart
JP Morgan
Saved
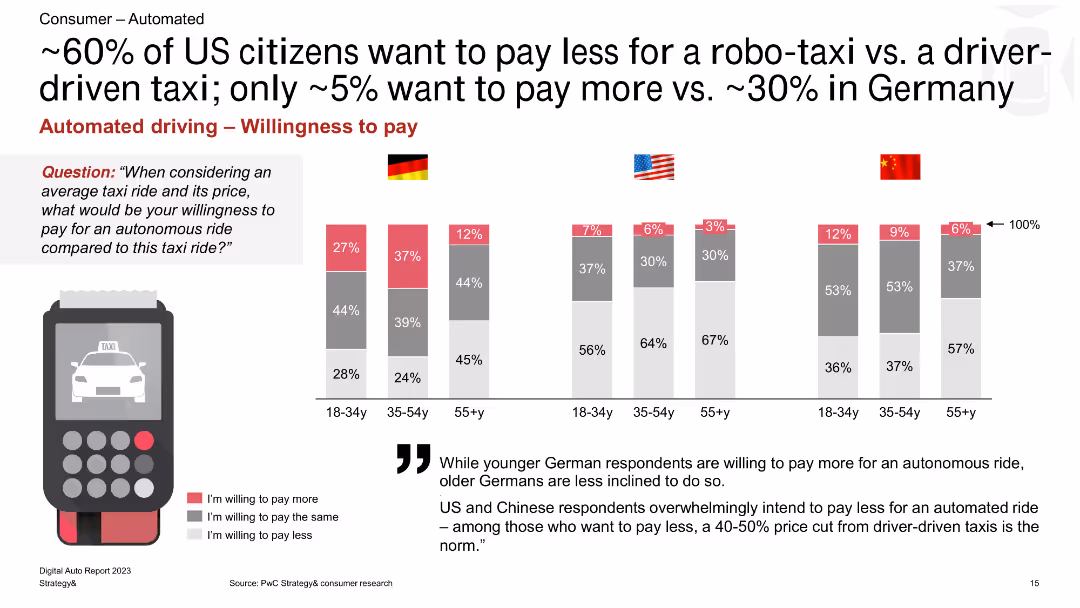
The slide shows a column chart depicting willingness to pay for autonomous vs. driver-driven taxis among different age groups in Germany, the US, and China, with percentage bars for each category.
Market Analysis and Trends
Transportation & Logistics
The slide compares the willingness to pay for autonomous taxis versus driver-driven taxis, revealing that a significant portion of US respondents prefer lower costs for autonomous rides compared to Germany.
robo-taxi, willingness to pay, driver-driven taxi, Germany, US, China, autonomous rides, pricing, consumer preferences
Multiple Chart
PwC/Strategy&
Saved
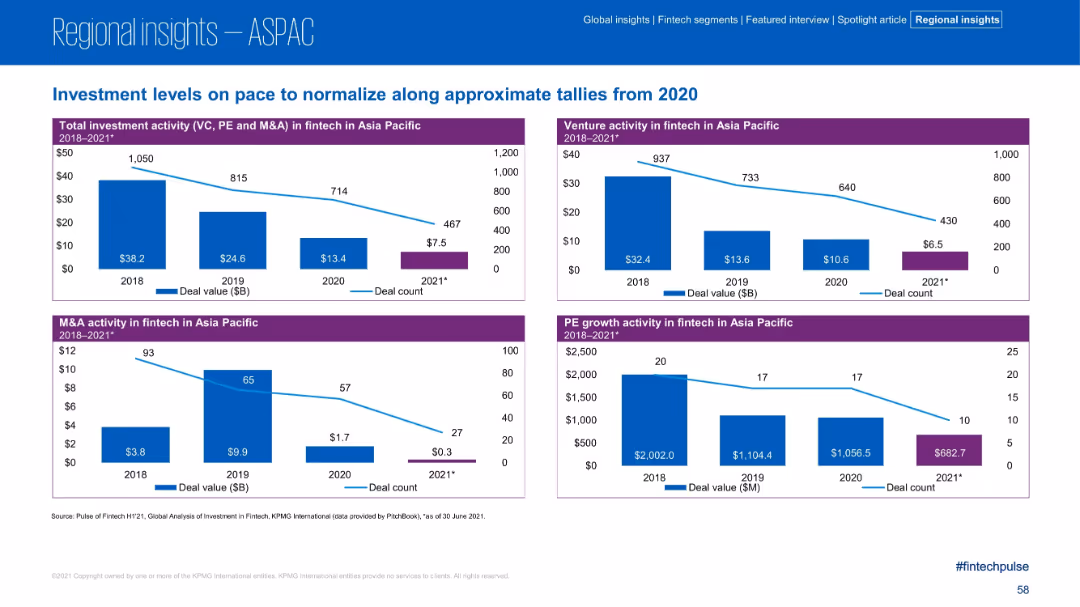
Four-panel bar and line charts comparing deal value and count for VC, PE, and M&A from 2018–2021 in ASPAC.
Market Analysis and Trends
Financial Services
This slide illustrates the decline in fintech investment activity across the Asia Pacific region from 2018 to 2021. Each panel focuses on a different segment—venture, M&A, and PE—with deal value and count both trending downward across the board.
Fintech, Asia Pacific, Investment, Deal Flow, M&A, PE, VC, Trends
Multiple Chart
KPMG
Saved
The slide is divided into three sections with bar charts and lists that provide statistical data on firm culture, its importance, and reasons for employee departure. The design is clean with a consistent blue color scheme.
Human Resources and Talent Management
Professional Services
Presenting statistical evidence of firm culture’s value to employees, this slide is likely part of a human resources presentation aimed at highlighting the significance of culture in job satisfaction and retention.
firm culture, importance, statistics, employee satisfaction, retention, human resources, job, satisfaction, reasons
Table
Kearney
Saved
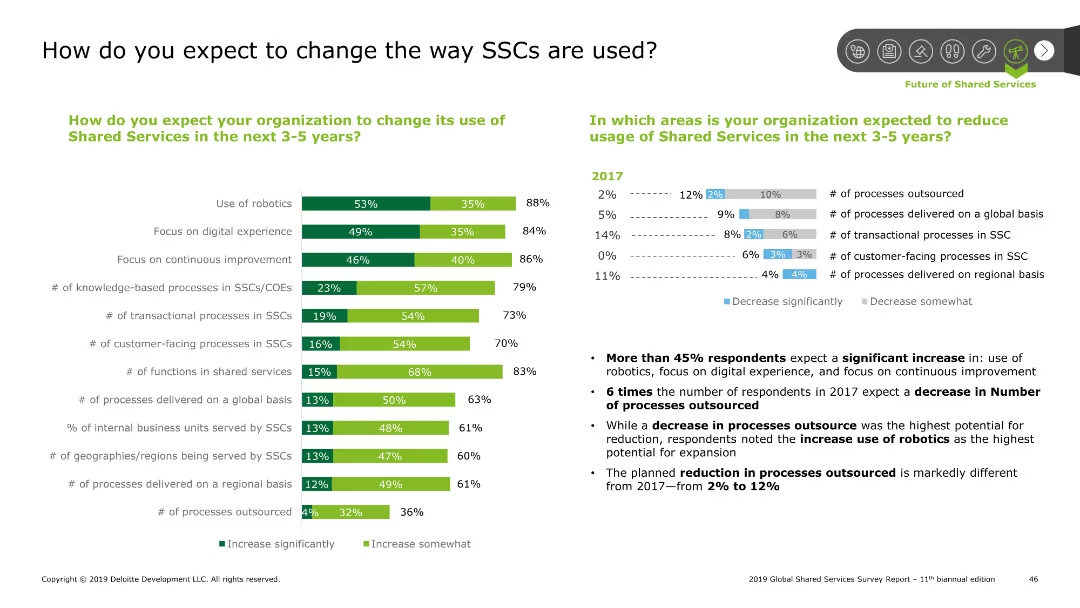
The slide has two sections with a column chart on the left and a mixed bar and line chart on the right, indicating changes in SSC usage expectations.
Strategic Planning
Professional Services
Examines future changes in Shared Services Centers (SSCs) usage, including robotics, digital experience, and continuous improvement, with respondent percentages.
SSC, robotics, digital, improvement, knowledge, processes, customer-facing, functions, reduction, outsourcing
Multiple Chart
Deloitte
Saved
Slide features a column chart comparing loan originations across years, with an accompanying bar for forecast data, and textual information below the chart.
Financial Performance
Education & Training
This slide tracks the origination volumes of private education loans, highlighting historical data and forecasts. It is suitable for assessing the trend in loan disbursement and predicting future performance in the private education lending market.
Education, Loans, Originations, Forecast, Trend, Financial Analysis, Private, Market Share
Single Chart
Morgan Stanley
Saved
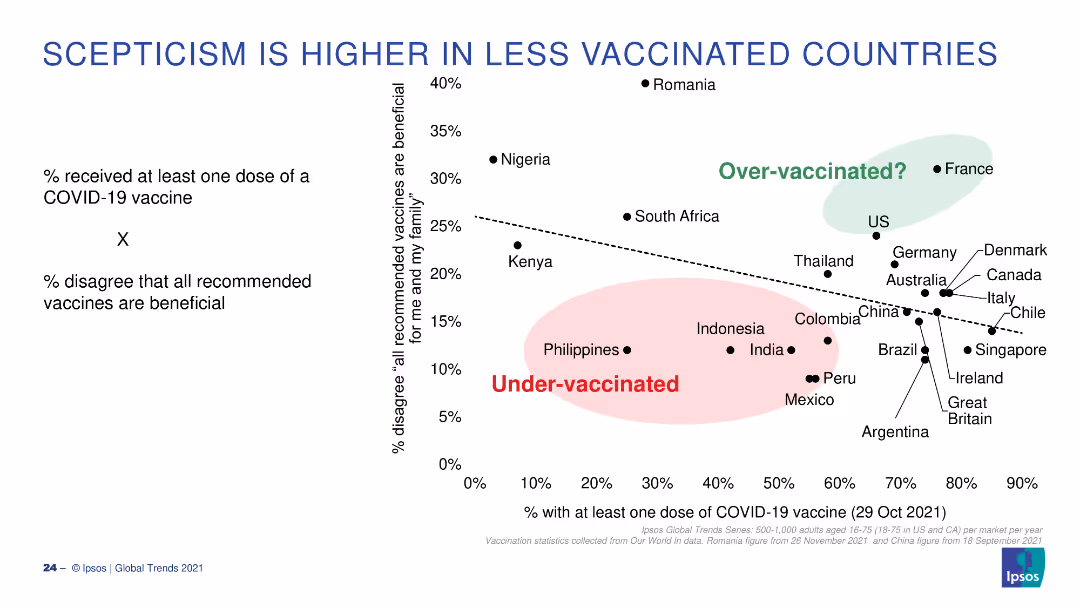
A scatter plot showing the correlation between vaccination rates and vaccine scepticism, with countries categorized as over or under-vaccinated.
Market Analysis and Trends
Healthcare & Pharmaceuticals
This slide illustrates the relationship between the percentage of the population vaccinated and the percentage who disagree that vaccines are beneficial.
Vaccines, Scepticism, Correlation, Vaccination, Over-vaccinated
Single Chart
IPSOS
Saved
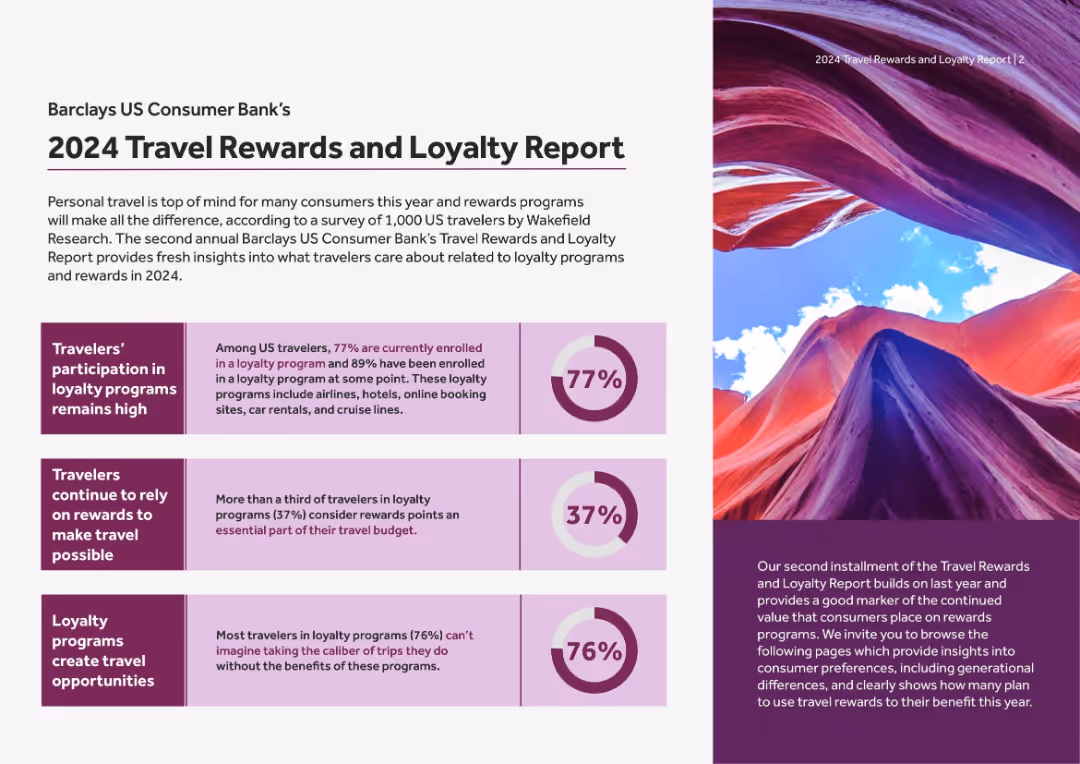
Split page with purple and white design, circular stat graphics on left, large image on right. Text-heavy with visually segmented stats.
Market Analysis and Trends
Financial Services
Summarizes key insights from a survey of US travelers on travel rewards: 77% are enrolled in loyalty programs, rewards drive travel decisions, and loyalty creates travel opportunities.
loyalty programs, rewards, travel insights, Barclays, US travelers, enrollment, incentives, 2024 trends
Mixed Chart
Barclays
Saved
The slide presents two complex scatter plots comparing industry performance and stability. It uses color-coded dots for different industries and banks.
Competitive Landscape
Financial Services
This visual comparison is used to showcase long-term earnings growth and stability within the banking sector, highlighting the company's superior performance.
earnings growth, stability, industry comparison, banks
Multiple Chart
JP Morgan
Saved
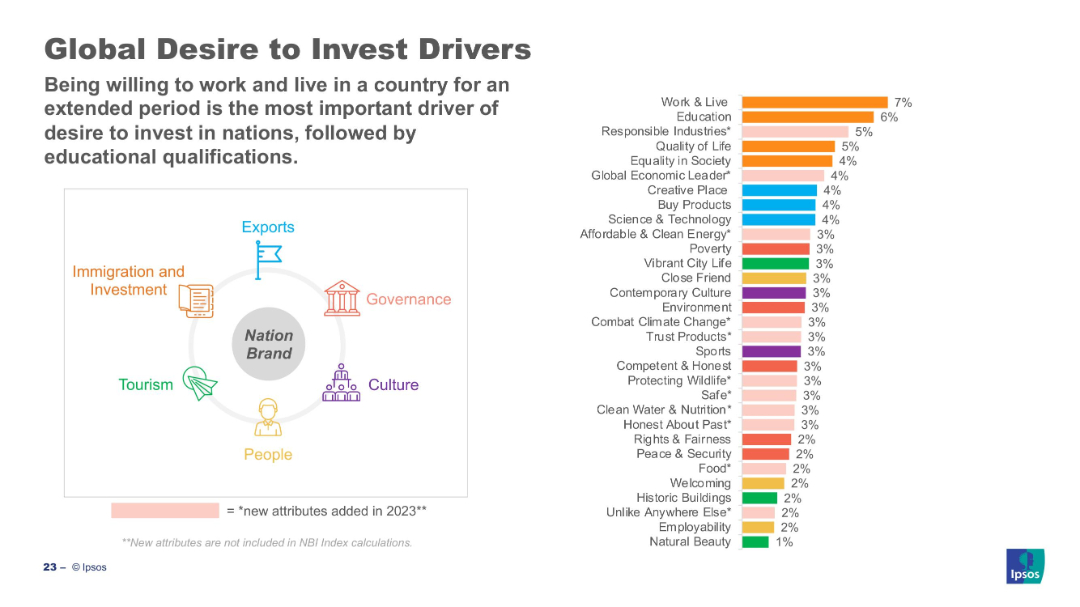
Bar chart (right) ranks top investment drivers; left visual maps drivers to nation brand sectors.
Customer and Market Segmentation
Professional Services
Work & live, education, and responsible industries are top investment drivers globally. The visual shows these drivers categorized under broader nation brand domains such as governance and economy. Many of the attributes were newly added in 2023.
investment, business drivers, Ipsos, perception, work, education, 2023, attributes, sustainability
Mixed Chart
IPSOS
Saved
The slide features two column charts. The left chart shows the UK unemployment rate and wage growth over time. The right chart presents labor force participation rates for the US, Eurozone, and UK. The data is well-segmented and color-coded.
Market Analysis and Trends
Financial Services
This slide provides insights into the UK labor market, focusing on unemployment, wage growth, and labor force participation rates, essential for labor market analysis.
UK labor market, unemployment, wage growth, labor force participation, economic trends
Multiple Chart
JP Morgan
Saved
The slide includes a bar chart showing the projected electricity demand growth by end-use technologies (TWh) from 2022 to 2050. Categories include Industrial, Commercial, Residential, Road Transport, and Other Transport. Each category has a detailed breakdown for the years 2022 and 2030.
Market Analysis and Trends
Energy & Utilities
This slide forecasts the doubling of power demand by 2050 due to electrification across various sectors. It emphasizes the significant growth in industrial and transport electricity demand, driven by technological advancements and increased adoption of electric vehicles.
Electrification, Power, Demand, Growth, 2050, Industrial, Transport
Mixed Chart
EY
Saved
Similar to slide 1844, it presents a central, bold statement with a list of key opportunities and challenges against a monochromatic background, with the second point highlighted.
Strategic Planning
Professional Services
Focuses on the digitization of globalization as a key strategic point. The slide aims to discuss the specific implications and strategic considerations of digitizing global operations.
globalization, digitization, strategy, opportunities
Agenda
McKinsey
Saved
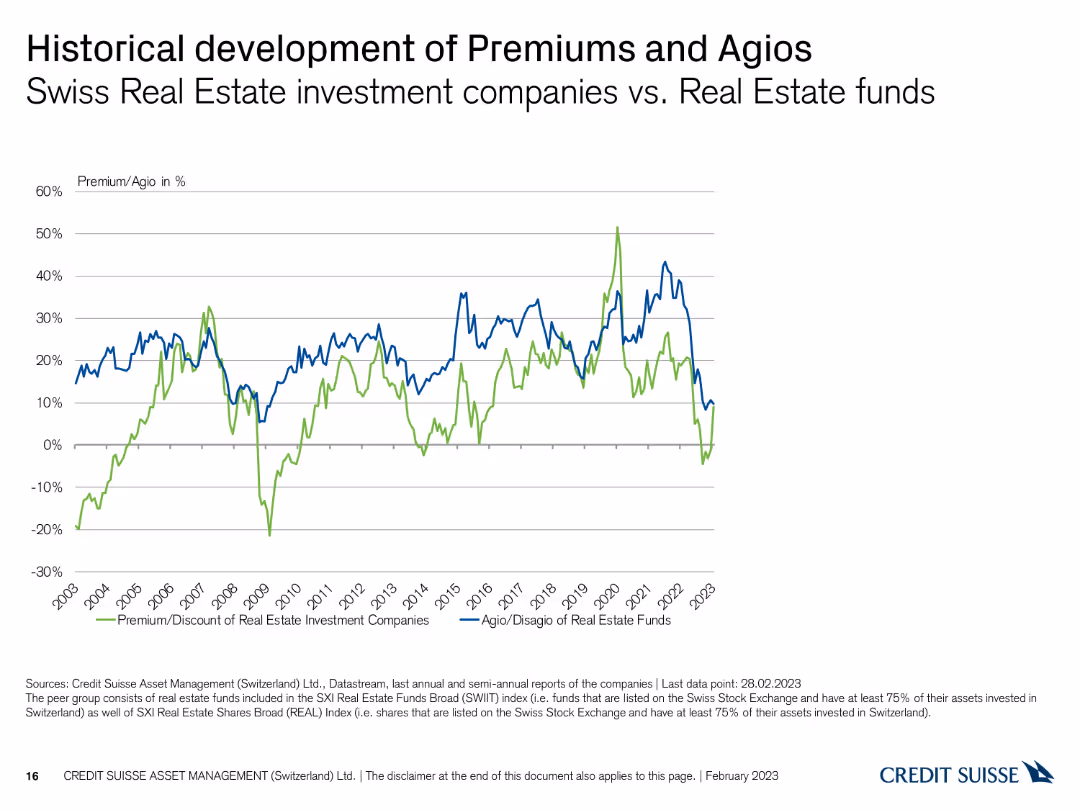
This slide features a line chart comparing the historical development of premiums and agios for Swiss real estate investment companies and funds from 2003 to 2023, with two lines in different colors.
Market Analysis and Trends
Real Estate & Construction
The slide tracks the historical trends of premiums and agios for real estate investments, providing insights into market performance over time. It is used for trend analysis and historical comparison.
Real estate, premiums, agios, historical trends, market performance
Single Chart
Credit Suisse
Saved
This slide displays column charts and world maps indicating improvements in market share across different regions and financial results from 2017 to 2021.
Market Analysis and Trends
Financial Services
This slide details JP Morgan's market share growth and financial outcomes across all business sectors and global regions from 2017 to 2021. It emphasizes their sustained expense management and operational leverage, contributing to their solid financial positioning in various markets.
market share, global, growth, financial
Multiple Chart
JP Morgan
Saved
Complex slide with bar graphs, a percentage breakdown, and color differentiation. There is text explaining the importance of non-financial targets and a legend detailing indexed scores.
Market Analysis and Trends
Professional Services
Presents comparative data on non-financial performance measures, valuable for strategic planning and assessing the impact of enterprise reinvention on sustainability and innovation.
Enterprise, Reinvention, Performance, Non-Financial, Sustainability, Innovation, Talent, Diversity
Multiple Chart
Accenture
Saved
Slide features a large bar chart detailing investor opinions on factors affecting equity returns, emphasizing megacap tech stocks and inflation. Simple layout with clear headers and a descriptive side note in a green box.
Market Analysis and Trends
Financial Services
Highlights investor focus on megacap tech stocks and inflation as significant drivers for equity returns in the U.S. market, useful for financial forecasting and investment strategy discussions.
equity returns, inflation, megacap stocks, U.S. market, investor focus
Single Chart
BCG
Saved
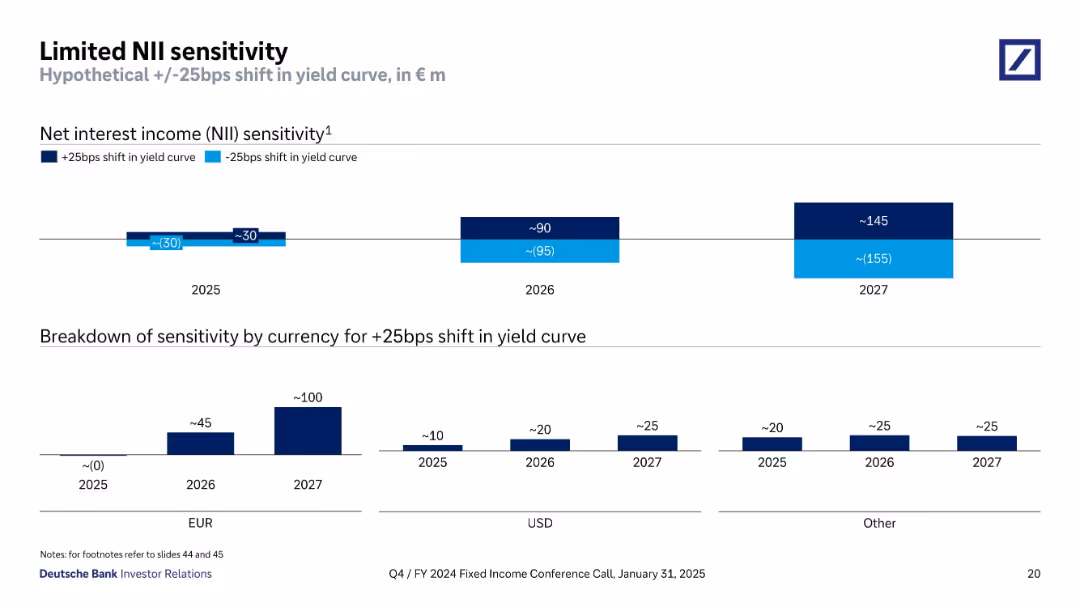
Bar chart displays net interest income (NII) sensitivity to +/-25bps yield curve shifts, broken down by year and currency. The layout uses a clean, dark-light blue contrast to show direction of sensitivity.
Risk Assessment and Management
Financial Services
This slide analyzes the bank’s net interest income sensitivity under hypothetical interest rate shifts of +/-25bps across years 2025–2027. It shows limited exposure in 2025 and gradually increasing sensitivity in later years. Sensitivity is broken down further by EUR, USD, and other currencies, illustrating manageable rate risk.
NII, interest rate sensitivity, yield curve, risk, 2025–2027, EUR, USD, Deutsche Bank, interest income
Multiple Chart
Deutsche Bank
Saved
Combination of two column charts detailing upcoming debt maturities and available liquidity.
Financial Performance
Transportation & Logistics
Provides a financial outlook by showcasing Aircastle's debt maturity schedule and liquidity status.
debt, maturity, financial outlook, liquidity, unsecured, bonds
Multiple Chart
Deutsche Bank
Saved
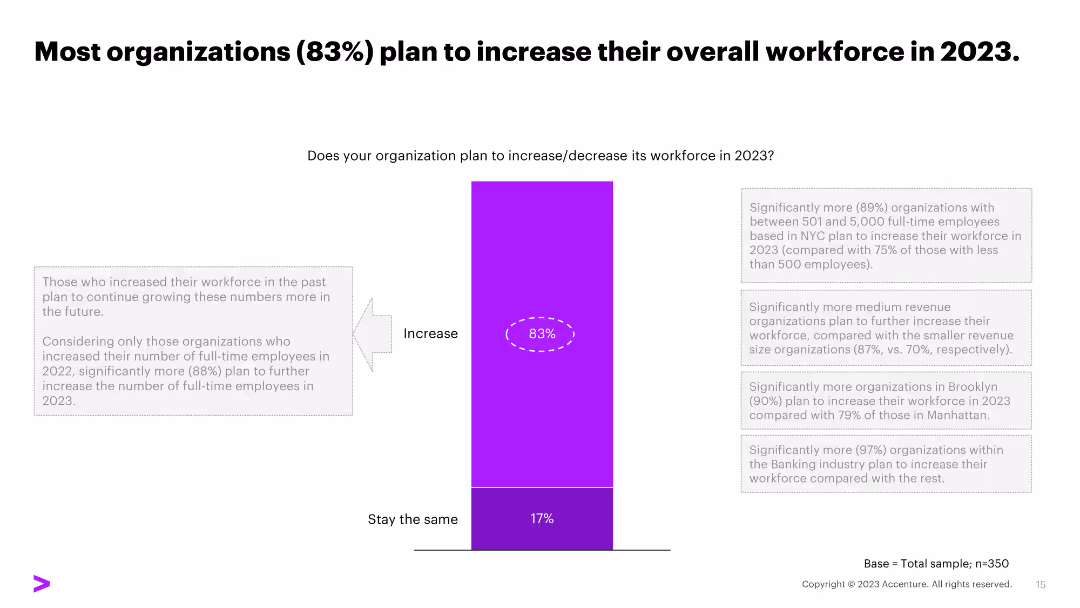
A slide with a title and a column chart showing the percentage of organizations planning to increase, decrease, or maintain their workforce in 2023.
Strategic Planning
Professional Services
Most organizations (83%) plan to increase their workforce in 2023, with insights into the trends among organizations with varying employee sizes and revenue.
workforce, plans, 2023, increase, organizations
Mixed Chart
Accenture
Saved
Slide with number 2, a bar graph showing fraudulent activity levels by country, an inset explaining the fraud index, and summary text highlighting key points.
Risk Assessment and Management
Professional Services
It addresses the issue of online fraud in SEA, quantifying the risk in different countries with a focus on Indonesia, Malaysia, and the Philippines. This data can guide risk management and trust-building strategies for businesses operating online in the region.
fraudulent activity, SEA, risk management, online fraud, Indonesia, Malaysia, Philippines
Single Chart
Bain
Saved
The layout includes bar graphs, column charts, and a pie chart, mirroring slide 1613 but with Malaysia-specific data. Neatly organized and color-coded for clarity.
Market Analysis and Trends
Technology & Software
The slide conveys detailed metrics on Malaysia's digital consumer behavior, specifically in e-commerce and media usage, suitable for market research and digital strategy development.
digital consumers, Malaysia, e-commerce, media usage, market research
Multiple Chart
Bain
Saved
Previous
Next
If nothing, comes up, please save your slides first
Create a FREE account to continue browsing
Receive Instant Access to 1,000+ slides from companies like McKinsey, Google, and Goldman Sachs
First Name
Last Name
Email
Password
I agree to all
Terms & Privacy Policy
Thank you! Your submission has been received!
Oops! Something went wrong while submitting the form.
Have an account?
Sign in
Column Chart
Heatmap
Chevron
Org Chart
Infographic
Callouts
Timeline
List
Graphic
Picture
Process Flow
Diagram
Paragraph
Map
Table
Framework
Subtitle
Takeaway Box
Icon
Other Chart
Radar Chart
Waterfall Chart
Mekko Chart
Pie Chart
Scatter Plot
Line Chart
Bar chart
Bullet points