My Account
My Slides
Search by Category
Templates
Leave Feedback
Login
Logout
Get Started
Browse all Slides
Browse all Slides
Create a FREE Account
Instant access to 1,000+ real slides from top companies like McKinsey, BCG, Goldman Sachs, Google and many more!
First Name
Last Name
Email
Password
I agree to all
Terms & Privacy Policy
Thank you! Your submission has been received!
Oops! Something went wrong while submitting the form.
Have an account?
Sign in
Saved Slides
This slide presents a comparison of IRB and standardized models through column charts, focusing on RWA and net receivables.
Risk Assessment and Management
Financial Services
Analyzes the impact of migrating US Cards portfolio to IRB models on RWAs, comparing historical data and future expectations.
IRB, US Cards, RWA, risk management, migration
Multiple Chart
Barclays
Saved
The slide presents a donut chart and a gauge chart showing the extent of managerial engagement in developing team engagement plans. Both charts use vibrant colors to differentiate levels of agreement and disagreement.
Human Resources and Talent Management
Professional Services
Focuses on how actively managers engage in team development, crucial for HR training sessions or leadership workshops to enhance managerial effectiveness.
managerial engagement, HR, development
Multiple Chart
PwC/Strategy&
Saved
Contains structured text with icons highlighting services for corporate clients and efficiency measures.
Sales and Business Development
Financial Services
Discusses extending offerings and improving sales processes to drive growth among corporate and institutional clients.
corporate clients, digital business, sales growth, efficiency, analytics
Diagram
UBS
Saved
Two column charts comparing the prevalence of computer skills in developing and developed countries, showing the population with no computer skills and with standard computer skills.
Technology and Digital Transformation
Technology & Software
This slide highlights the digital divide caused by unequal technological advancements and diffusion. It compares the prevalence of computer skills in developing and developed countries, emphasizing the need for inclusive technology and equitable access to new innovations.
Digital Divide, Computer Skills, Technological Inequality
Mixed Chart
Roland Berger
Saved
This slide presents a bar chart comparison of the outcomes of upskilling programs between organizations at different stages of program implementation, with a clear text description.
Human Resources and Talent Management
Professional Services
Compares the perceived effectiveness of upskilling programs between organizations at varying levels of program maturity, focusing on engagement, productivity, and innovation.
Upskilling Effectiveness, Talent Management, Workforce Productivity, Innovation, Engagement
Multiple Chart
PwC/Strategy&
Saved
Features detailed tables and column charts comparing financial advisory, underwriting, and lending data. Layout is dense, utilizing a blue, gray, and white color palette.
Market Analysis and Trends
Financial Services
The slide details investment banking financial results with YoY comparisons and highlights, used for analyzing market trends and banking performance.
Investment, Banking, Financial, Results, Analysis, Market, Trends, Performance, Comparison, Advisory
Mixed Chart
Goldman Sachs
Saved
Two large blue panels with text and circular images depicting key areas of growth. Smaller images and bullet points elaborate on core strategies for enhancing digital capabilities.
Strategic Planning
Financial Services
Highlights strategic initiatives for business growth, focusing on digital enhancement and distribution optimization. These are aimed at maintaining a strong market position and driving future success.
Digital Capabilities, Partnerships, Growth
Table
Goldman Sachs
Saved
Bar charts and pie charts comparing organizational approaches to AI innovation (functional silos vs. cross-functional teams) across China, France, and USA.
Operational Efficiency
Professional Services
This slide discusses how driving AI innovation within functional silos can hinder activity, with comparative data on organizational approaches from China, France, and USA.
AI, innovation, functional silos, cross-functional teams, China, France, USA, comparison, bar charts, pie charts
Multiple Chart
BCG
Saved
Contains a bar chart comparing greenhouse gas emissions by country in Sub-Saharan Africa, using distinct colors for visual clarity and emphasis.
Regulatory and Compliance
Environmental Services & Sustainability
Details Nigeria's position among Sub-Saharan countries in greenhouse gas emissions, highlighting the need for renewable energy solutions like solar power.
GHG emissions, Nigeria, renewable energy, Sub-Saharan Africa, environmental impact
Single Chart
BCG
Saved
Slide shows multiple column charts with stages of digital transformation across two time points (last year and current), annotated with percentages.
Strategic Planning
Professional Services
Provides a snapshot of digital marketing transformation progress within companies, comparing past and present levels of integration.
digital transformation, marketing strategy, integration levels, progress tracking, bar chart
Multiple Chart
Deloitte
Saved
The slide contains a column chart and detailed lists of key drivers with explanatory notes. The layout is neatly organized for clear comprehension of complex financial information.
Financial Performance
Financial Services
Focuses on the financial performance of Macquarie Asset Management, particularly base and performance fees. It’s useful for financial reviews and assessing the impact of operating expenses on net income.
Asset Management, Performance Fees, Operating Expenses, Financial Review, Net Income
Mixed Chart
Goldman Sachs
Saved
A mixed chart with horizontal bars representing the proportion of organizations at different maturity stages in various sectors, along with a line chart showing the average maturity score for 2021 and 2022. Includes sector-specific analysis.
Market Analysis and Trends
Environmental Services & Sustainability
Evaluates the progress in emissions measurement and reduction across different sectors, noting a slight overall improvement. Highlights leaders and laggards in environmental maturity, useful for benchmarking and setting goals.
maturity index, sector analysis, progress, emissions reduction, benchmarking
Mixed Chart
BCG
Saved
Contains column charts and lists inside boxes detailing historical data and investment strategies.
Risk Assessment and Management
Financial Services
Highlights how principles of fiduciary mindset and insights contribute to navigating market events and client challenges, with growth data from pivotal market events.
Fiduciary, Market Events, Growth, Strategy
Multiple Chart
JP Morgan
Saved
The slide features two charts: a bar chart on investment universe and Latin American investor allocation, and a bar chart on sector exposure.
Market Analysis and Trends
Financial Services
The slide assesses local and global investment opportunities, with a focus on Latin American investors and sector-specific exposures within global markets.
local investing, global opportunities, Latin America, investor allocation, sector exposure, market analysis, investment strategies
Multiple Chart
JP Morgan
Saved
Slide shows a simple, structured layout with a list of strategic goals and initiatives aimed at expanding Experian's market presence.
Strategic Planning
Financial Services
Discusses Experian's mission to expand and innovate within the consumer data space, detailing strategies for financial inclusion and market leadership enhancement.
Experian, market leadership, consumer data, financial inclusion, innovation
Pillar
Barclays
Saved
This slide contains a column chart showing gross cost reductions (~13bn) by year-end 2026, with additional columns for reinvestment in infrastructure, growth, and net cost reduction. To the right, there are boxes listing investment priorities: improving client experience and investing in infrastructure, each with further details.
Financial Performance
Financial Services
The slide shows a plan to achieve a cost/income ratio below 70% by the end of 2026 through cost reductions and reinvestments. It highlights investment priorities in client experience and infrastructure. This slide can be used to present cost management strategies and investment plans to stakeholders.
investment, cost reduction, client experience, infrastructure, priorities
Mixed Chart
UBS
Saved
The slide showcases vertical column charts with a blue and grey color scheme, displaying the changes in private funding value across different sectors from 2019 to H1 2023 in the Philippines. Each sector is represented by a stacked column, showing the trend of funding before and after the pandemic peak, along with the number of deals. The layout is clear and informative, with a focus on presenting the data succinctly.
Investment Analysis
Financial Services
It illustrates the significant drop in private funding in the Philippines post-pandemic, with a specific focus on digital financial services. This slide serves as an analytical resource for investors and financial analysts to understand the impact of the pandemic on investment trends and to strategize for recovery and future funding allocations.
Funding, Pandemic, Philippines, Digital Financial Services, Investment Trends, Recovery, Analysis
Single Chart
Bain
Saved
The slide features sections on description, pros, cons, an overview of technology, and key feature estimates. It includes a simple diagram of the Haber-Bosch process and a box listing the conversion and reconversion costs and efficiencies of ammonia.
Product and Service Analysis
Energy & Utilities
This slide provides detailed information on the conversion of ammonia through the Haber-Bosch process. It highlights the advantages and disadvantages of using ammonia for hydrogen conversion, supported by key feature estimates.
Ammonia, Conversion, Hydrogen, Process, Analysis
Diagram
Kearney
Saved
The slide features a radar chart comparing South Korea’s tech metrics against the Asia average. Textual information on the left discusses South Korea’s leadership in digital infrastructure and cybersecurity.
Technology and Digital Transformation
Telecommunications
Describes South Korea’s advancements in technology, 5G coverage, and cybersecurity, with a focus on future developments like 6G and shared data centers.
5G, cybersecurity, digital infrastructure, South Korea, 6G
Mixed Chart
Deloitte
Saved
Image of a tree cross-section, with text discussing how organizations are redefining their purpose beyond profit.
Market Analysis and Trends
Professional Services
Explores how brands are shifting focus towards purpose-driven strategies, with insights from the Edelman Trust Barometer.
marketing, purpose, trends, strategy, organizations, branding, Edelman
Mixed Chart
Deloitte
Saved
The design is simple and clear, employing icons and bullet points to outline uncertainties associated with emerging software development trends. The use of colors distinguishes different areas of concern, with a good balance of text and visuals for a non-cluttered presentation of complex information.
Risk Assessment and Management
Technology & Software
This slide articulates the challenges and uncertainties faced by the next wave of software development technologies, including low-code platforms and AI-based testing. It's geared towards an audience looking for insights into potential obstacles in adopting these technologies on a larger scale.
Uncertainties, Software Development, Scale, Low-Code, AI, Risk Management
Header Horizontal
McKinsey
Saved
This slide features a three-column layout with clear headers in bold blue text. Each column is dedicated to a different energy technology—energy storage, energy distribution, and smart grid. Below each header is a short text description and an illustrative image of the respective technology. The color scheme is blue, white, and black, providing a professional look.
Market Analysis and Trends
Energy & Utilities
The slide compares three key technologies impacting the future of clean energy: battery storage systems, electric vehicle charging infrastructure (EVCI), and smart grids. It highlights the price decline in lithium-ion batteries, the need for extensive EV charging networks, and the benefits of a smart, integrated grid system that offers real-time insights. Aimed at professionals in the energy sector, this slide serves as an informative summary of recent advancements and considerations for integrating these technologies into the energy ecosystem.
energy storage, EVCI, smart grid, lithium-ion batteries, charging network, real-time insights, clean energy, infrastructure, technology comparison, grid integration
Header Horizontal
McKinsey
Saved
The slide features charts and graphs on performance metrics, quality & security, and automation, illustrating improvements in coding hours, reduction in incidents, and increased automation.
Performance Metrics and KPIs
Technology & Software
This slide highlights the impact of tool chain telemetry on improving coding output, quality, and market delivery time, with specific metrics and visualizations.
telemetry, coding output, quality, security, automation, performance metrics, KPIs, coding hours, incidents reduction, market delivery
Multiple Chart
Credit Suisse
Saved
The slide displays pie charts reflecting the funding mix in 2015, 2019, and the medium-term. A breakdown sidebar shows the strategic deposit growth areas: consumer, private bank, institutional, and central channels.
Investment Analysis
Financial Services
Examines the evolution of Goldman Sachs' funding mix, detailing the strategic increase in deposits and the consequent improvement in funding costs through clear visual representations. The focus is on diversification and the role of strategic business channels in this growth.
funding mix, strategic growth, deposits, finance, diversification
Multiple Chart
Goldman Sachs
Saved
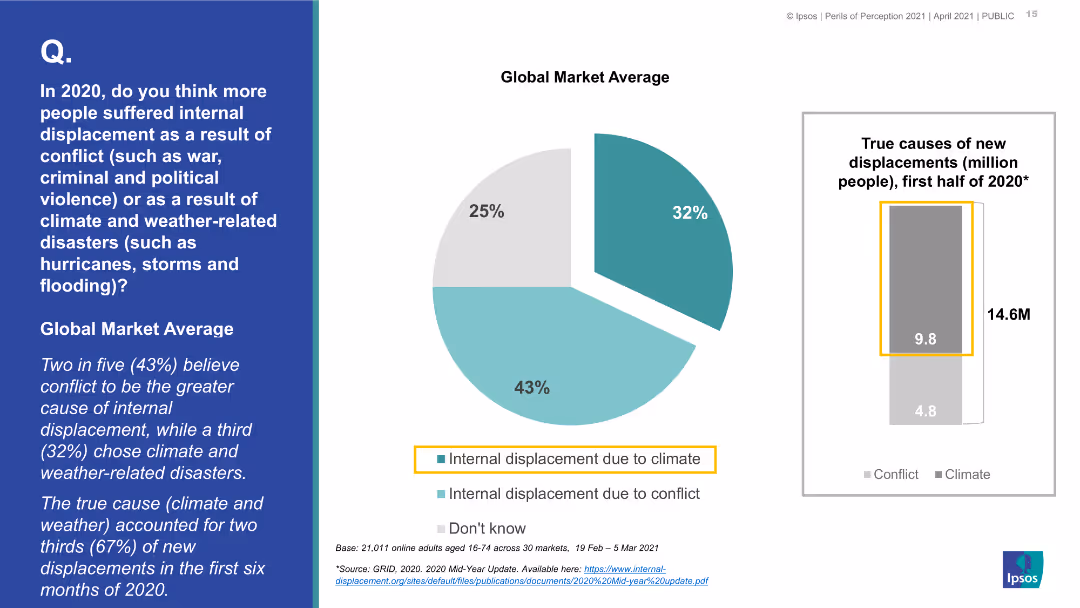
A comparative bar chart showing the perceived causes of internal displacement (conflict vs. climate/weather-related) for various countries, with Great Britain highlighted.
Market Analysis and Trends
Environmental Services & Sustainability
This slide contrasts public perceptions across different countries regarding the primary causes of internal displacement in 2020, comparing conflict and climate/weather-related disasters, with Great Britain highlighted.
internal displacement, conflict, climate disasters, public perception, country comparison, Great Britain
Multiple Chart
IPSOS
Saved
Previous
Next
If nothing, comes up, please save your slides first
Create a FREE account to continue browsing
Receive Instant Access to 1,000+ slides from companies like McKinsey, Google, and Goldman Sachs
First Name
Last Name
Email
Password
I agree to all
Terms & Privacy Policy
Thank you! Your submission has been received!
Oops! Something went wrong while submitting the form.
Have an account?
Sign in
Column Chart
Heatmap
Chevron
Org Chart
Infographic
Callouts
Timeline
List
Graphic
Picture
Process Flow
Diagram
Paragraph
Map
Table
Framework
Subtitle
Takeaway Box
Icon
Other Chart
Radar Chart
Waterfall Chart
Mekko Chart
Pie Chart
Scatter Plot
Line Chart
Bar chart
Bullet points