My Account
My Slides
Search by Category
Templates
Leave Feedback
Login
Logout
Get Started
Browse all Slides
Browse all Slides
Create a FREE Account
Instant access to 1,000+ real slides from top companies like McKinsey, BCG, Goldman Sachs, Google and many more!
First Name
Last Name
Email
Password
I agree to all
Terms & Privacy Policy
Thank you! Your submission has been received!
Oops! Something went wrong while submitting the form.
Have an account?
Sign in
Saved Slides
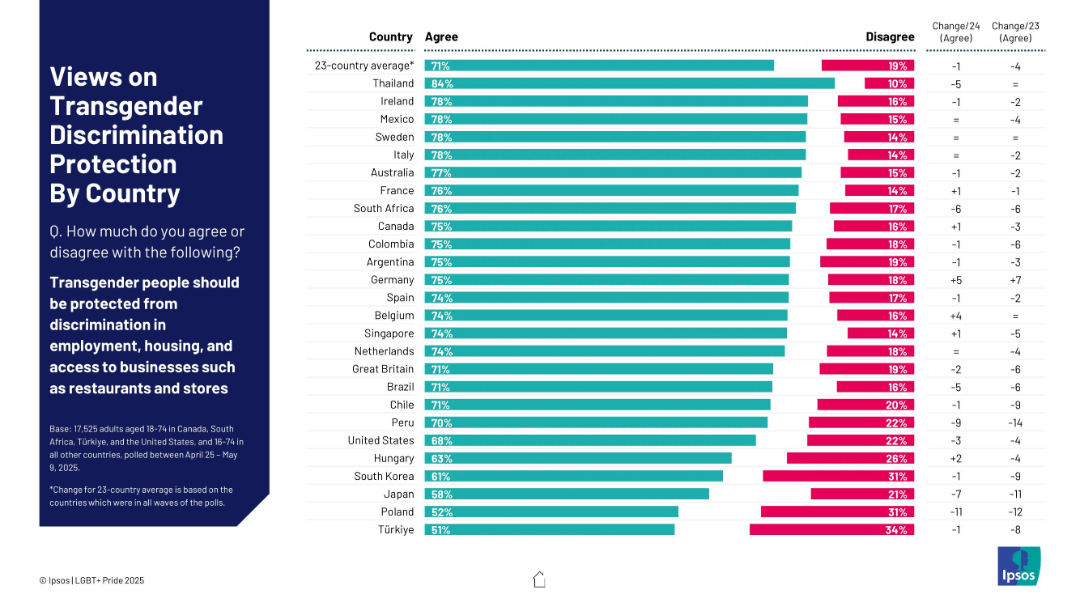
Horizontal bar chart by country; comparison of agreement/disagreement levels
Market Analysis and Trends
Government & Public Sector
This slide examines public agreement on protecting transgender individuals from discrimination in work and business settings. Thailand shows the highest agreement (84%), while Türkiye and Poland have the lowest (51%–52%). Changes over two years reflect regional policy shifts and public sentiment evolution.
transgender rights, discrimination, workplace, agreement, international, social attitudes, Ipsos
Mixed Chart
IPSOS
Saved
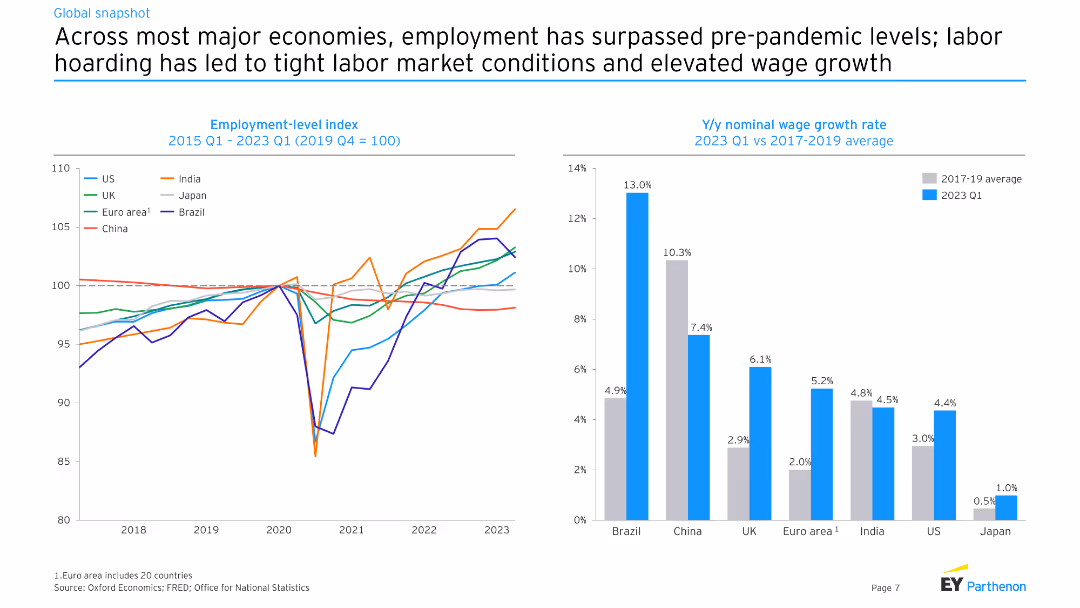
This slide includes two charts: one showing the employment-level index from 2015 to 2023 for various economies, and another showing year-over-year nominal wage growth rate in 2023 Q1 versus 2017-2019 average.
Market Analysis and Trends
Financial Services
The slide analyzes employment trends and wage growth across major economies, highlighting the tight labor market conditions and the impact of labor hoarding post-pandemic on wage growth.
employment, wage growth, economy, labor market
Multiple Chart
EY
Saved
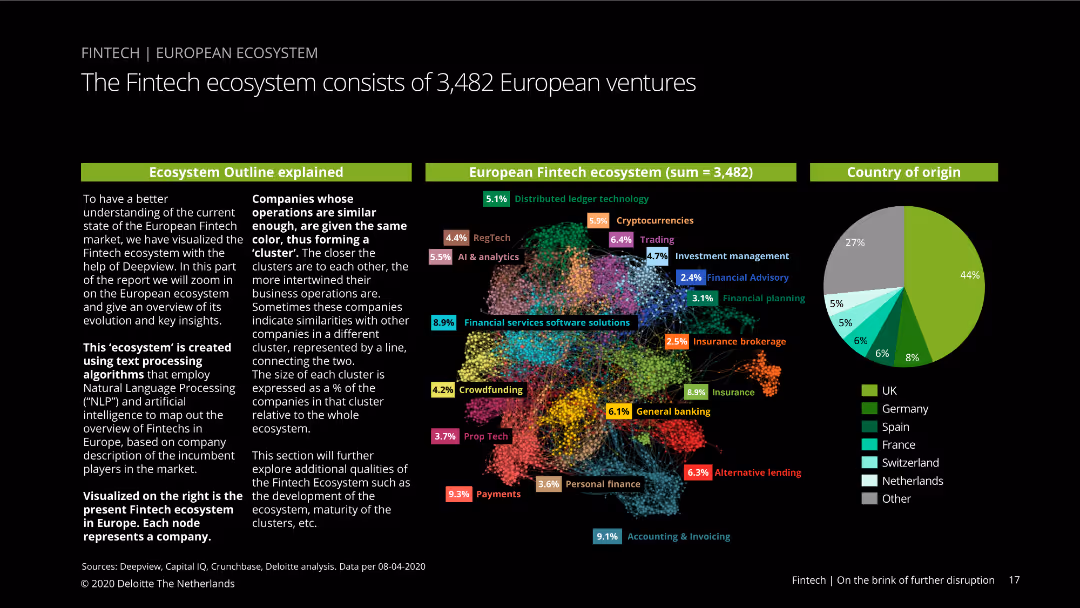
Visual ecosystem map showing clusters of European fintech companies, with a pie chart indicating country origins. Nodes are color-coded by business operations similarity.
Market Analysis and Trends
Financial Services
Provides an overview of the European fintech ecosystem, including the number of ventures, business operation clusters, and country origins, with insights into market trends and growth.
fintech, ecosystem, Europe, ventures, clusters, business operations, country origin, market trends, Deepview, Capital IQ
Mixed Chart
Deloitte
Saved
The slide comprises three charts: a column chart for real GDP, and two line charts for consumption and investment, and international trade data.
Market Analysis and Trends
Financial Services
This slide reviews Chile's economic situation, focusing on real GDP changes, consumption and investment trends, and international trade as of 4Q23.
Chile, economic snapshot, GDP, consumption, investment, trade
Multiple Chart
JP Morgan
Saved
Features a column chart with data annotations displaying investments in unicorns across sectors, accompanied by textual analysis. The design is straightforward with clear data presentation.
Investment Analysis
Technology & Software
Examines investment trends in Southeast Asia's unicorn companies, focusing on their collective move towards profitability and the influence of private funding.
unicorns, investment, SEA, profitability
Mixed Chart
Bain
Saved
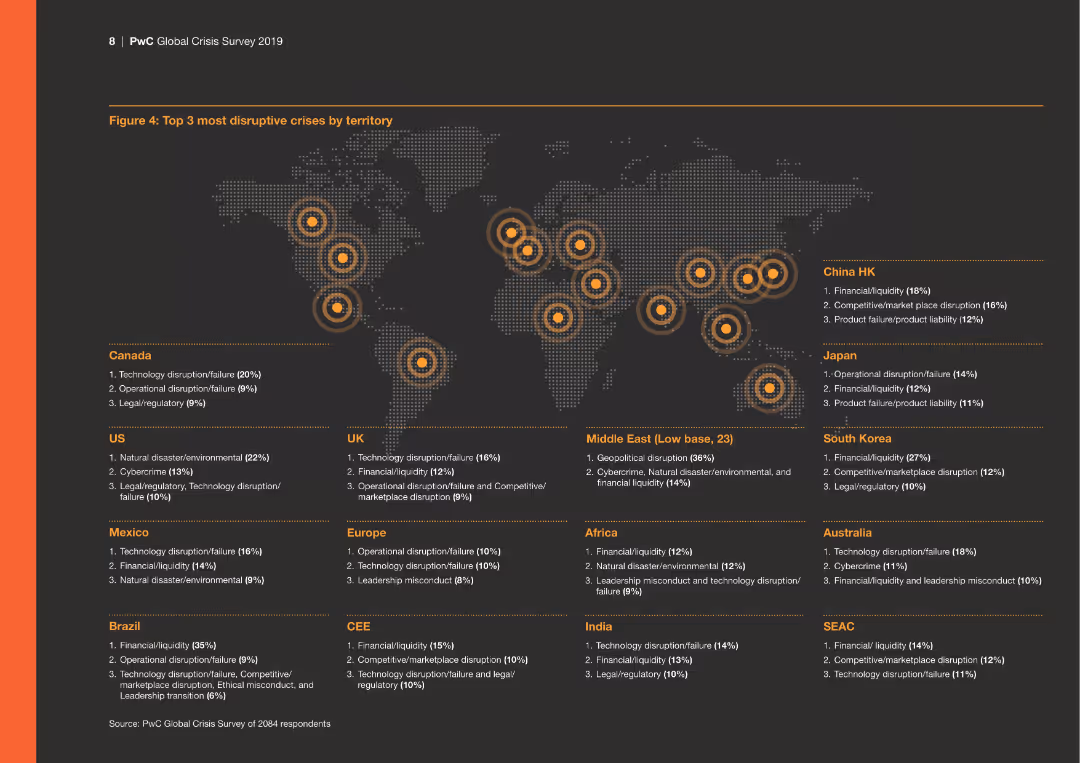
The slide presents a world map with highlighted regions indicating the top three most disruptive crises per territory, with corresponding crisis types listed below the map.
Risk Assessment and Management
Financial Services
This slide provides a regional breakdown of the most disruptive crises, illustrating how different areas are affected by various crisis types such as tech failure and cybercrime.
Regional crises, technology failure, cybercrime, financial, operational
Graphic
PwC/Strategy&
Saved
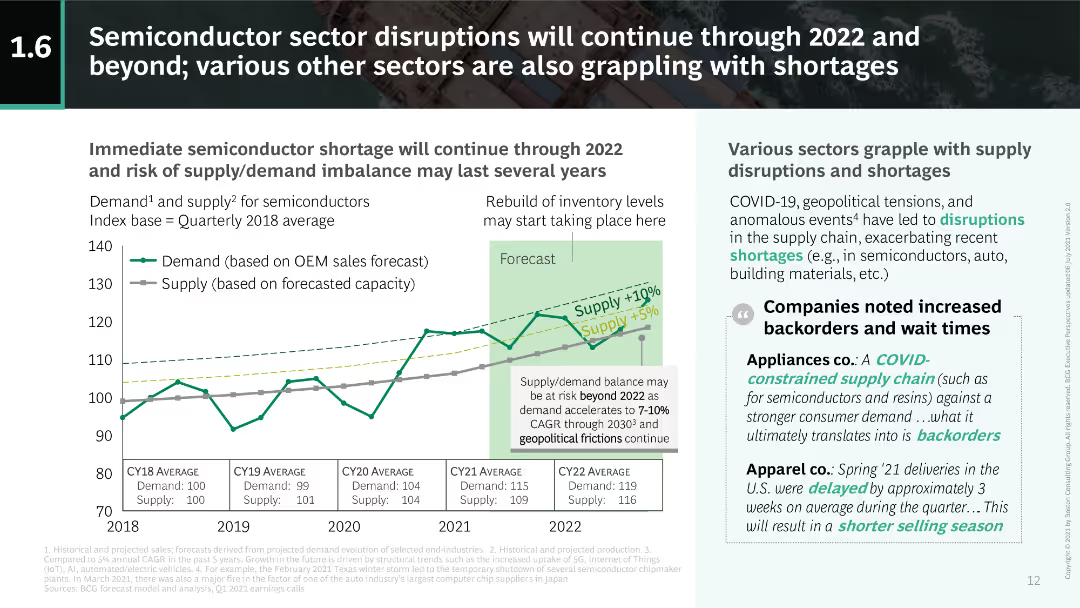
This slide includes a dual-axis line chart showing demand and supply indices for semiconductors from 2018 to 2022. Text on the right discusses broader sector impacts due to disruptions.
Risk Assessment and Management
Technology & Software
The slide details the ongoing semiconductor shortages and their impact across various sectors, emphasizing the supply-demand imbalance and its long-term implications.
semiconductors, supply-demand, shortages, disruptions, 2022
Mixed Chart
BCG
Saved
This slide features a world map indicating the company's global presence with specific locations marked. There's a notable emphasis on the company's international reach, complemented by minimal text.
Market Analysis and Trends
Financial Services
The slide visually represents the company's extensive global network, indicating sales within 100 countries and the locations of various facilities. It is used to demonstrate the company's market reach and international operations.
global, mining, business network, market presence, international sales
Graphic
Morgan Stanley
Saved
Bar charts detailing EV charging station penetration and infrastructure types.
Market Analysis and Trends
Energy & Utilities
Evaluates India's EV charging infrastructure development and market opportunities.
EV charging, infrastructure, India, market growth, investment
Mixed Chart
PwC/Strategy&
Saved
Slide with a column chart comparing podcast ad revenue shares by content genre from 2020 to 2021, highlighting top genres like News, Comedy, and Society & Culture.
Market Analysis and Trends
Media & Entertainment
Reviews the popularity and revenue generation of different podcast genres, noting significant growth in ad revenue for sports post-COVID.
Podcast, Genres, Revenue, Trends, Sports
Single Chart
PwC/Strategy&
Saved
Slide with bar charts and diagrams showcasing digital customer service innovations in the energy sector, including examples like PowerShop.
Customer and Market Segmentation
Energy & Utilities
Discusses how digital innovation can transform customer services in the energy sector, offering integrated solutions and energy management.
customer services, digital innovation, energy sector, integrated solutions, PowerShop, energy management
Mixed Chart
Accenture
Saved
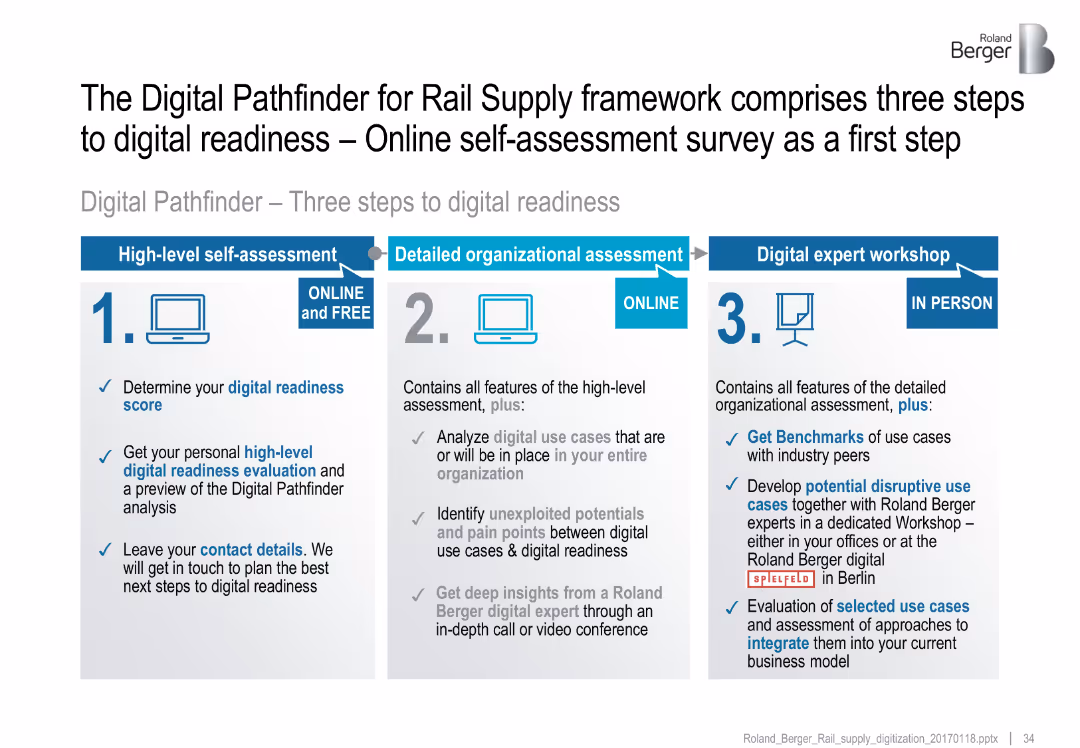
Three-column process flow; each column explains a step in the assessment from self-check to workshop
Technology and Digital Transformation
Transportation & Logistics
Outlines a three-step framework for assessing digital readiness in rail: self-assessment, organizational review, and expert workshop with benchmarks and disruptive use case planning.
digital transformation, assessment, Pathfinder, benchmarking, disruptive use cases
Linear Flow
Roland Berger
Saved
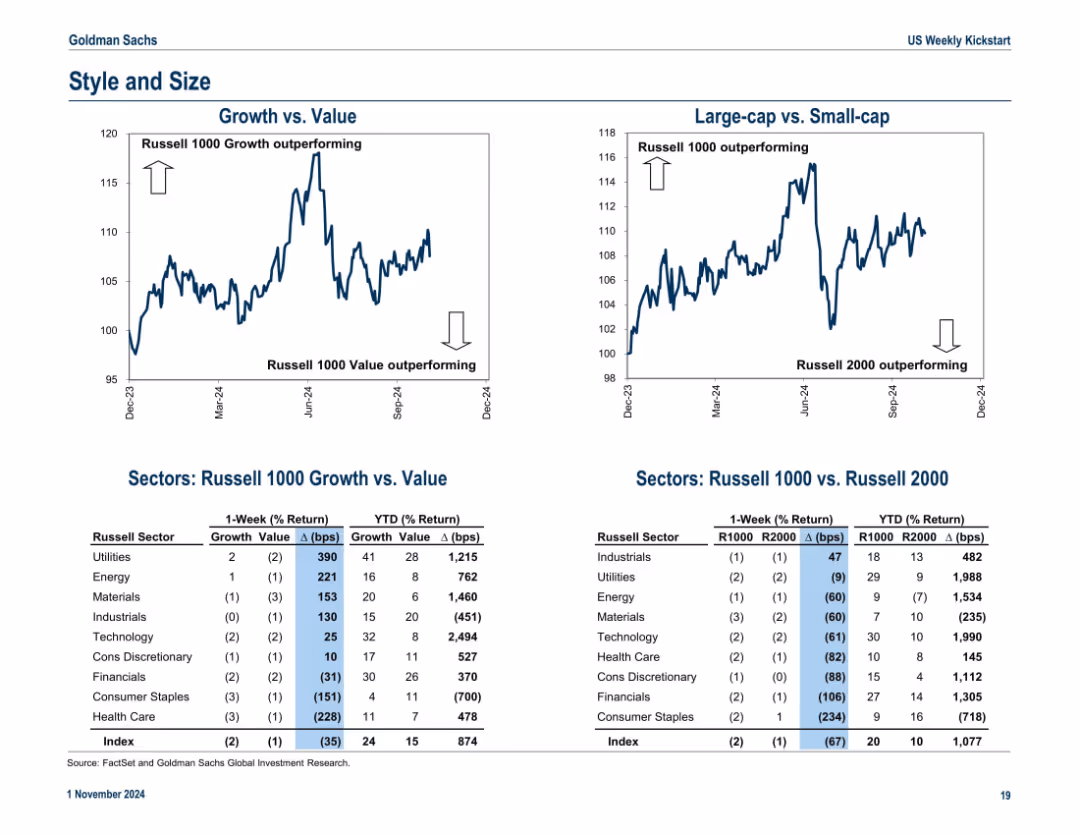
Two line charts comparing growth vs. value and large-cap vs. small-cap, accompanied by detailed performance tables by Russell sectors
Strategic Planning
Financial Services
Evaluates equity style and size rotation trends using Russell indices, along with performance data by sector. Growth and large-cap have outperformed year-to-date.
growth vs value, Russell 1000, Russell 2000, style rotation, sector return
Multiple Chart
Goldman Sachs
Saved
The slide includes a scatter plot chart showing upcoming CCUS clusters by operational year and region.
Strategic Planning
Energy & Utilities
This slide shows the expected development of cross-industries CCUS clusters in Europe and North America.
CCUS, clusters, Europe, North America, operational year
Single Chart
Kearney
Saved
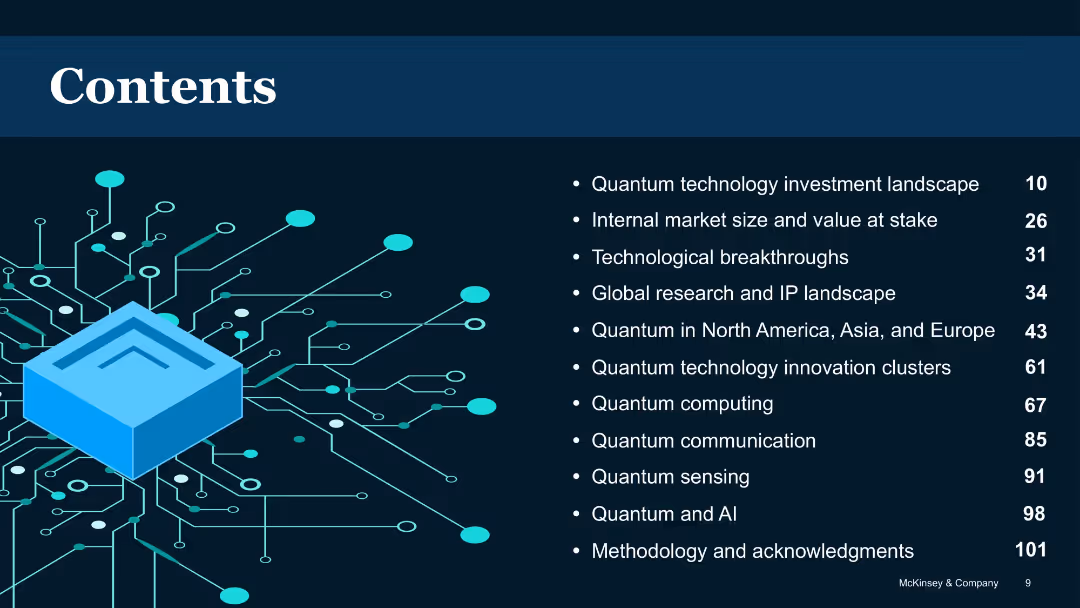
Dark background with blue circuit illustration and list-style table of contents
Industry Overview
Artificial Intelligence
Provides a structured overview of the report’s sections, including topics like investment landscape, technological breakthroughs, global perspectives, and specific quantum technologies like computing, sensing, and communication.
Table of contents, report structure, quantum sections, chapter list
Agenda
McKinsey
Saved
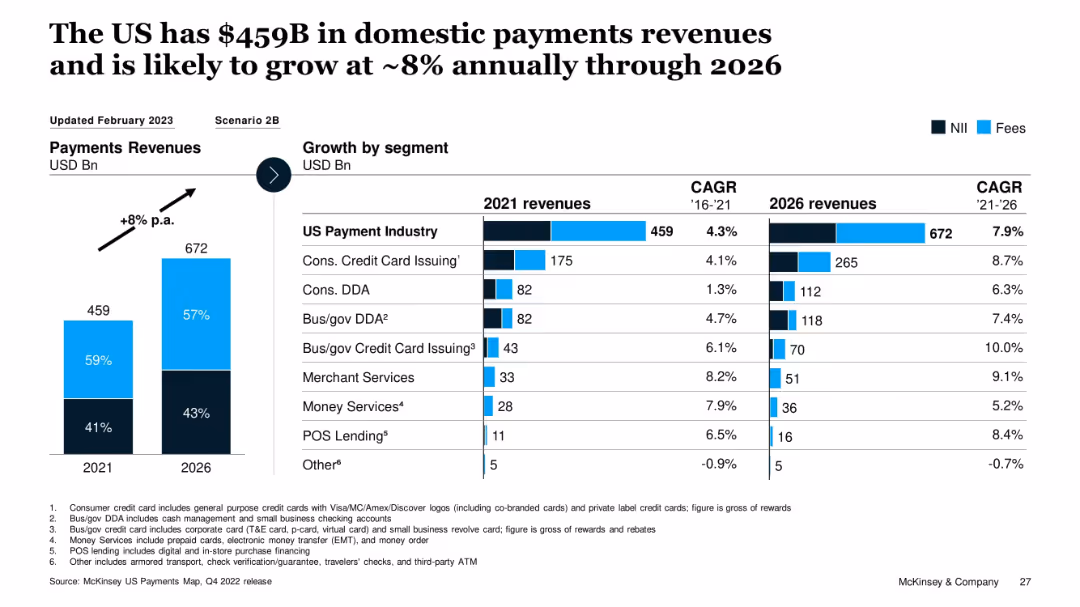
Vertical bar graph with growth projections and CAGR table by segment; color-coded NII and Fees split
Market Analysis and Trends
Financial Services
This slide shows the current and projected revenue for the US payments industry, expecting growth from $459B in 2021 to $672B by 2026 (~8% CAGR). It breaks down growth by segment, with high growth seen in POS Lending, Merchant Services, and Bus/gov Credit Card Issuing. Segment-wise CAGR from 2021–2026 is also provided.
payments, revenue growth, POS, CAGR, segments, forecast, McKinsey, fees, interest income, US market
Multiple Chart
McKinsey
Saved
The slide features a header, a text block on the left, and a column chart on the right. The column chart presents survey data on racial factors in patient experience, comparing agreement levels on respectful treatment, comfort in disclosing personal information, and the impact of provider's race on patient comfort, using multiple colors.
Strategic Planning
Healthcare & Pharmaceuticals
Discusses the importance of better research in reducing healthcare inequities. The column chart shows survey results on how race impacts patient experience, highlighting areas for improvement in respectful treatment, comfort in disclosing information, and patient comfort with racially concordant providers.
Healthcare, research, inequity, race, patient experience
Mixed Chart
IPSOS
Saved
Column chart detailing the adoption of digital solutions in patient administration, treatment, and post-discharge monitoring in SEA hospitals.
Technology and Digital Transformation
Healthcare & Pharmaceuticals
This slide highlights the higher adoption of digital solutions in SEA hospitals for patient management, treatment, and post-discharge monitoring.
Digital solutions, SEA hospitals, patient management, treatment, monitoring
Multiple Chart
LEK
Saved
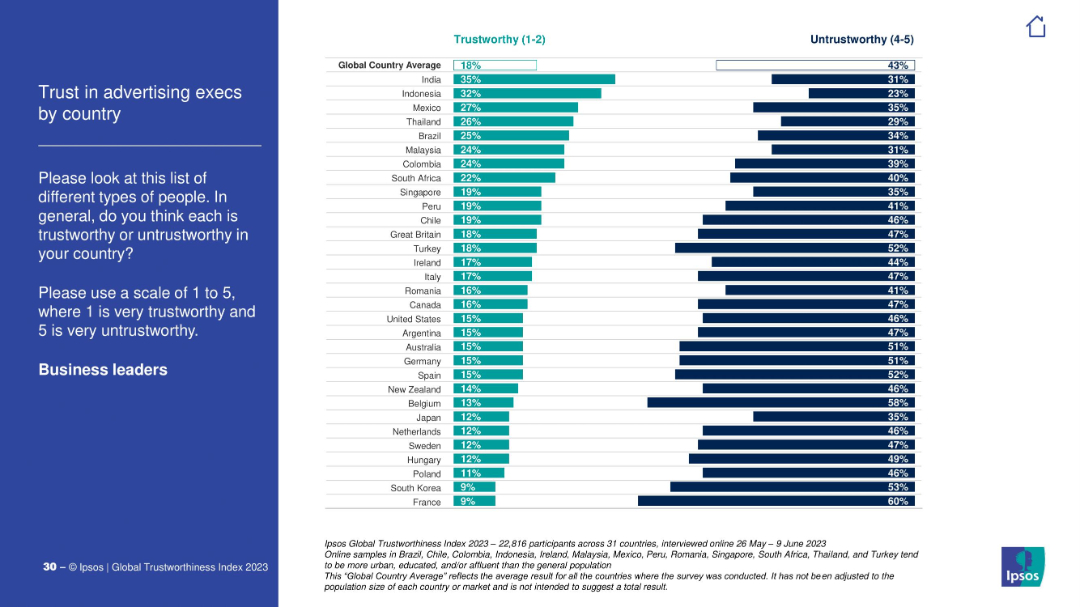
Blue-on-white survey context left; right panel shows country-wise breakdown of trust in advertising executives.
Customer and Market Segmentation
Media & Entertainment
The chart explores how advertising executives are perceived globally. India and Indonesia show relatively high trust; France and South Korea are at the bottom.
advertising, marketing, execs, trustworthiness, Ipsos, branding, media, perception
Mixed Chart
IPSOS
Saved
A dual-axis line chart shows the percentage of banks tightening lending standards over time, contrasting US and Eurozone conditions. The slide background is white with grey recession markers.
Risk Assessment and Management
Financial Services
The slide compares credit conditions between the US and Eurozone, highlighting the risks associated with tighter lending standards. It is used to convey the potential impacts on financial stability and market conditions, likely serving as a risk assessment tool for investors or policy-makers.
Credit, US, Eurozone, Banks, Lending, Risk, Recession, Standards, 2023
Multiple Chart
JP Morgan
Saved
The slide features a column chart detailing the energy consumption forecast for the energy sector by subsectors (power, heat) from 2018 to 2040 under a stated policies scenario. It highlights the cumulative growth of biomass in energy industries and contributions from different fuel types.
Market Analysis and Trends
Energy & Utilities
This slide forecasts energy consumption within the energy sector, emphasizing the role of bioenergies in decarbonizing and electrifying the sector, and projecting the contributions from biomass, fossil fuels, nuclear, and renewables by 2040.
energy sector, consumption forecast, subsectors, power, heat, biomass, fossil fuels, nuclear, renewables
Single Chart
Kearney
Saved
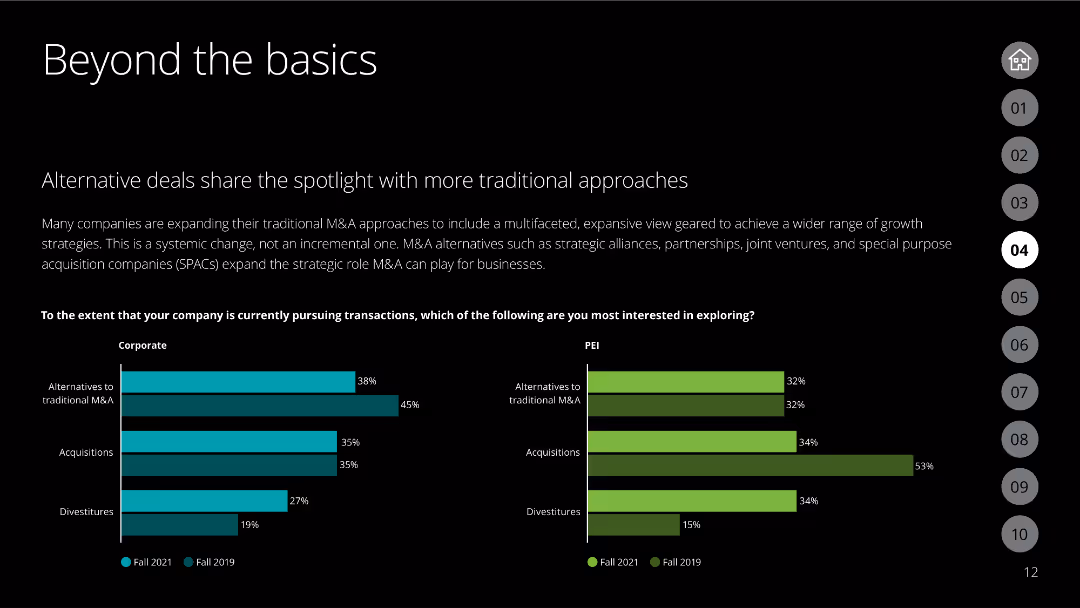
The slide features a column chart comparing corporate and PEI interests in different M&A transaction types in 2021 vs. 2019.
Market Analysis and Trends
Financial Services
Discusses the interest in traditional vs. alternative M&A strategies among corporations and PEIs.
M&A strategies, corporate, PEI, alternative deals, traditional M&A
Multiple Chart
Deloitte
Saved
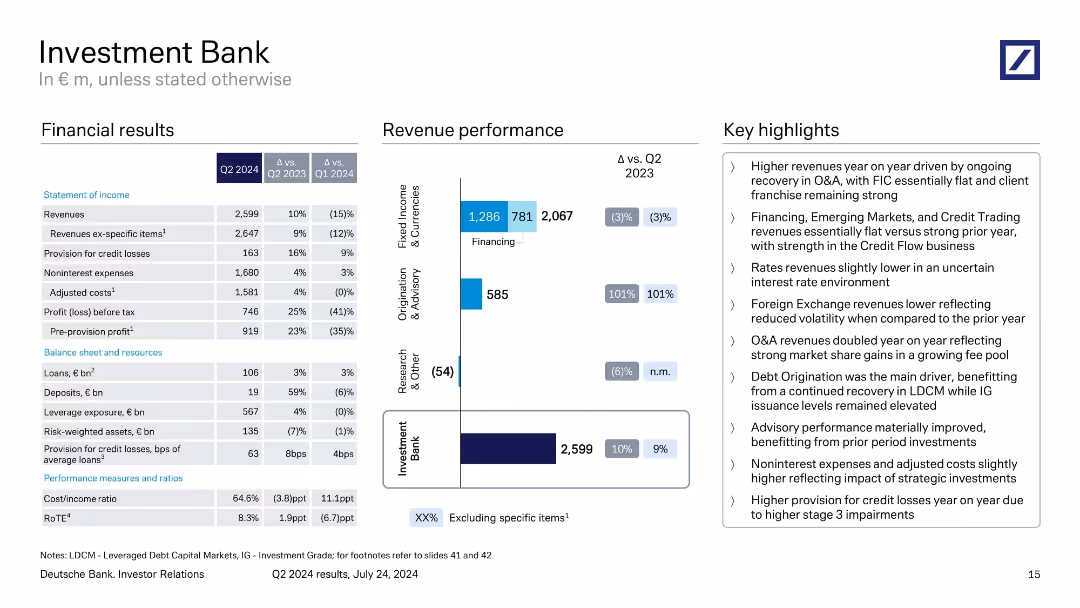
Three-column layout: financial results table on the left, bar chart in the center showing revenue performance by business line, and bullet-point highlights on the right. Corporate branding and subdued blue-gray color palette.
Financial Performance
Financial Services
Presents Q2 2024 results for the Investment Bank division, showing a 10% YoY revenue increase, flat financing results, and 101% YoY growth in Origination & Advisory. Highlights include stable client franchise, reduced volatility in FX, and cost control efforts.
Q2 2024, investment bank, revenues, financing, credit losses, costs, FIC
Mixed Chart
Deutsche Bank
Saved
Slide contains several vertical column charts, comparing different financial metrics such as Earnings Growth, P/E ratio, ROE, and Dividend Yield of the S&P 500.
Financial Performance
Financial Services
This slide is designed for financial professionals assessing short-term investment performance, with detailed comparison across key financial metrics of the S&P 500 index.
S&P 500, Financial Analysis, ROE, P/E Ratio, Dividend Yield, Earnings Growth, 1-Month Return, Column Chart
Multiple Chart
Morgan Stanley
Saved
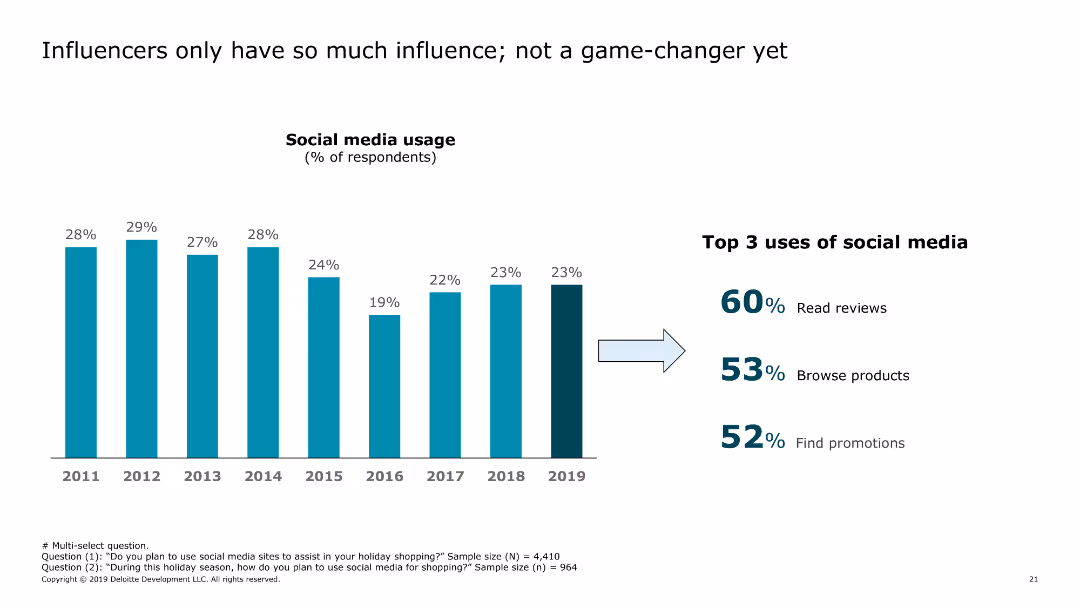
The slide includes a bar chart showing the percentage of respondents using social media for holiday shopping, with top uses listed beside the chart.
Market Analysis and Trends
Retail & E-commerce
The slide examines how consumers use social media during holiday shopping, focusing on reading reviews, browsing products, and finding promotions.
social media, holiday shopping, consumer behavior, retail, e-commerce, trends, 2019, social media usage, promotions, reviews
Single Chart
Deloitte
Saved
Previous
Next
If nothing, comes up, please save your slides first
Create a FREE account to continue browsing
Receive Instant Access to 1,000+ slides from companies like McKinsey, Google, and Goldman Sachs
First Name
Last Name
Email
Password
I agree to all
Terms & Privacy Policy
Thank you! Your submission has been received!
Oops! Something went wrong while submitting the form.
Have an account?
Sign in
Column Chart
Heatmap
Chevron
Org Chart
Infographic
Callouts
Timeline
List
Graphic
Picture
Process Flow
Diagram
Paragraph
Map
Table
Framework
Subtitle
Takeaway Box
Icon
Other Chart
Radar Chart
Waterfall Chart
Mekko Chart
Pie Chart
Scatter Plot
Line Chart
Bar chart
Bullet points