My Account
My Slides
Search by Category
Templates
Leave Feedback
Login
Logout
Get Started
Browse all Slides
Browse all Slides
Create a FREE Account
Instant access to 1,000+ real slides from top companies like McKinsey, BCG, Goldman Sachs, Google and many more!
First Name
Last Name
Email
Password
I agree to all
Terms & Privacy Policy
Thank you! Your submission has been received!
Oops! Something went wrong while submitting the form.
Have an account?
Sign in
Saved Slides
The slide contains two column charts. The left chart shows the contribution to UK real GDP growth by different sectors. The right chart displays UK Purchasing Managers' Indices (PMI) over time. The charts are detailed and use various colors to distinguish data categories.
Market Analysis and Trends
Financial Services
The slide analyzes the UK's GDP growth and business activity through sector contributions and PMI trends, essential for economic analysis and business strategy.
UK GDP, business surveys, PMI, sector growth, economic analysis
Multiple Chart
JP Morgan
Saved
The slide features two column charts. The upper chart shows total PE/VC investments in agriculture from 2018 to Jan-23. The lower chart details deal types by the number of deals and investment values in US$m. The charts use blue and orange to differentiate data points.
Market Analysis and Trends
Agriculture & Food Production
This slide focuses on PE/VC investment trends in the agriculture sector from 2018 to January 2023. It provides an overview of total investment values and the number of deals over the years, along with a detailed breakdown of deal types and their respective values.
PE/VC, investment trends, agriculture, deal types, financial data, investment values, number of deals, market trends, sector analysis, financial services
Multiple Chart
EY
Saved
World map showing required emission reduction percentages by 2050 for major countries, with specific targets highlighted for each. The slide uses clear labeling and contrasting colors for different targets.
Regulatory and Compliance
Environmental Services & Sustainability
Outlines the necessary emission reductions by 2050 for major countries to align with climate goals, emphasizing the varied targets across different nations. Useful for discussing policy adjustments and international agreements aimed at combating climate change.
Emission reduction, 2050, Targets, Climate goals, Policy
Graphic
BCG
Saved
This slide includes two line graphs tracking investor focus over time.
Investment Analysis
Financial Services
Depicts how investor priorities between long-term and short-term results fluctuated from 2020 to 2023, reflecting a shift towards long-term investments during COVID-19.
investors, long-term, short-term, focus, trends
Mixed Chart
BCG
Saved
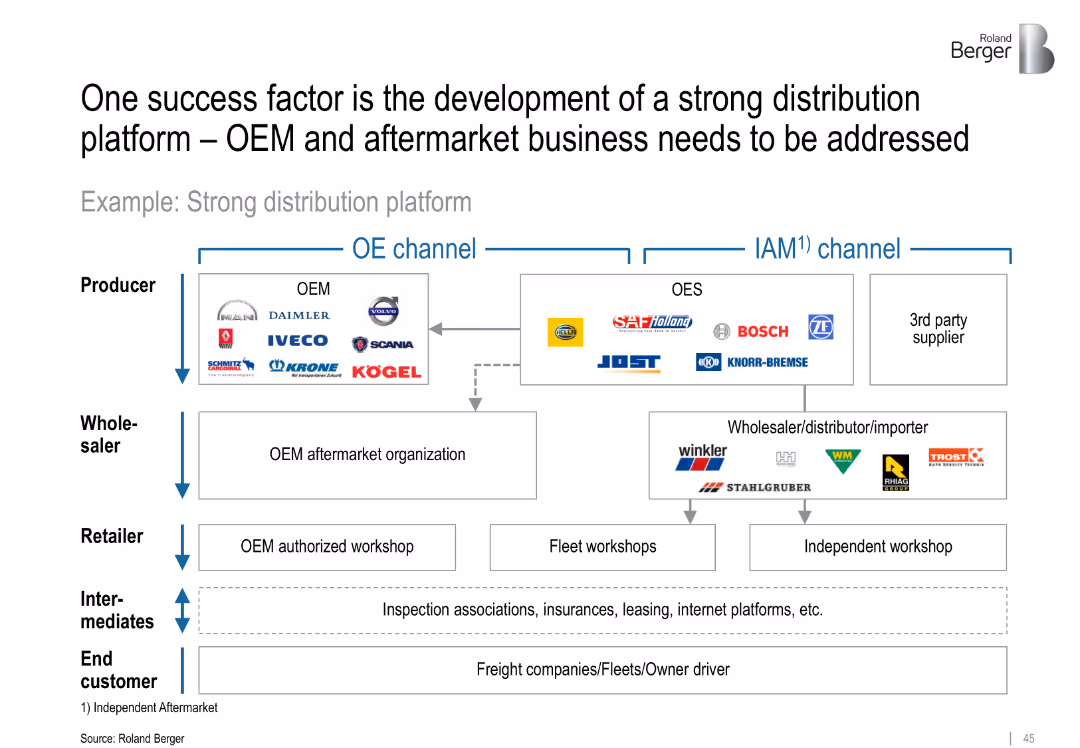
Flow diagram showing structure of OEM and IAM (aftermarket) distribution channels; includes producers, wholesalers, retailers, and end customers
Sales and Business Development
Transportation & Logistics
Describes the value chain in the commercial vehicle component market, emphasizing the importance of robust OEM and IAM distribution platforms. Shows how players like JOST, SAF Holland, and Bosch interact across levels.
distribution platform, OEM, IAM, aftermarket, value chain, sales strategy, component flow, channel structure
Diagram
Roland Berger
Saved
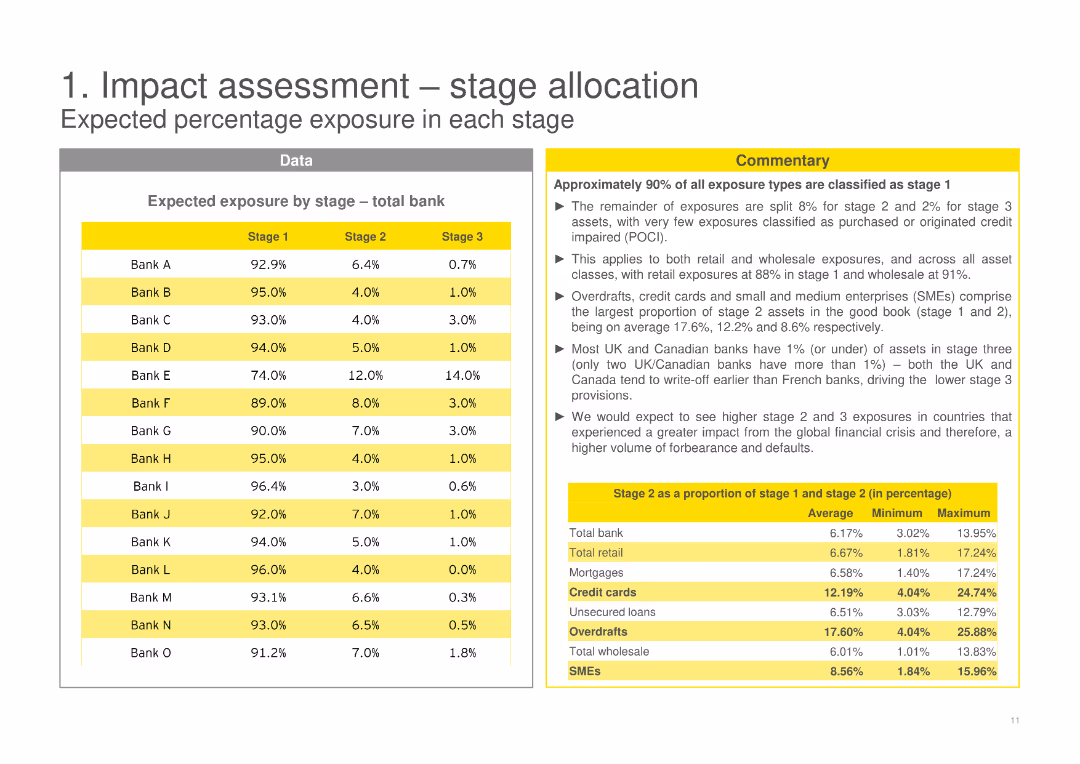
The slide contains a table and textual commentary on expected percentage exposure by stage (total bank), highlighting different banks' exposure levels.
Risk Assessment and Management
Financial Services
Provides expected percentage exposure by stage for various banks, highlighting the distribution across different stages (1, 2, 3).
stage allocation, percentage exposure, total bank, stage 1, stage 2, stage 3, IFRS 9, data-driven
Table
EY
Saved
Line charts tracking company performance metrics over several years, with highlights on recent increases. Colors are purple and grey.
Financial Performance
Financial Services
Provides a long-term view of company performance metrics, highlighting significant growth in the recent period.
long-term, performance, growth, financial services, trends, metrics
Single Chart
Deloitte
Saved
The slide contains pie charts and a table detailing plans for automation in HCP engagement by company size and the types of software solutions preferred.
Strategic Planning
Healthcare & Pharmaceuticals
This slide discusses future automation plans within companies for HCP engagement, focusing on the scale of the companies and their software preferences.
automation, company size, software solutions, HCP engagement, strategic planning
Multiple Chart
Deloitte
Saved
A bar chart with segments showing digital consumer population in SEA countries for 2021 and new digital consumers in 2022.
Market Analysis and Trends
Retail & E-commerce
Examines Indonesia's leading position in SEA's digital consumer base for 2021, with added numbers for 2022, providing a quick comparative regional analysis.
Indonesia, digital consumers, SEA, market analysis, growth trend
Single Chart
Bain
Saved
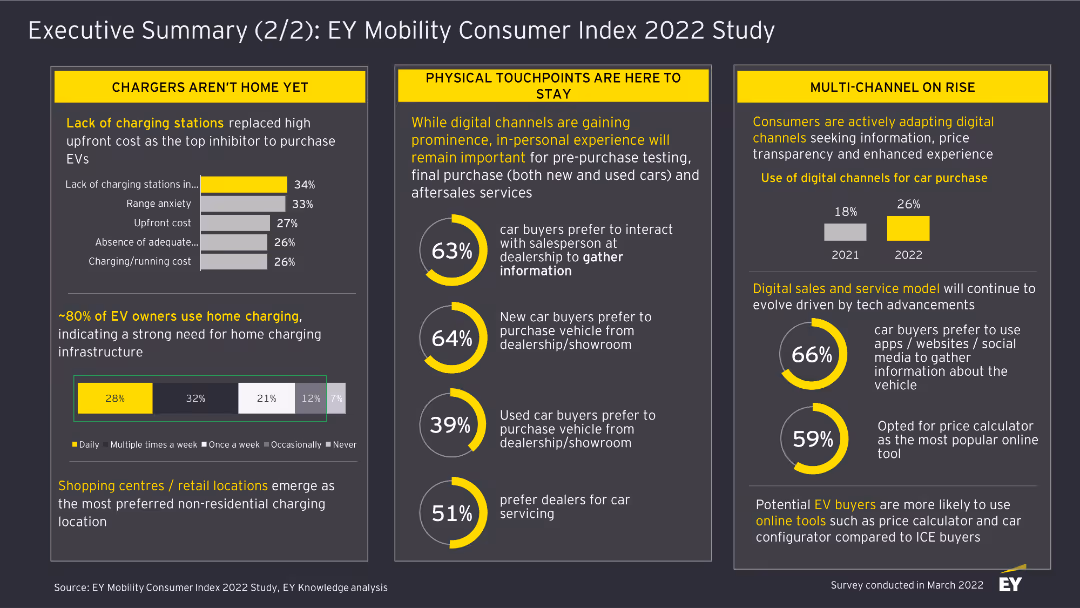
This slide includes column charts and textual highlights. It discusses the challenges in EV adoption, the importance of physical touchpoints, and the rise of digital channels for car purchases.
Market Analysis and Trends
Transportation & Logistics
The slide summarizes findings from the EY Mobility Consumer Index 2022 Study, focusing on barriers to EV adoption, the role of physical touchpoints, and the increasing use of digital channels in car buying.
EV Adoption, Physical Touchpoints, Digital Channels, Car Buying, Transportation, Market Analysis, 2022, Survey, Consumer Trends
Multiple Chart
EY
Saved
Slide features a purple header with title and three sections in purple, pink, and dark purple blocks, containing column charts and lists of companies with financials and market status details.
Industry Overview
Agriculture & Food Production
Compares FoodTech unicorn companies across Europe, Americas, and Asia, highlighting market values and growth in companies like Delivery Hero, UberEats, and Meituan Dianping. Showcases investment trends and significant company valuations in the FoodTech sector.
FoodTech, Unicorns, Europe, Americas, Asia, Market Value, Company Growth, Investment
Mixed Chart
Accenture
Saved
Features three distinct sections with icons and images corresponding to the content, using a clean and structured layout for clear communication.
Strategic Planning
Environmental Services & Sustainability
Continues the executive summary by detailing significant investment opportunities in forest conservation, the built environment, and sustainable farming in SEA.
Investment opportunities, forest conservation, built environment, sustainable farming, SEA
Text Only
Bain
Saved
This slide consists of column chart and text sections detailing forward catalysts for growth. The layout is straightforward, with a focus on financial data and key strategic areas.
Operational Efficiency
Financial Services
This slide illustrates the financial growth in management fees and highlights key areas for further expansion, such as workplace wealth and sustainability. It is suitable for discussing the operational scale and potential areas for business growth.
asset management, wealth management, CAGR, Goldman Sachs, management fees, expansion, sustainability
Mixed Chart
Goldman Sachs
Saved
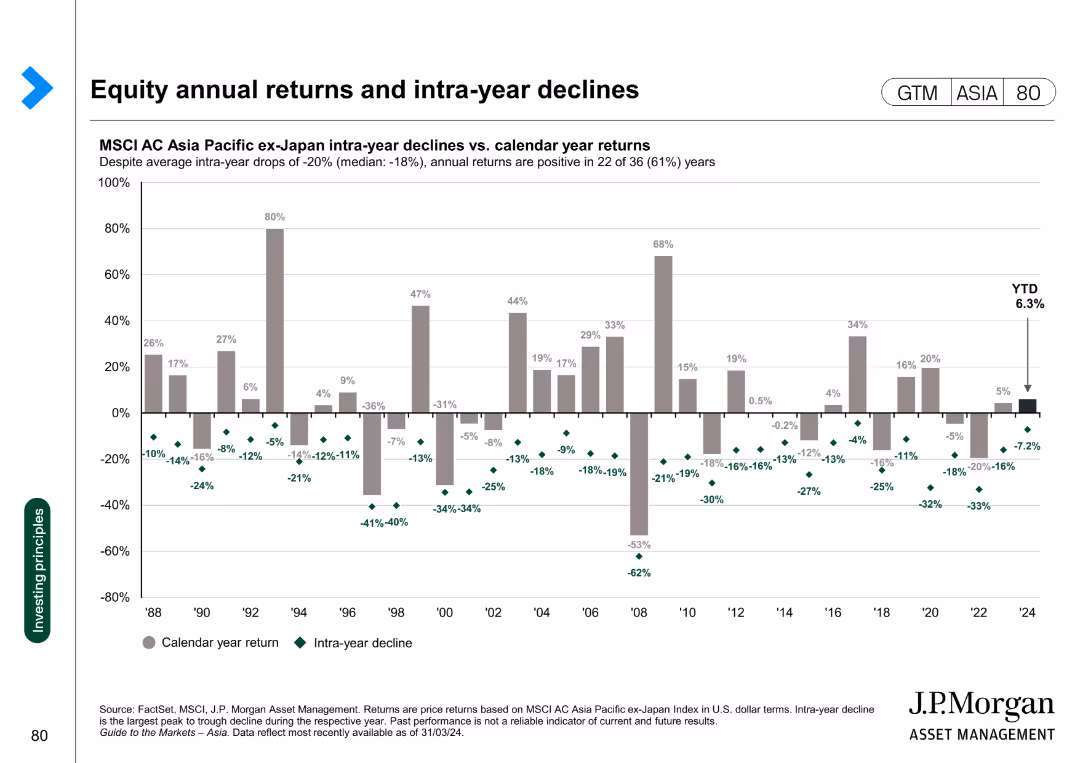
Column chart showing the intra-year declines versus calendar year returns for the MSCI AC Asia Pacific ex-Japan Index from 1988 to 2024.
Financial Performance
Financial Services
This slide analyzes the annual returns and intra-year declines of the MSCI AC Asia Pacific ex-Japan Index, highlighting the volatility and overall performance over the years.
equity, returns, declines, MSCI, volatility
Single Chart
JP Morgan
Saved
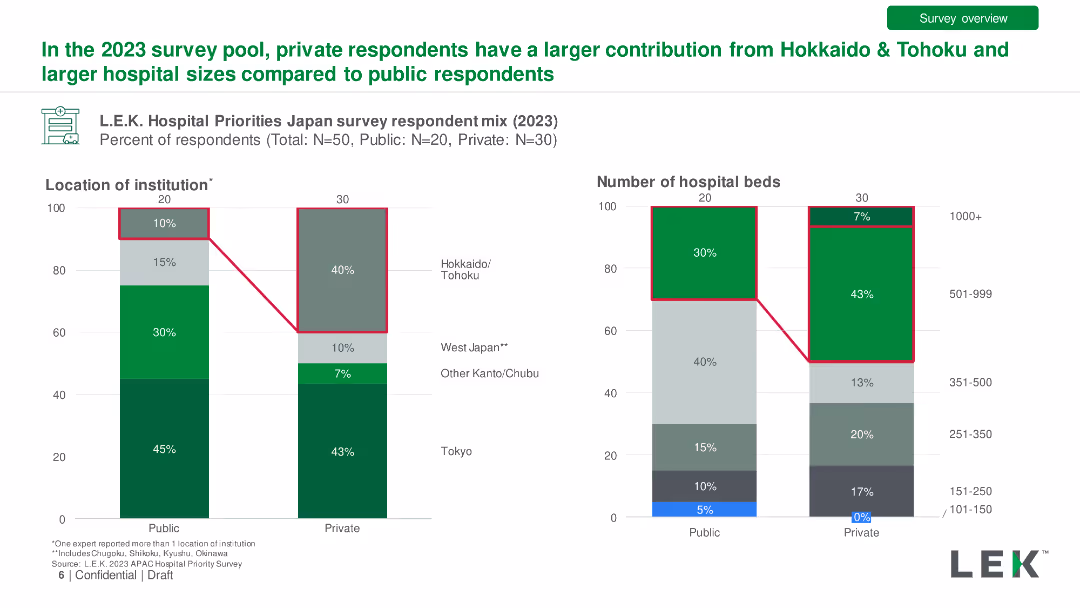
Bar charts comparing private vs. public hospital respondent mix by location and hospital size in 2023. Detailed with percentage differences.
Market Analysis and Trends
Healthcare & Pharmaceuticals
Comparison of survey responses from public and private hospitals, showing differences in regional representation and hospital sizes.
Private Hospitals, Public Hospitals, Respondents, Comparison, Location
Multiple Chart
LEK
Saved
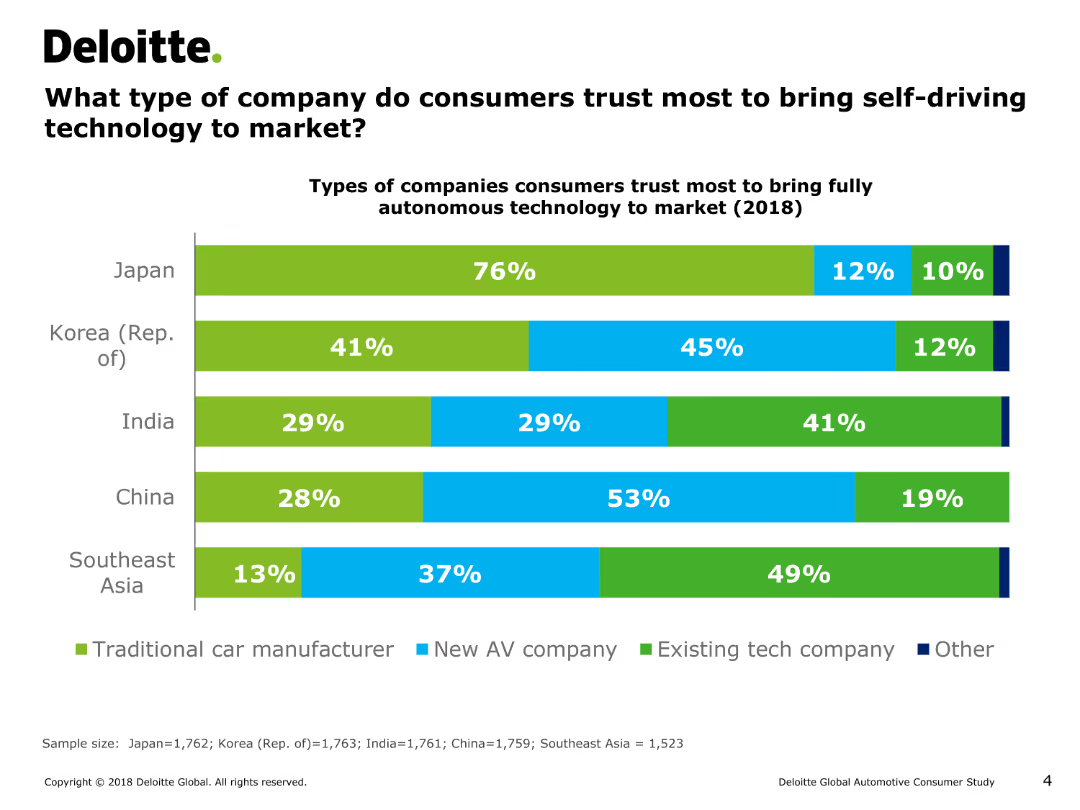
The slide features a horizontal bar chart (bar chart) depicting consumer trust in different types of companies for bringing self-driving technology to market across various countries.
Market Analysis and Trends
Transportation & Logistics
This slide presents data on the types of companies (traditional car manufacturers, new AV companies, existing tech companies, others) that consumers in Japan, Korea, India, China, and Southeast Asia trust to bring self-driving technology to market.
consumer trust, self-driving technology, market analysis, bar chart, autonomous technology, transportation, automotive industry, consumer preferences
Single Chart
Deloitte
Saved
Contains a column chart showcasing the growth of deposits over time segmented by different business units within the organization.
Financial Performance
Financial Services
Used to demonstrate the consistent increase in deposits across various segments of a financial institution, reflecting healthy financial growth and stability.
Deposits, Growth, Trends, Line Graph, Financial Stability, Banking, Performance, Analysis
Single Chart
Citigroup
Saved
The slide contains pie charts showing the distribution of assets within the firm across different channels, using shades of blue and text annotations.
Operational Efficiency
Financial Services
Meant to illustrate how a firm manages and distributes its assets, highlighting the operational structure of asset management and wealth management.
Asset Distribution, Operational Structure, Asset Management, Wealth Management, Fee-Earning, Total Assets
Multiple Chart
Goldman Sachs
Saved
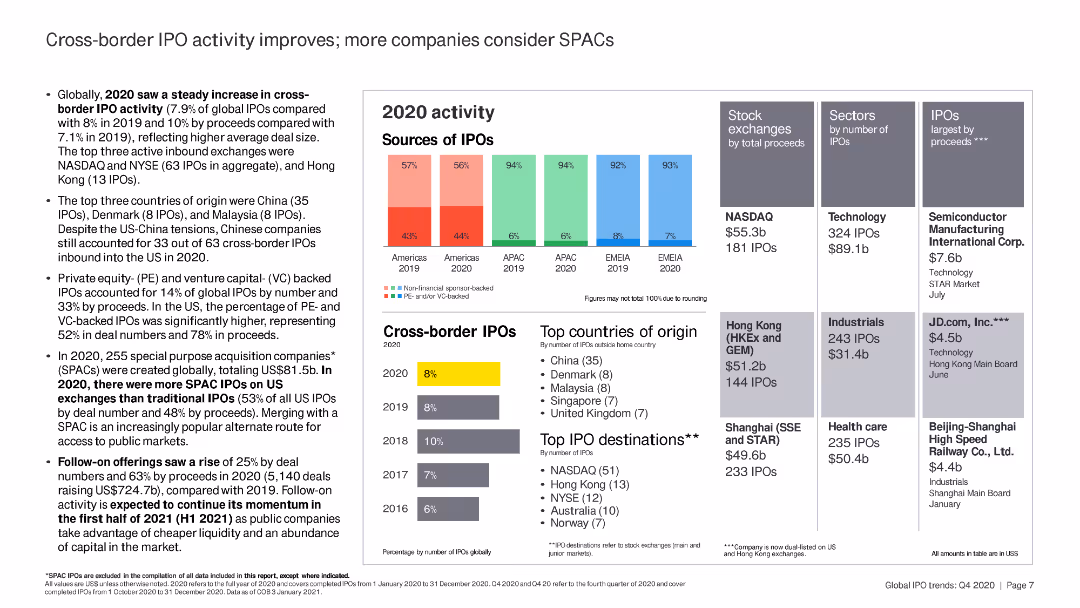
This slide includes column charts and bar charts detailing 2020 IPO activity by region and stock exchange. There are several highlighted text boxes summarizing key figures and top companies by IPO proceeds.
Market Analysis and Trends
Financial Services
The slide provides an overview of cross-border IPO activity in 2020, with a focus on the increasing popularity of SPACs. Key statistics on IPO numbers, proceeds, and top stock exchanges are presented.
IPO, SPAC, stock exchange, proceeds, 2020
Multiple Chart
EY
Saved
Features column and line charts comparing emission reduction targets with vibrant colors and a clear title. The layout is complemented by bullet-pointed text and annotations.
Strategic Planning
Environmental Services & Sustainability
Communicates LANXESS's commitment to achieving climate neutrality, detailing their reduction targets and comparing their progress to EU regulations.
ESG, Climate Neutrality, Targets, LANXESS
Multiple Chart
Morgan Stanley
Saved
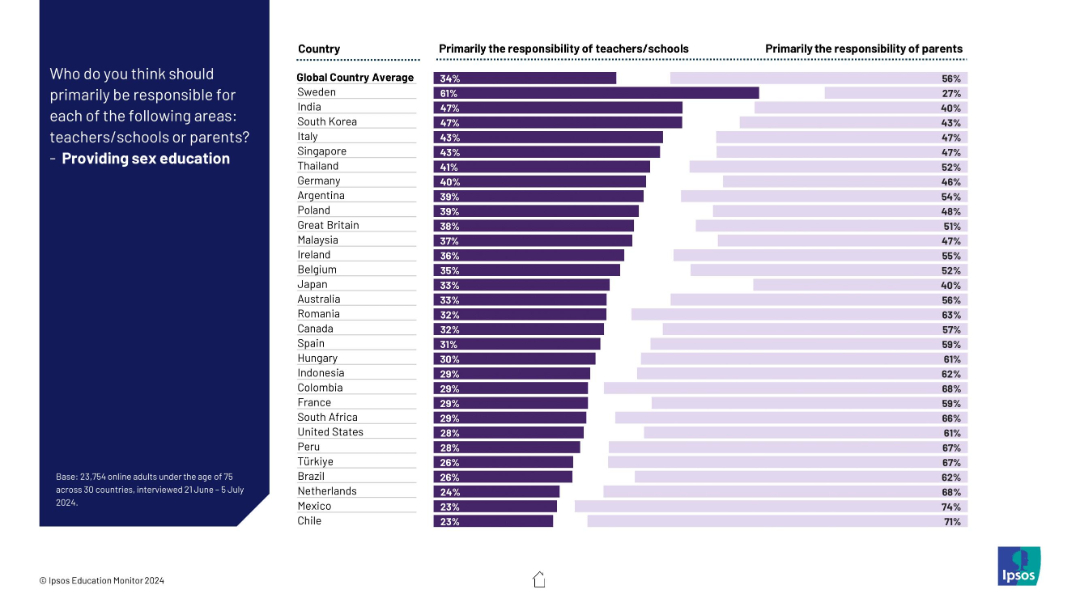
Horizontal dual-colored bar graph showing teacher vs parent responsibility levels by country.
Regulatory and Compliance
Education & Training
This slide details perspectives on who should provide sex education—teachers or parents. The data reflects cultural and national differences in this sensitive area.
sex education, responsibility, compliance, parents, schools, culture, regulation, education, global survey, Ipsos
Mixed Chart
IPSOS
Saved
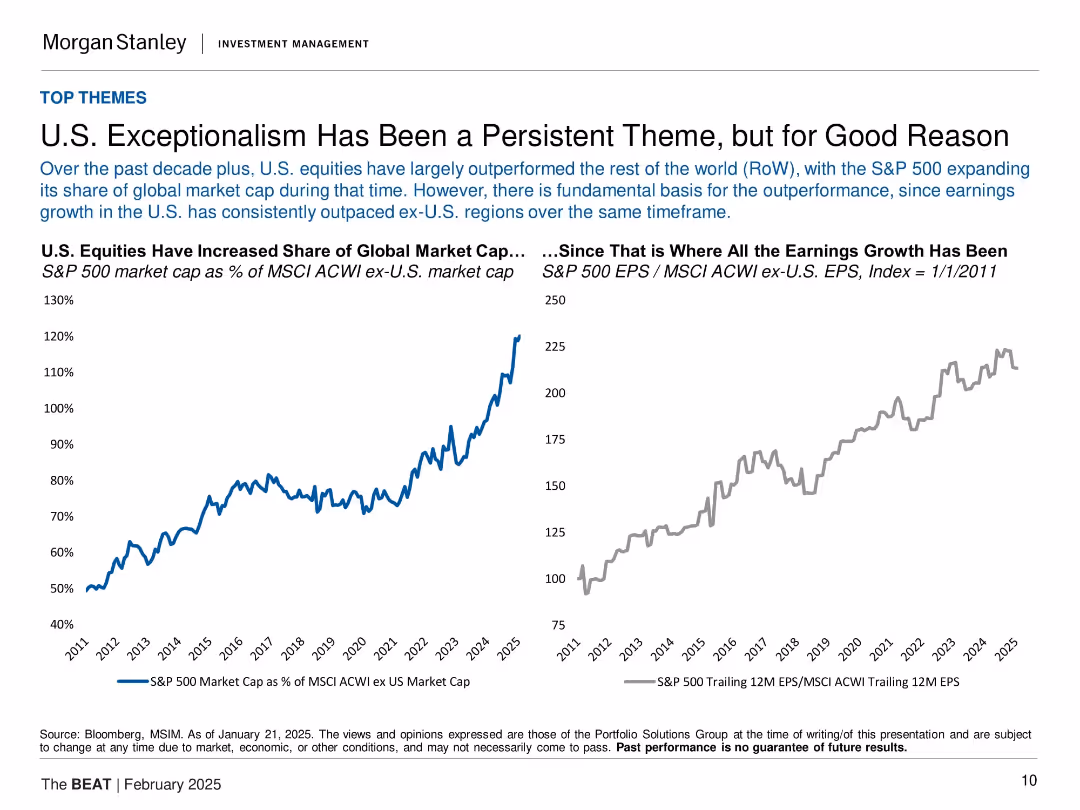
Dual-line chart showing S&P 500 market cap vs. earnings relative to MSCI ACWI ex-U.S. from 2011–2025.
Strategic Planning
Financial Services
The slide demonstrates that U.S. equities, especially the S&P 500, have significantly outperformed international markets over the past decade. It links this trend to superior earnings growth, with two charts showing market cap share and earnings growth indices. The argument is that U.S. exceptionalism has a structural basis rather than being cyclical or sentiment-driven.
S&P 500, market cap, earnings growth, U.S. equities, global equities, MSCI, exceptionalism, investment strategy
Multiple Chart
Morgan Stanley
Saved
The slide contains a list with checkmarks showcasing assets and innovations in the card industry, complemented with icons representing digital and physical payments. It is structured for easy readability and distinction between unique assets and continuous innovation efforts.
Strategic Planning
Financial Services
This slide emphasizes the unique assets and innovative strides of a card franchise, underlining factors like unmatched scale and top-of-wallet share. It serves as a benchmark for companies aiming to enhance their market positioning through innovation.
Wallet share, Innovation, Industry assets, Branded cards, Loyalty program, Digital payments
Table
JP Morgan
Saved
This slide provides a timeline from the 1980s to the 2010s, detailing the evolution of services with a blue and white color scheme.
Organizational Structure and Change
Financial Services
This slide could be used to depict the growth and diversification of a company's services over decades, emphasizing its established presence in the industry.
Evolution, Services, Growth, Diversification, Decades, Fixed Income, Equity, Advisory, ESG, Real Estate Credit
Linear Flow
Goldman Sachs
Saved
This slide features six gauge charts and a timeline. The top three charts indicate risk-weighted assets for 'Trading', 'Lending', and 'Operational Risk and CVA', each in a gauge format with color gradations from green to red. Below, a timeline marks key regulatory milestones for Basel III. The bottom three gauges represent capital buffers: GSIB, SCB, and CCyB. The overall design is structured, with blue as a dominant color and the use of arrows and timeline for historical and future projections.
Regulatory and Compliance
Financial Services
The slide presents the current and projected regulatory capital requirements, including Basel III endgame and various capital buffers like GSIB, SCB, and CCyB, with an emphasis on the uncertainty and preparation for potential regulatory changes.
Basel III, Regulatory, Capital, Risk, GSIB, SCB, CCyB, Timeline, Gauge Chart
Linear Flow
JP Morgan
Saved
Previous
Next
If nothing, comes up, please save your slides first
Create a FREE account to continue browsing
Receive Instant Access to 1,000+ slides from companies like McKinsey, Google, and Goldman Sachs
First Name
Last Name
Email
Password
I agree to all
Terms & Privacy Policy
Thank you! Your submission has been received!
Oops! Something went wrong while submitting the form.
Have an account?
Sign in
Column Chart
Heatmap
Chevron
Org Chart
Infographic
Callouts
Timeline
List
Graphic
Picture
Process Flow
Diagram
Paragraph
Map
Table
Framework
Subtitle
Takeaway Box
Icon
Other Chart
Radar Chart
Waterfall Chart
Mekko Chart
Pie Chart
Scatter Plot
Line Chart
Bar chart
Bullet points