My Account
My Slides
Search by Category
Templates
Leave Feedback
Login
Logout
Get Started
Browse all Slides
Browse all Slides
Create a FREE Account
Instant access to 1,000+ real slides from top companies like McKinsey, BCG, Goldman Sachs, Google and many more!
First Name
Last Name
Email
Password
I agree to all
Terms & Privacy Policy
Thank you! Your submission has been received!
Oops! Something went wrong while submitting the form.
Have an account?
Sign in
Saved Slides
The slide shows a column chart on the left showing North American buyout deals and a text box on the right detailing representative deals. The color scheme is mainly blue and white, with text and graph elements.
Investment Analysis
Agriculture & Food Production
This slide provides a comprehensive overview of private equity investment focus within the agriculture industry's value chain from 2014-2016, highlighting specific deals and segments.
agriculture, private equity, investment, value chain, buyout deals, market segments
Single Chart
EY
Saved
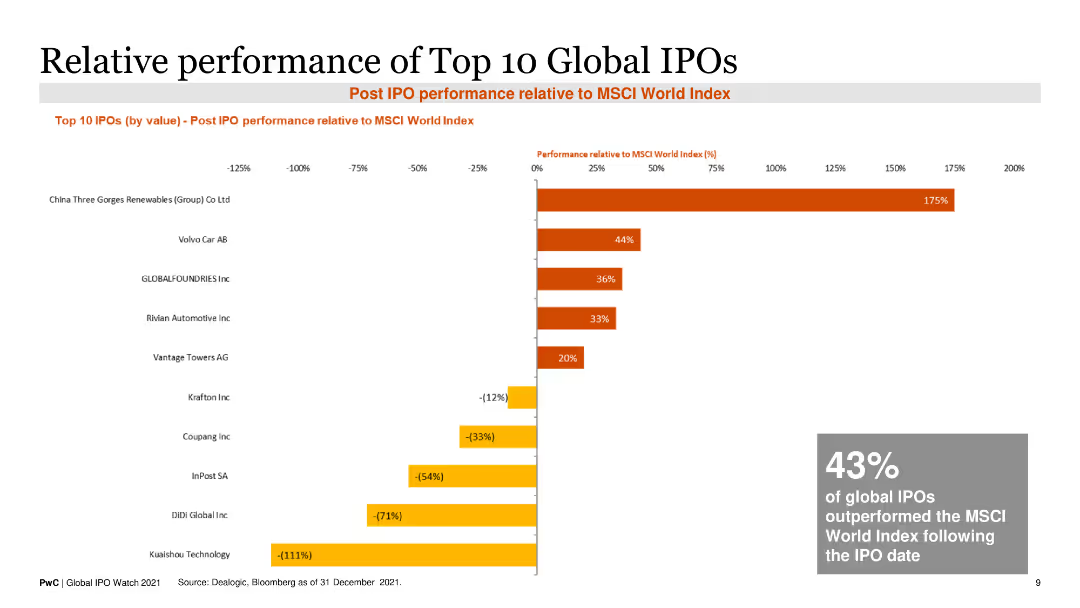
This slide includes a horizontal bar chart displaying the post-IPO performance of the top 10 global IPOs relative to the MSCI World Index as of December 2021.
Market Analysis and Trends
Financial Services
It highlights the performance of major IPOs, showing the percentage change in value compared to a global market index, useful for investment analysis.
IPO performance, MSCI World Index, investment analysis, top IPOs, post-IPO performance
Single Chart
PwC/Strategy&
Saved
This slide features multiple line charts tracking performance forecasts across three categories: passenger cars/light trucks, trucks, and specialties. Each chart includes two lines representing the years 2022 and 2023 with shaded areas between them, illustrating projections and past performance. Icons represent each category and textual annotations provide additional context and previous forecast comparisons.
Market Analysis and Trends
Transportation & Logistics
The slide presents a market scenario for fiscal year 2023, with slight improvements in passenger cars/light trucks and ongoing destocking in trucks. It includes a detailed analysis of trends in various sub-categories of the tire industry such as mining, aircraft, and two-wheel tires. It aims to provide an updated market outlook and forecast changes, suggesting industry trends and market conditions.
market, forecast, tires, performance, trend, passenger, truck, specialty, projections, destocking
Multiple Chart
Morgan Stanley
Saved
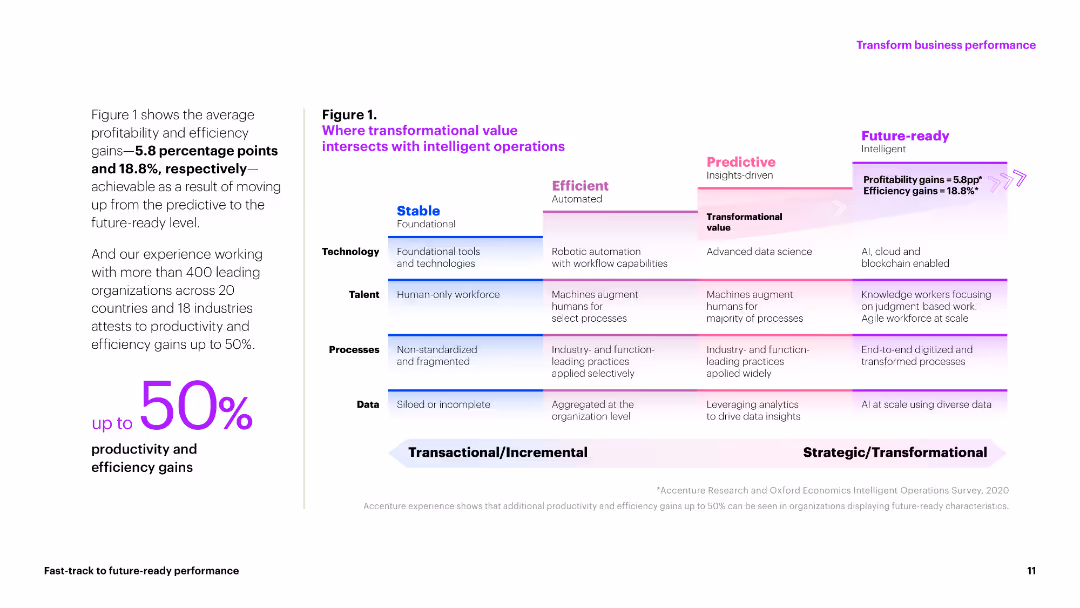
The slide contains a chart depicting the progression from stable to future-ready operations, with explanatory text on technology, talent, processes, and data.
Technology and Digital Transformation
Technology & Software
This slide explains how intelligent operations can lead to significant productivity and efficiency gains, highlighting the path to becoming future-ready.
intelligent operations, productivity, efficiency gains, future-ready, technology transformation
Table
Accenture
Saved
This slide uses a linear graphic showing a maturity model with stages (Foundational, Programmatic, Strategic, Integrated) ranked by survey participants, emphasizing the continuous evolution of inclusion and diversity.
Strategic Planning
Professional Services
The slide discusses a maturity model for organizational inclusion and diversity, ranking each cornerstone from foundational to integrated stages, based on survey feedback.
Maturity Model, Inclusion, Diversity, Organizational, Survey, Evolution, Stages, Foundational, Integrated
Linear Flow
Accenture
Saved
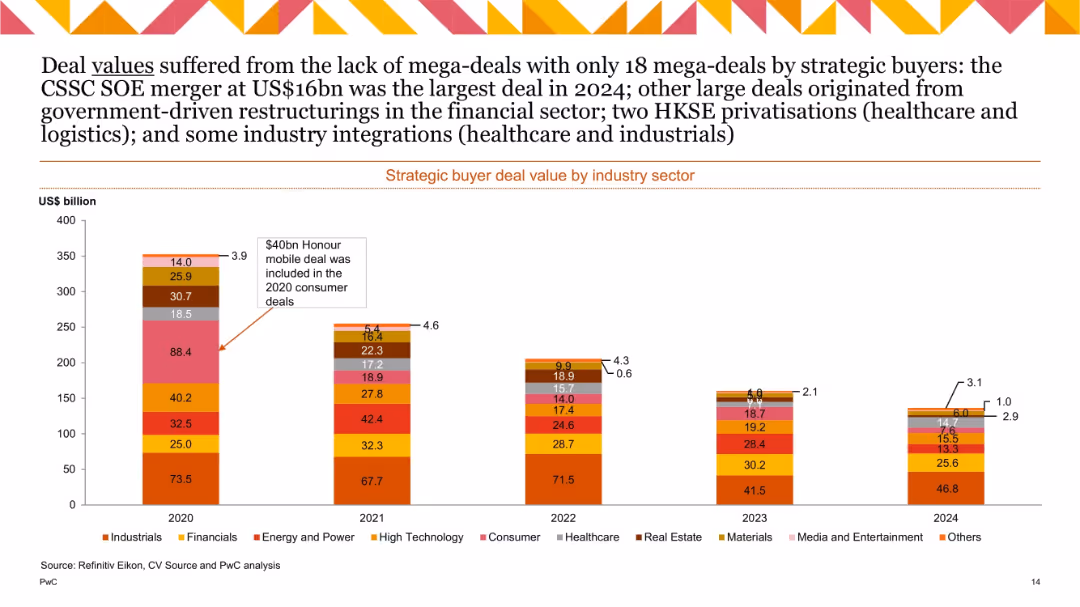
Stacked vertical bars representing deal values in US$ billion by sector from 2020–2024; fewer high-value deals in recent years; emphasis on top deals.
Investment Analysis
Financial Services
Illustrates M&A deal value per industry. The absence of mega-deals brought total values down in 2024. The largest was a $16bn CSSC SOE merger. Notable restructuring seen in financials, and key privatizations occurred in healthcare/logistics.
deal value, sectors, mega-deals, SOEs, privatizations, 2024
Single Chart
PwC/Strategy&
Saved
Column charts representing portfolio loans with quarterly changes, alongside a bar chart for FICO score distribution at origination. Clear and easy to understand layout.
Client Case Studies
Financial Services
Provides a snapshot of the credit card loan portfolio, emphasizing financial trends and borrower credit score distribution. It can serve as a case study in financial presentations to discuss credit risk management and customer profile analysis.
Credit Card, Financials, Risk, Portfolio, Scores
Multiple Chart
Morgan Stanley
Saved
This slide features a series of column charts showing assets under management (AuM) over several quarters for different product groups, and a detailed bar chart showing net flows by quarter.
Investment Analysis
Financial Services
The slide presents quarterly financial data of a private bank's assets under management categorized by product type and net flows. This allows for analysis of trends and investment product performance across quarters.
AuM, private bank, net flows, quarterly data, investment products, financial trends
Multiple Chart
Deutsche Bank
Saved
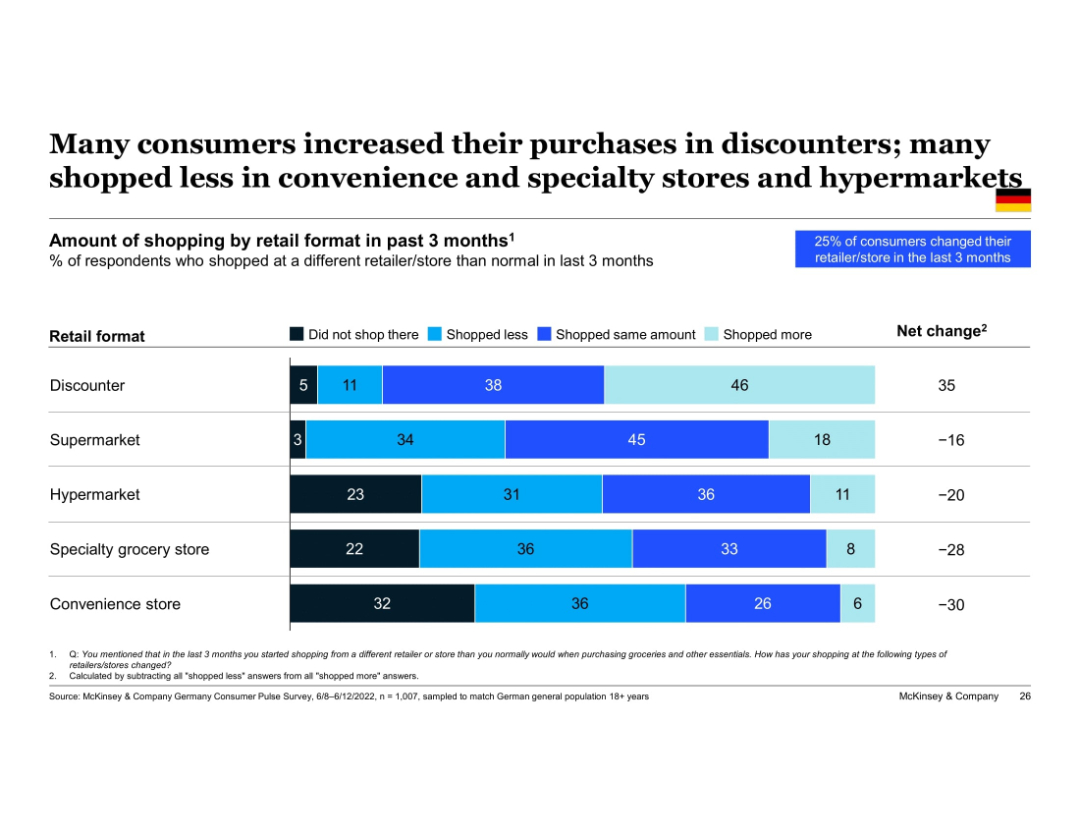
Horizontal bar chart showing % of consumers who shopped more or less at different retail formats, with net change column; blue/purple color scale and German flag
Market Analysis and Trends
Retail & E-commerce
Consumers are increasingly shopping at discount stores, with a net positive change of 35%. Conversely, formats like convenience stores and specialty groceries saw significant drops. This slide reveals consumer migration toward cost-effective options and away from traditional or specialty retail during inflationary pressure.
discounters, retail format, convenience stores, specialty grocery, net change, shopping behavior, inflation, Germany
Single Chart
McKinsey
Saved
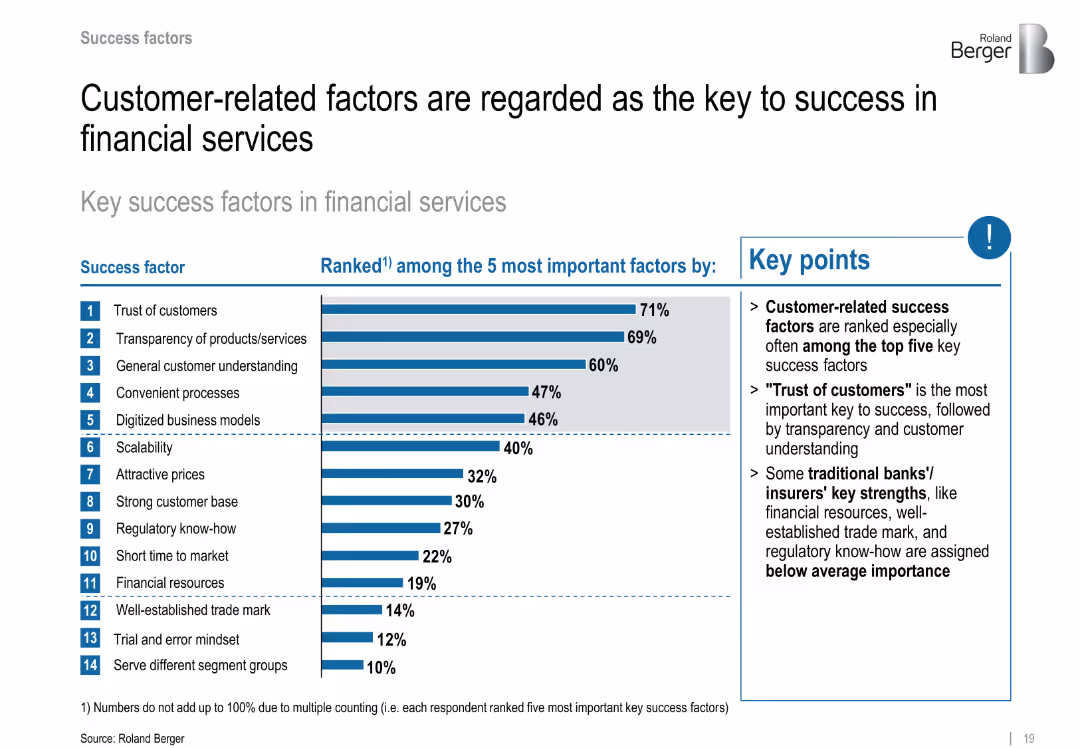
Ranked bar chart showing key success factors; highlights top 14 elements including customer trust
Performance Metrics and KPIs
Financial Services
Emphasizes customer trust, transparency, and understanding as top factors for FinTech success. Traditional factors like regulatory know-how rank lower.
customer trust, transparency, success drivers, FinTech priorities, performance factors
Mixed Chart
Roland Berger
Saved
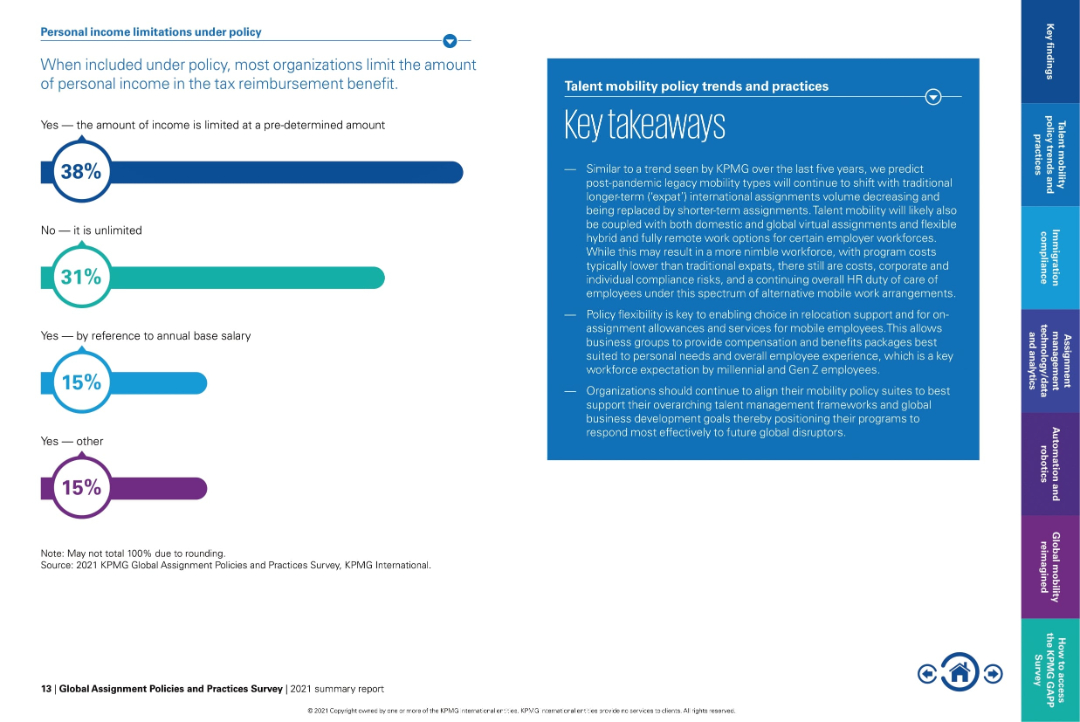
Bar graph on left and text-heavy takeaway box on right in blue.
Regulatory and Compliance
Financial Services
Explains how organizations limit personal income within tax reimbursement policies. 38% impose a predefined cap, while 31% allow unlimited inclusion. Also provides key takeaways on policy flexibility and how mobility policies are evolving post-pandemic.
tax reimbursement, income limitations, expat benefits, flexible mobility, policy caps, compensation policy
Mixed Chart
KPMG
Saved
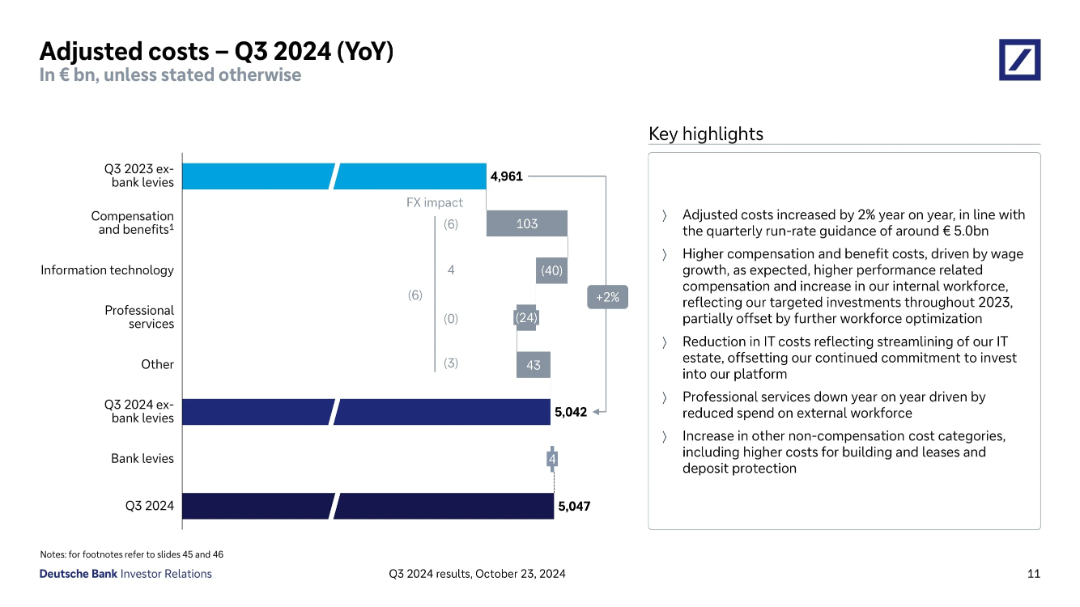
Waterfall chart showing cost components YoY; key highlights box on right.
Operational Efficiency
Financial Services
Analyzes changes in adjusted costs year-over-year, attributing changes to compensation, IT, professional services, and FX impact. Costs rose 2%, mainly due to compensation and growth in internal workforce, with IT and services offsetting increases.
cost increase, YoY comparison, workforce, IT costs, FX impact
Mixed Chart
Deutsche Bank
Saved
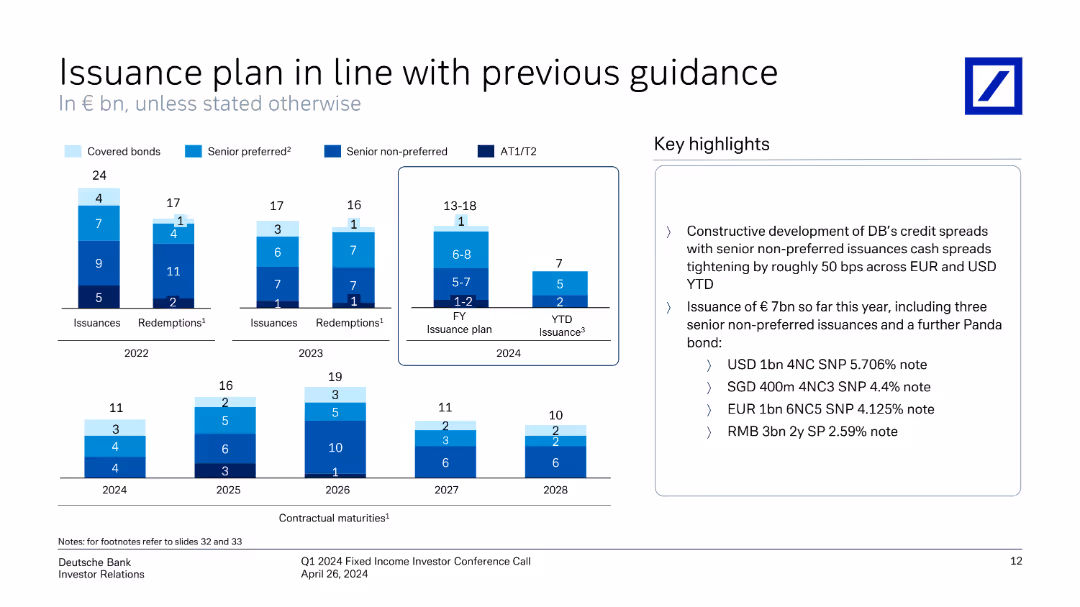
This slide features column charts showing issuances and redemptions from 2022 to 2028, with key highlights in text format on the right.
Financial Performance
Financial Services
The slide outlines Deutsche Bank's issuance and redemption plans from 2022 to 2028, detailing bond types and key highlights.
issuance, plan, bonds, financial, highlights, redemption, chart, guidance, key points, Deutsche Bank
Multiple Chart
Deutsche Bank
Saved
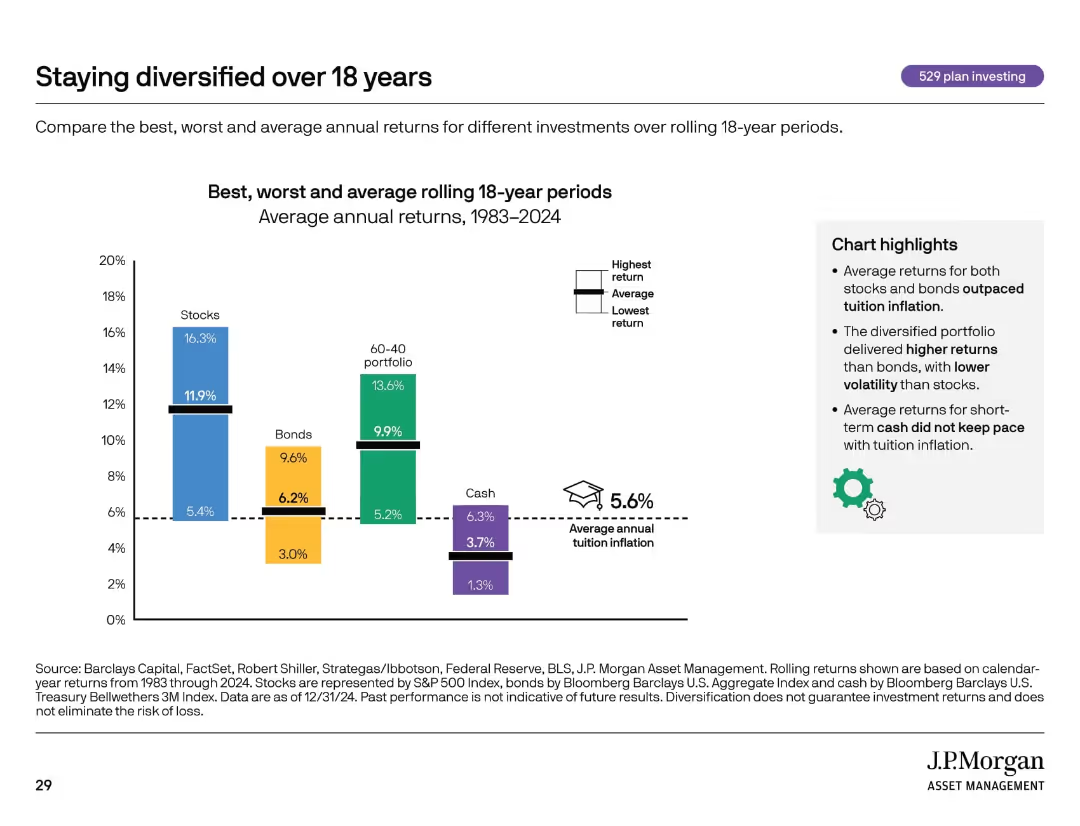
Bar chart comparing returns of different asset classes. Includes icons, dotted lines, and callout text boxes.
Investment Analysis
Financial Services
Compares average, best, and worst returns for stocks, bonds, cash, and diversified portfolios over 18-year rolling periods. Emphasizes that diversification and long-term investing can outperform tuition inflation.
diversification, investment returns, asset classes, inflation, 529 plan
Mixed Chart
JP Morgan
Saved
Slide displays bar charts reflecting investor priorities in different financial aspects with a focus on growth and resilience. Notable changes from a prior survey are indicated.
Strategic Planning
Financial Services
Discusses investor expectations for companies to focus on growth and financial resilience, particularly relevant for corporate strategy and financial planning.
growth, financial resilience, investor expectations, corporate strategy, financial planning
Single Chart
BCG
Saved
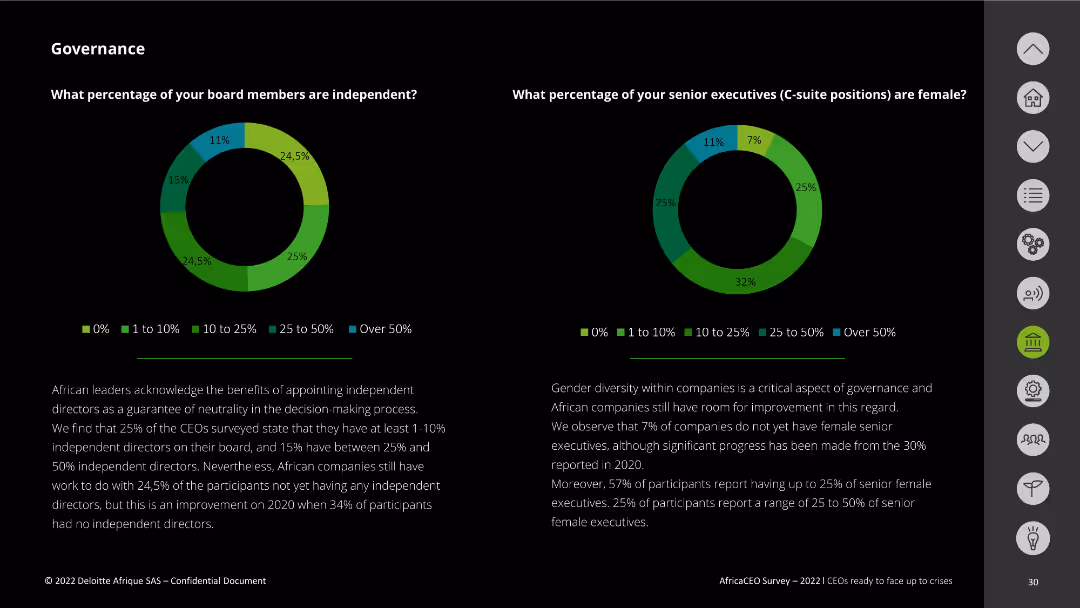
The slide features two pie charts showing the percentage of independent board members and senior female executives in companies. The charts are color-coded with a legend.
Organizational Structure and Change
Professional Services
This slide presents survey results on corporate governance, focusing on the percentage of independent board members and senior female executives in companies. It emphasizes the need for gender diversity and independent decision-making.
governance, independent directors, female executives, corporate diversity, survey
Multiple Chart
Deloitte
Saved
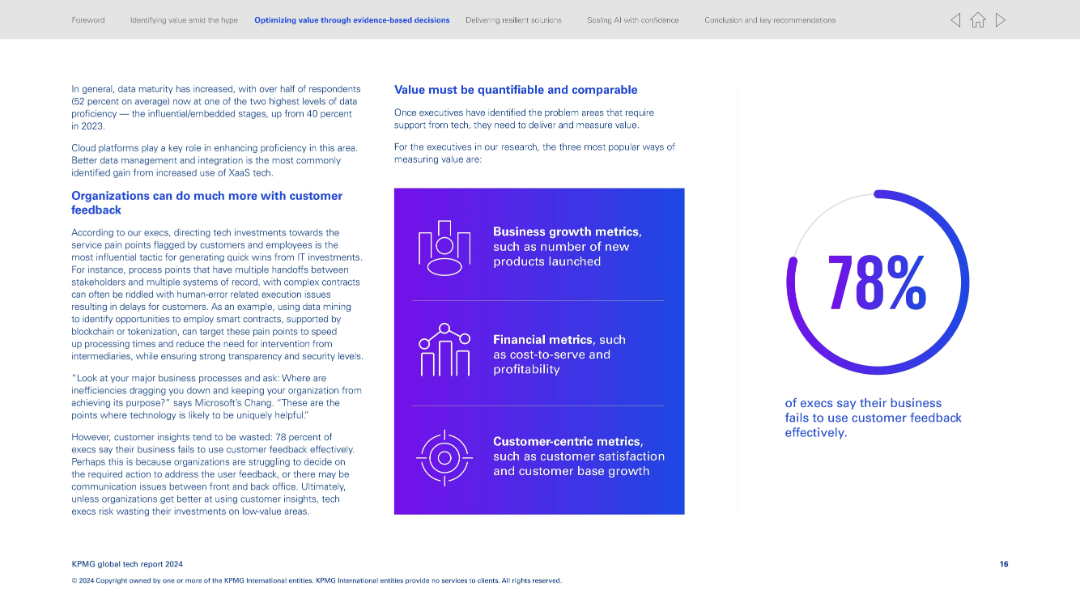
Two-column design; left side has textual insights, right features three metric types in a purple gradient box and a large stat circle.
Customer and Market Segmentation
Technology & Software
Explains the gap in using customer feedback effectively—78% of execs acknowledge the shortfall. Encourages using data and smart contracts to target customer pain points. Identifies how value is commonly measured via business, financial, and customer metrics.
Customer feedback, value metrics, smart contracts, process improvement, data utilization, business impact, satisfaction, ROI
Mixed Chart
KPMG
Saved
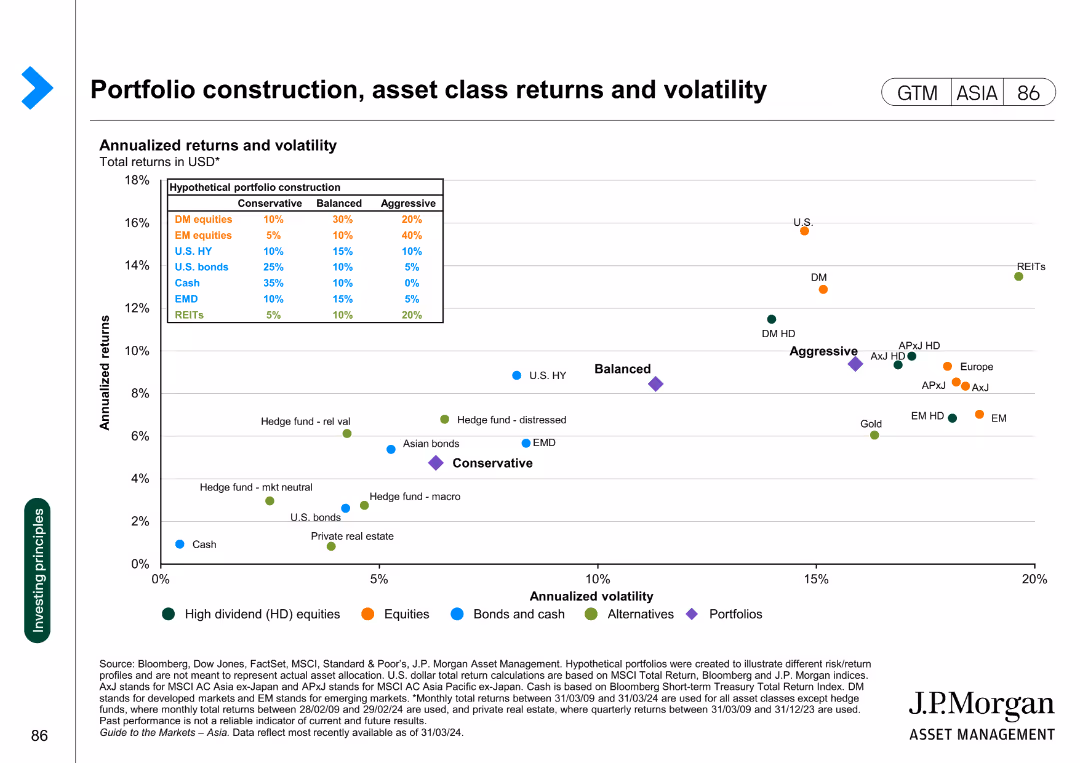
Scatter plot showing annualized returns and volatility for various asset classes and hypothetical portfolio constructions in USD.
Investment Analysis
Financial Services
This slide evaluates different asset classes in terms of returns and volatility, offering insights into portfolio construction strategies for balanced, conservative, and aggressive profiles.
portfolio, returns, volatility, asset classes, construction
Single Chart
JP Morgan
Saved
Three columns outlining global scale and market leadership, deep client franchise, and highly skilled talent.
Market Analysis and Trends
Financial Services
Highlights Credit Suisse’s position as a top wealth manager, focusing on market leadership and client engagement.
wealth management, global scale, client franchise, market leadership, skilled talent
Pillar
Credit Suisse
Saved
The slide compares demographic and behavioral profiles of three consumer clusters (EV owners, EV prospects, EV sceptics) using icons and text boxes. It includes data on income, age, gender, urbanization, and parking access.
Customer and Market Segmentation
Consumer Goods
The slide provides a detailed profile comparison of EV owners, prospects, and sceptics, focusing on demographics such as income, age, gender, and living area. It shows differences in private parking access and highlights characteristics useful for market segmentation and targeting.
Consumer Survey, Cluster Profiles, Demographics, EV Owners, EV Prospects, EV Sceptics, Income, Age, Gender
Multiple Chart
PwC/Strategy&
Saved
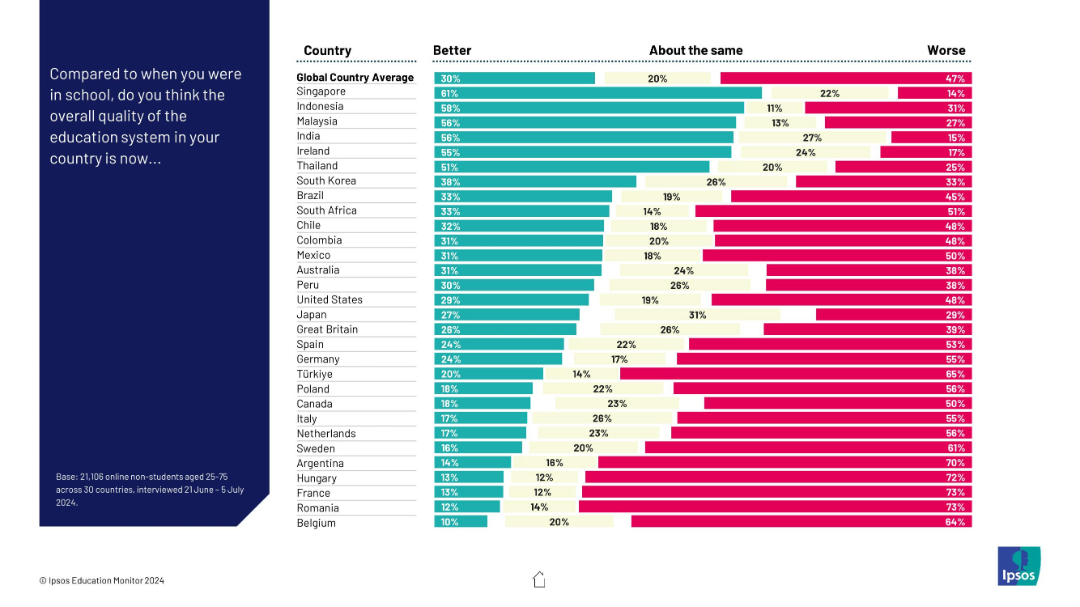
Horizontal bar chart displaying whether adults think their country’s education quality has improved, stayed the same, or worsened since their school years.
Strategic Planning
Education & Training
This slide captures generational change in public sentiment around education quality. While countries like Indonesia and Malaysia report improvements, many in Europe and South America feel their systems have deteriorated over time.
education change, perception, generations, Ipsos, quality, country comparison
Mixed Chart
IPSOS
Saved
Contains tables and bullet points detailing alternative investments, their average AUS, and effective fees, alongside column chart summarizing historical principal investments rollforward.
Investment Analysis
Financial Services
Analyzes the alternative investment portfolio's performance, with a focus on average assets under supervision and fee structures. It's aimed at investors seeking detailed information on the sector's financial dynamics and investment potential.
Alternative Investments, AUS, Effective Fees, Corporate Equity, Hedge Funds, Principal Investments, Investment Portfolio, Fee Structure
Mixed Chart
Goldman Sachs
Saved
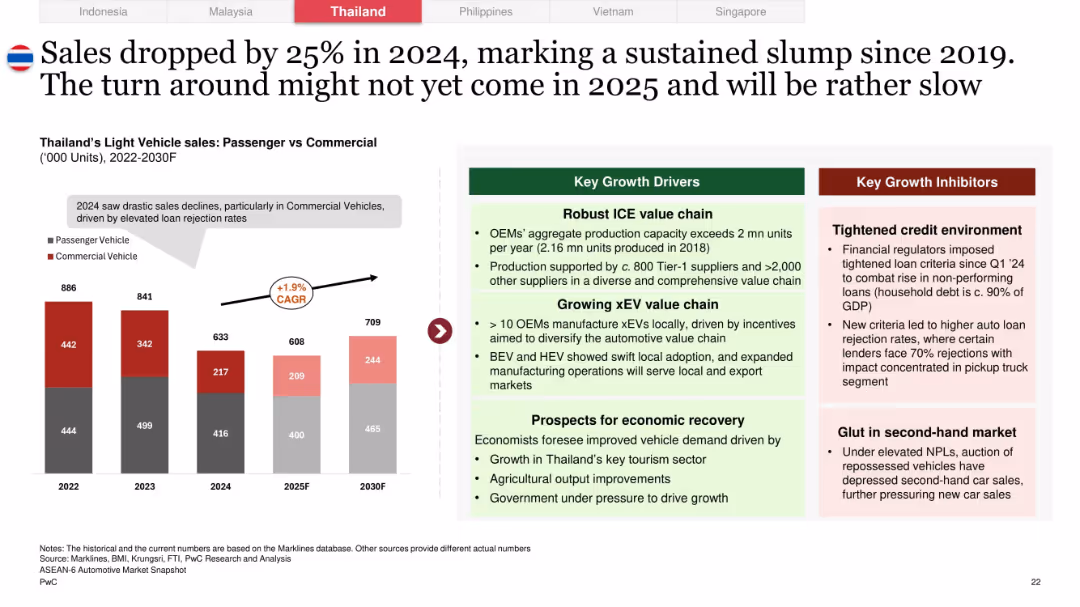
Side-by-side format: bar chart showing passenger vs commercial vehicle sales 2022–2030F, growth factors and inhibitors in colored boxes
Market Analysis and Trends
Industrial & Manufacturing
Shows a 25% decline in Thailand’s auto sales for 2024, with commercial vehicle drop being most severe. Key reasons include high loan rejections and tight credit. Growth opportunities lie in a robust ICE value chain, EV manufacturing, and macroeconomic recovery.
Thailand, automotive slump, credit risk, ICE value chain, vehicle sales forecast, pickup trucks, CAGR, EV transition
Mixed Chart
PwC/Strategy&
Saved
The slide presents four column charts showing the increase in levelized cost of production for cement, steel, ammonia, and methanol when applying CCUS.
Market Analysis and Trends
Industrial & Manufacturing
The slide demonstrates that applying CCUS to industrial processes increases production costs. The charts break down the cost impacts for various industries, including cement, steel, ammonia, and methanol, comparing normal processes with those incorporating CCUS.
industrial processes, CCUS, production cost
Multiple Chart
Kearney
Saved
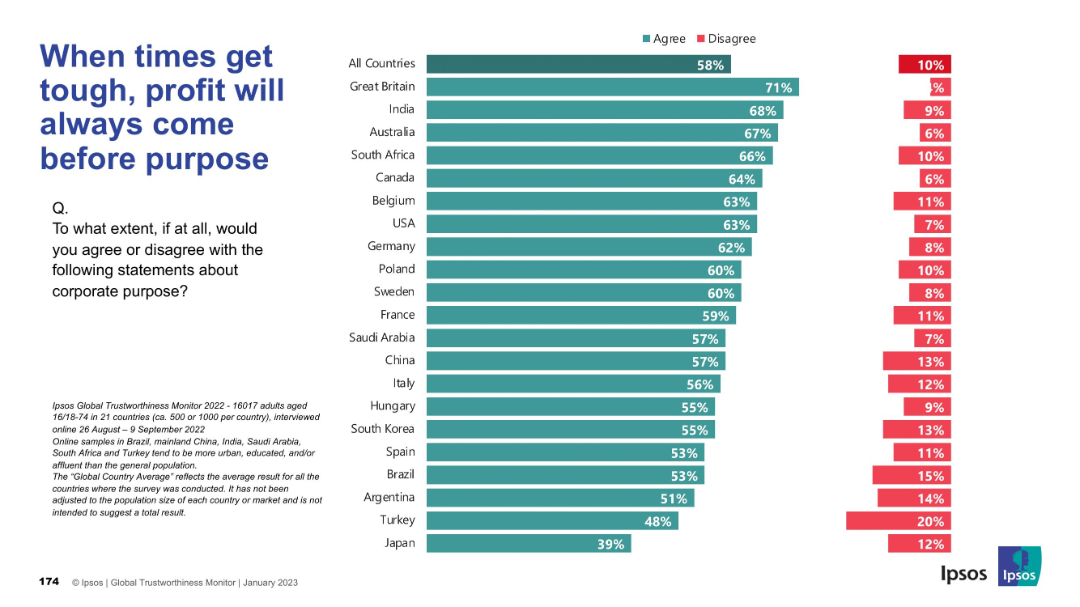
Structured bar chart showing country-level agreement on the trade-off between profit and purpose; consistent color use and layout.
Corporate Finance and Valuation
Financial Services
This chart captures the belief that businesses prioritize profit over stated social/environmental purposes during challenging times. A majority across countries agree, especially in the UK and India.
profit vs purpose, business values, financial priorities, Ipsos, public opinion, economic pressure
Mixed Chart
IPSOS
Saved
Previous
Next
If nothing, comes up, please save your slides first
Create a FREE account to continue browsing
Receive Instant Access to 1,000+ slides from companies like McKinsey, Google, and Goldman Sachs
First Name
Last Name
Email
Password
I agree to all
Terms & Privacy Policy
Thank you! Your submission has been received!
Oops! Something went wrong while submitting the form.
Have an account?
Sign in
Column Chart
Heatmap
Chevron
Org Chart
Infographic
Callouts
Timeline
List
Graphic
Picture
Process Flow
Diagram
Paragraph
Map
Table
Framework
Subtitle
Takeaway Box
Icon
Other Chart
Radar Chart
Waterfall Chart
Mekko Chart
Pie Chart
Scatter Plot
Line Chart
Bar chart
Bullet points