My Account
My Slides
Search by Category
Templates
Leave Feedback
Login
Logout
Get Started
Browse all Slides
Browse all Slides
Create a FREE Account
Instant access to 1,000+ real slides from top companies like McKinsey, BCG, Goldman Sachs, Google and many more!
First Name
Last Name
Email
Password
I agree to all
Terms & Privacy Policy
Thank you! Your submission has been received!
Oops! Something went wrong while submitting the form.
Have an account?
Sign in
Saved Slides
A bar chart shows the importance of various aspects of public EV charging experiences and payment preferences, with sections color-coded for clarity.
Market Analysis and Trends
Transportation & Logistics
Evaluates consumer priorities for public EV charging, including charging speed and payment methods, informing service improvement and customer satisfaction strategies in the automotive sector.
electric vehicles, charging experience, fast charging, payment methods, consumer preferences, service improvement, automotive industry
Mixed Chart
Deloitte
Saved
Column charts and tables are used to illustrate the number of IPOs and proceeds in Europe, including main and junior markets.
Market Analysis and Trends
Financial Services
It details the performance of IPOs in Europe, highlighting major stock exchanges, sectors, and notable IPOs by proceeds.
Europe, IPOs, main markets, junior markets, stock exchanges
Multiple Chart
EY
Saved
Column chart showing the percentage of organizations currently using API management solutions, those planning to use, and those with no plans. The majority currently use API management solutions.
Operational Efficiency
Technology & Software
The slide presents statistics on the adoption of API management solutions by organizations, indicating that over two-thirds currently use these solutions, with a smaller percentage planning to adopt them in the future.
API management, adoption, organizations, statistics
Single Chart
Gartner
Saved
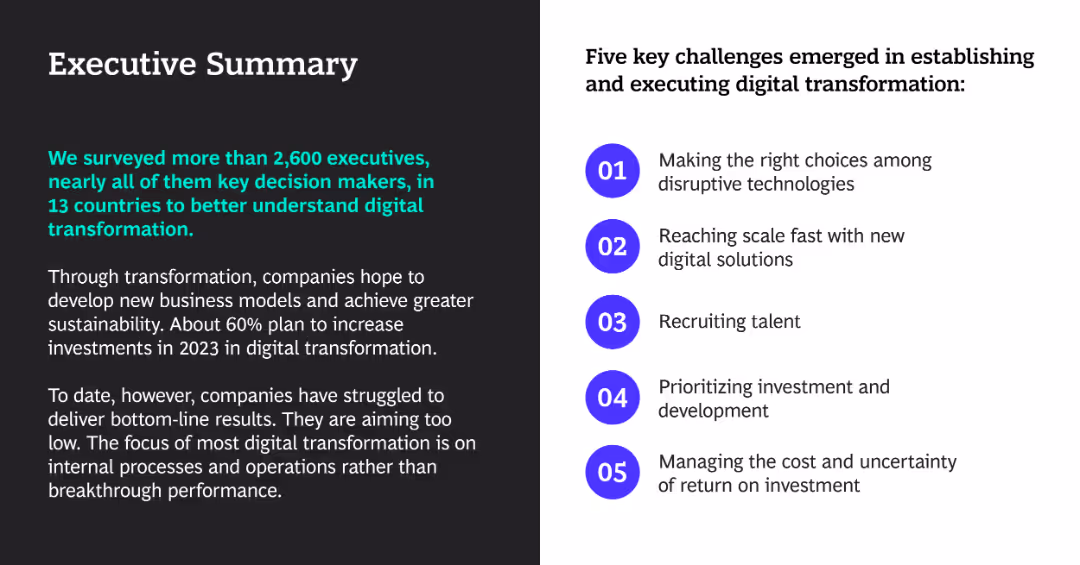
The slide is divided into two sections: a summary in text on the left and key challenges listed with icons on the right.
Strategic Planning
Professional Services
The slide summarizes a survey of executives on digital transformation and outlines five key challenges in implementation.
digital transformation, executives, challenges, summary, survey
Boxed
BCG
Saved
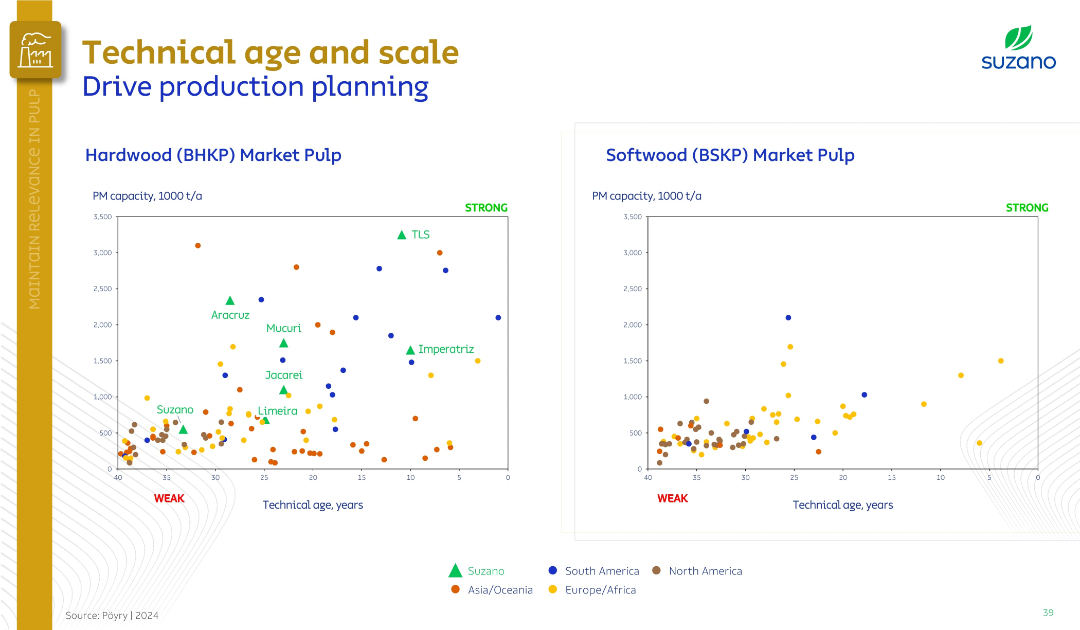
Two scatter plots comparing technical age vs. capacity for BHKP and BSKP markets.
Operational Efficiency
Industrial & Manufacturing
This slide compares global pulp producers' plants by technical age and production scale. It evaluates Suzano’s facilities against regional competitors, emphasizing stronger positioning through newer and larger-scale operations.
technical age, market pulp, Suzano, production planning, BHKP, BSKP
Multiple Chart
Goldman Sachs
Saved
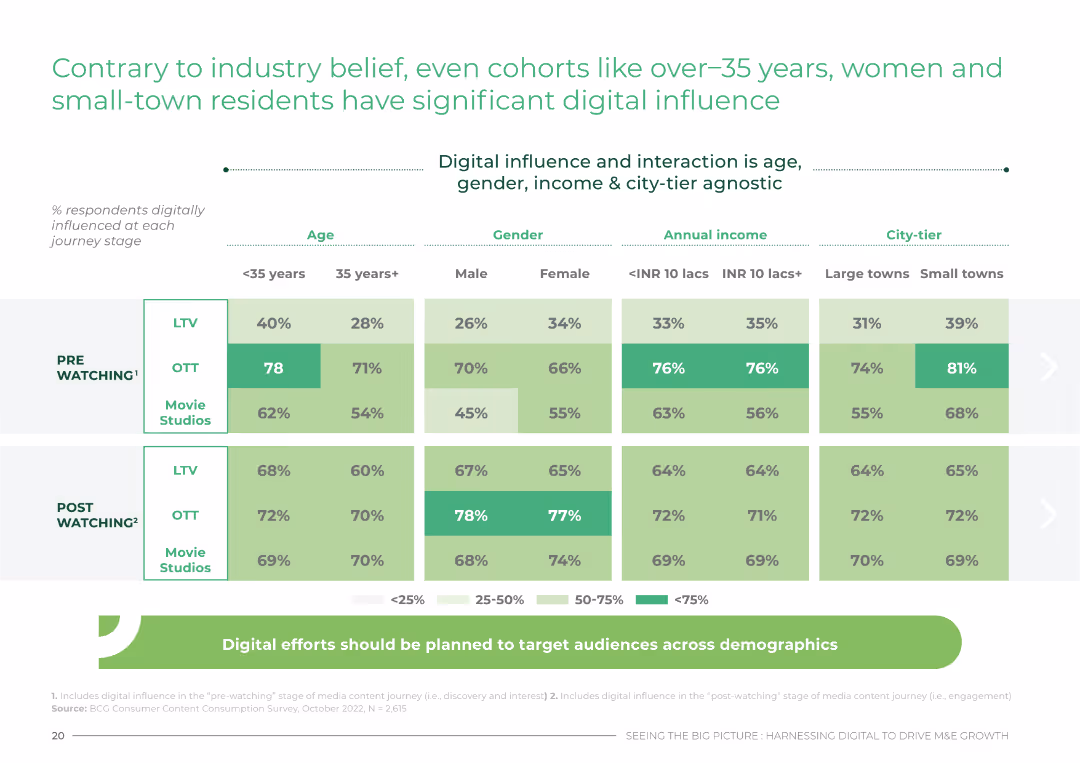
Data table showing digital influence across various demographics, including age, gender, income, and city-tier.
Customer and Market Segmentation
Media & Entertainment
This slide challenges industry beliefs by showing significant digital influence among diverse demographics in India, including over-35s and small-town residents.
digital, influence, demographics, India, segmentation
Table
BCG
Saved
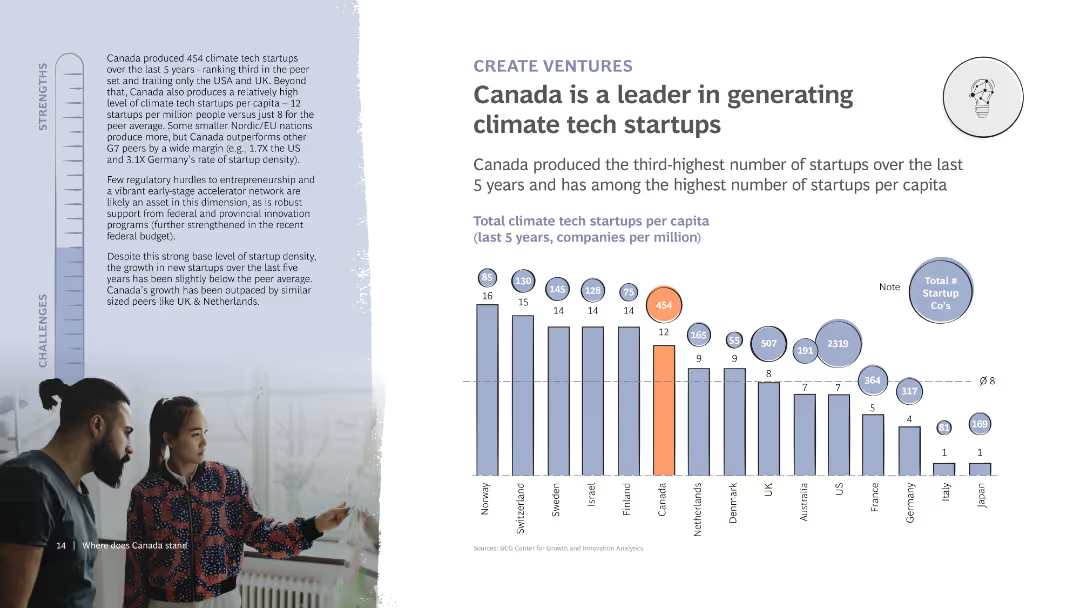
The slide includes a column chart showing the number of climate tech startups per capita in various countries. It also features detailed text discussing Canada’s startup ecosystem and its strengths and challenges, with a photo of two people collaborating.
Market Analysis and Trends
Technology & Software
Highlights Canada's leadership in generating climate tech startups, showing it ranks high in startups per capita. Discusses the supportive ecosystem and challenges in maintaining growth and innovation in the sector.
Startups, Climate tech, Canada, Innovation, Ecosystem
Mixed Chart
BCG
Saved
A scatter plot chart showing cumulative number of cases per million population juxtaposed against a ratio of total tests to total cases for various countries, within a gradient green background indicating preparedness.
Market Analysis and Trends
Healthcare & Pharmaceuticals
Analyzes countries' testing rates in relation to COVID-19 cases to evaluate readiness for relaxing lockdown measures, providing insights into public health strategies.
COVID-19, lockdown measures, testing rates, public health, cumulative cases, preparedness, relax lockdown
Mixed Chart
BCG
Saved
A slide with blue column chart bars showing Chase Travel sales volume over time, with additional details on marketplace strategies and acquisitions.
Financial Performance
Technology & Software
Projects growth in consumer travel, discussing marketplace strategies and highlighting the value of recent acquisitions.
travel sales, growth projection, marketplace strategy, acquisitions, premium customers, Chase
Mixed Chart
JP Morgan
Saved
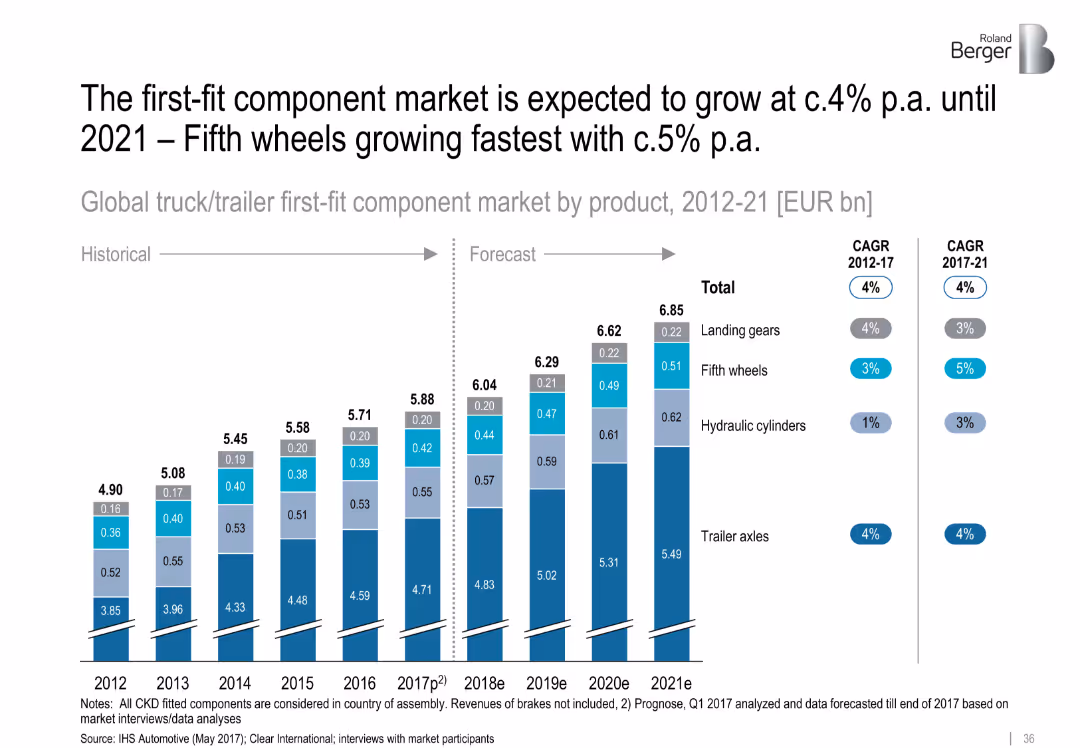
Vertical stacked bar chart showing market size split by component (2012–2021e); trend line and CAGR callouts
Market Analysis and Trends
Transportation & Logistics
Highlights growth trends in trailer component market segments. Fifth wheels are projected to grow fastest (~5% CAGR), while overall market grows ~4% annually. Trailer axles remain the largest segment by value.
component growth, fifth wheels, hydraulic cylinders, trailer axles, CAGR, forecast, trailer market
Single Chart
Roland Berger
Saved
A mix of checkmarks, icons, and arrows indicate progress and future goals with text describing key milestones, current platforms, and upcoming developments in payment technology.
Operational Efficiency
Financial Services
It highlights the advancements and roadmap for payment platforms, showcasing the progress and future plans to improve global scalability and technology. Useful for operational strategy and tech innovation discussions.
Payments, Milestones, Technology, Scalability, Innovation, Roadmap
Table
JP Morgan
Saved
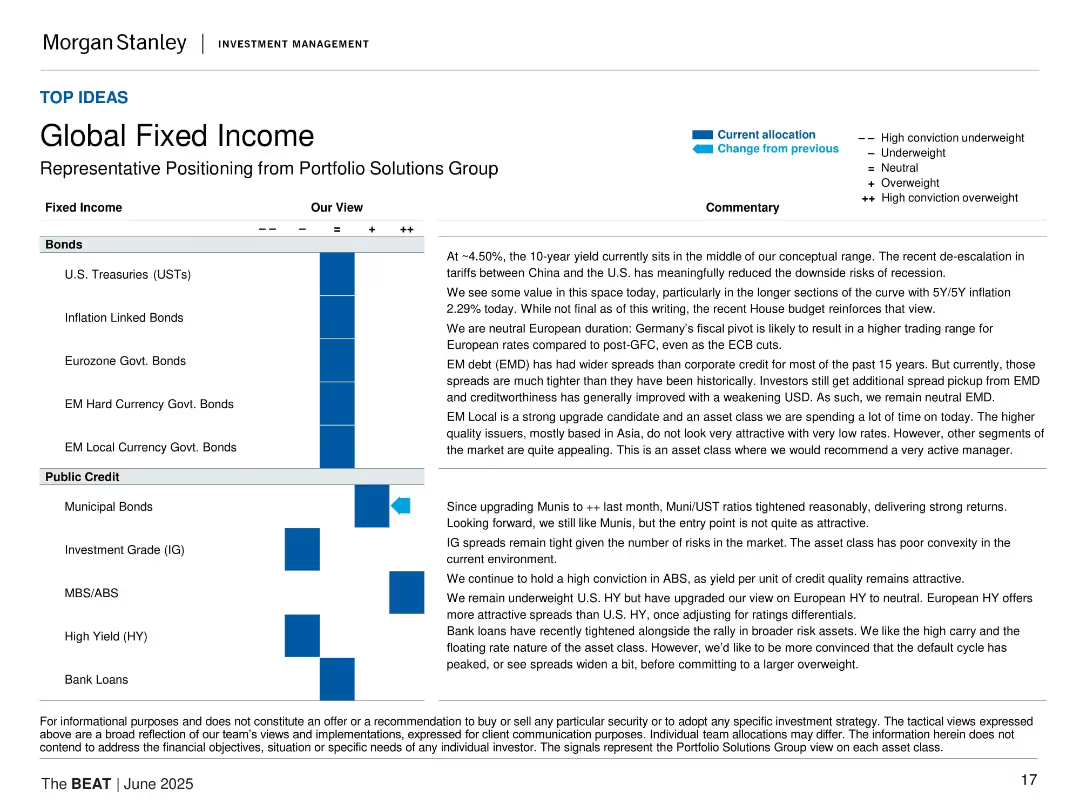
Allocation matrix for various fixed income categories; commentary on macroeconomic impacts; formal tabular style.
Strategic Planning
Financial Services
The slide outlines fixed income positioning, including U.S. Treasuries, inflation-linked bonds, EM debt, and municipals. The group explains views on interest rate sensitivity, credit risk, and hedging opportunities.
fixed income, bonds, credit, USTs, EM debt, inflation, interest rates, allocation, Morgan Stanley, investment strategy
Table
Morgan Stanley
Saved
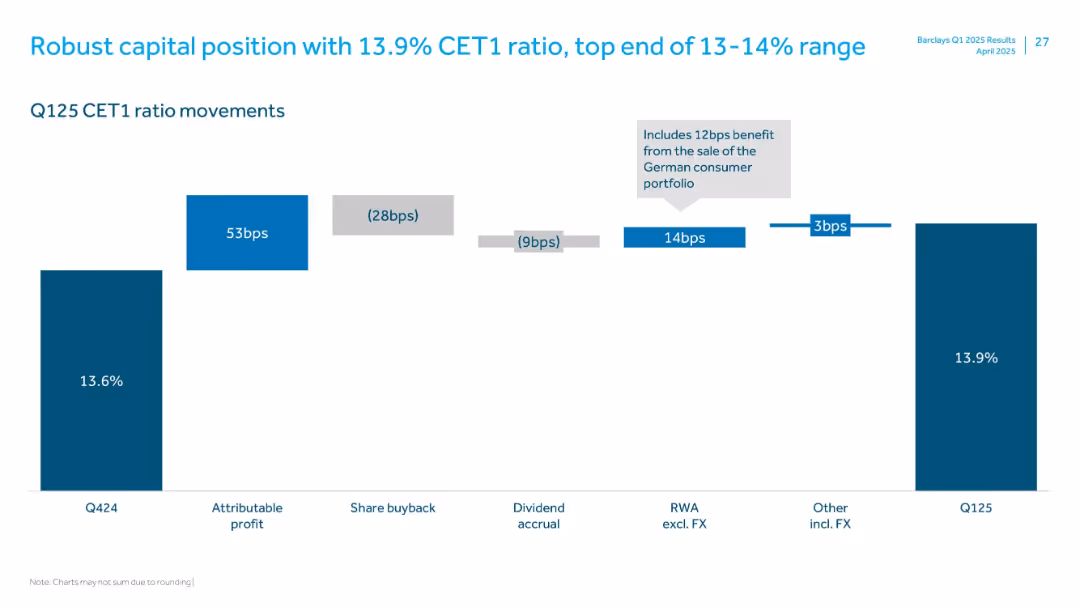
Waterfall bar chart with labeled segments showing CET1 ratio movements from Q424 to Q125
Financial Performance
Financial Services
Illustrates the movement in Barclays' CET1 ratio from Q424 to Q125, highlighting positive and negative contributors such as attributable profit, share buybacks, and RWA changes, ending at 13.9%.
CET1, capital ratio, profit, RWA, share buyback, FX, Q125
Single Chart
Barclays
Saved
This slide has a simple layout with a clear division between text sections and a central infographic. The infographic is a circular diagram with four segments, each containing an icon and label, indicating a strategic approach.
Organizational Structure and Change
Professional Services
The slide describes an organization's strategy and foundational elements for creating value. It could be used to explain a company's core objectives and strategic guideposts, such as purpose, mission, and impact on various stakeholders.
Strategy, Value Creation, Impact, Growth, Sustainability, Inclusivity
Diagram
McKinsey
Saved
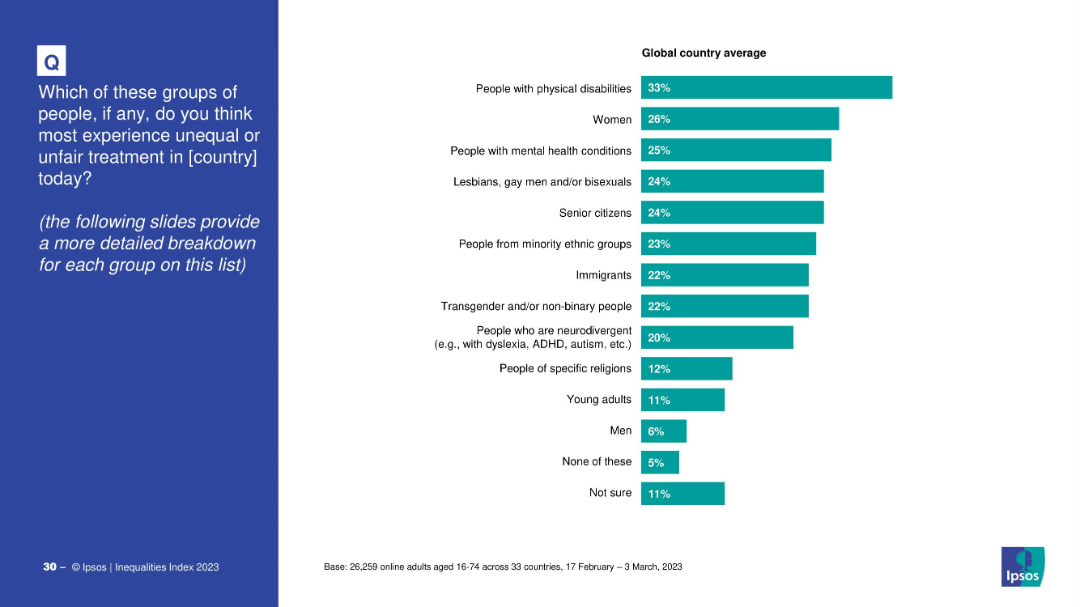
Bar chart showing public opinion on which groups face the most unequal treatment.
Customer and Market Segmentation
Government & Public Sector
This slide reveals which social groups are perceived to face the most unequal treatment, based on global averages. Top groups include people with physical disabilities, women, mental health sufferers, and LGBTQ+ individuals.
inequality, social groups, discrimination, public perception, unfair treatment, diversity
Mixed Chart
IPSOS
Saved
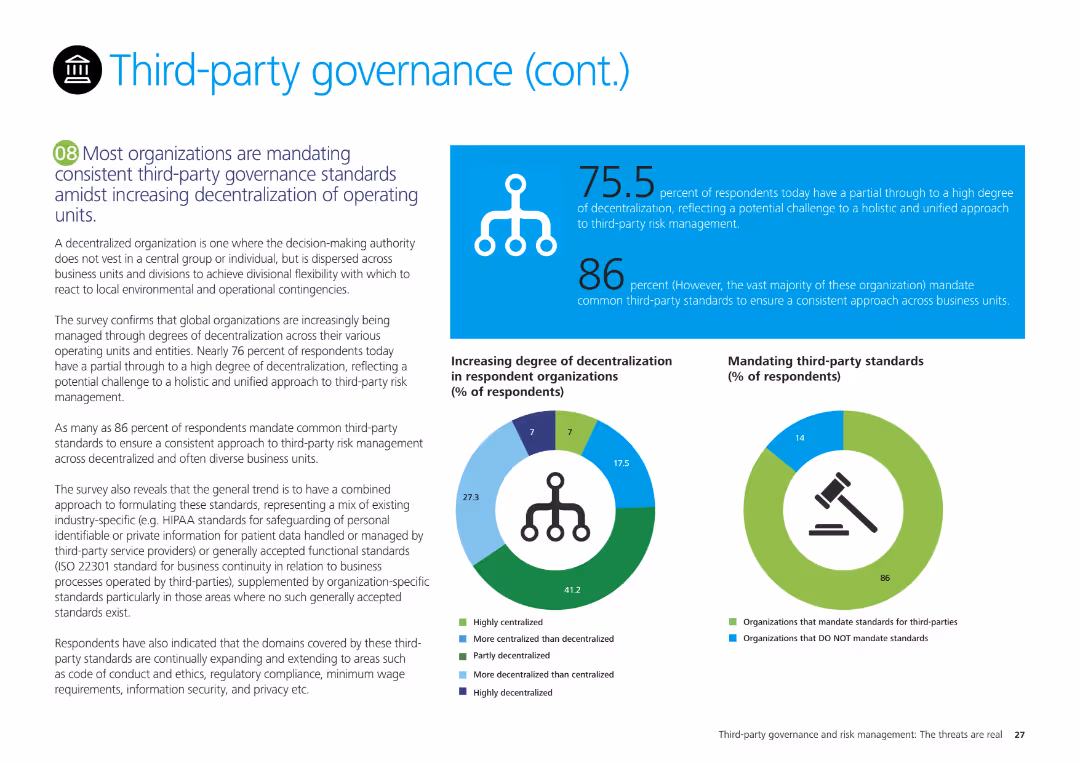
Text content with small charts showing the degree of decentralization and mandating third-party standards. Moderate visual density with explanatory text boxes.
Regulatory and Compliance
Professional Services
The slide explains third-party governance standards amidst decentralization, highlighting survey results on decentralization degrees and mandating third-party standards.
governance, decentralization, standards, third-party, survey
Multiple Chart
Deloitte
Saved
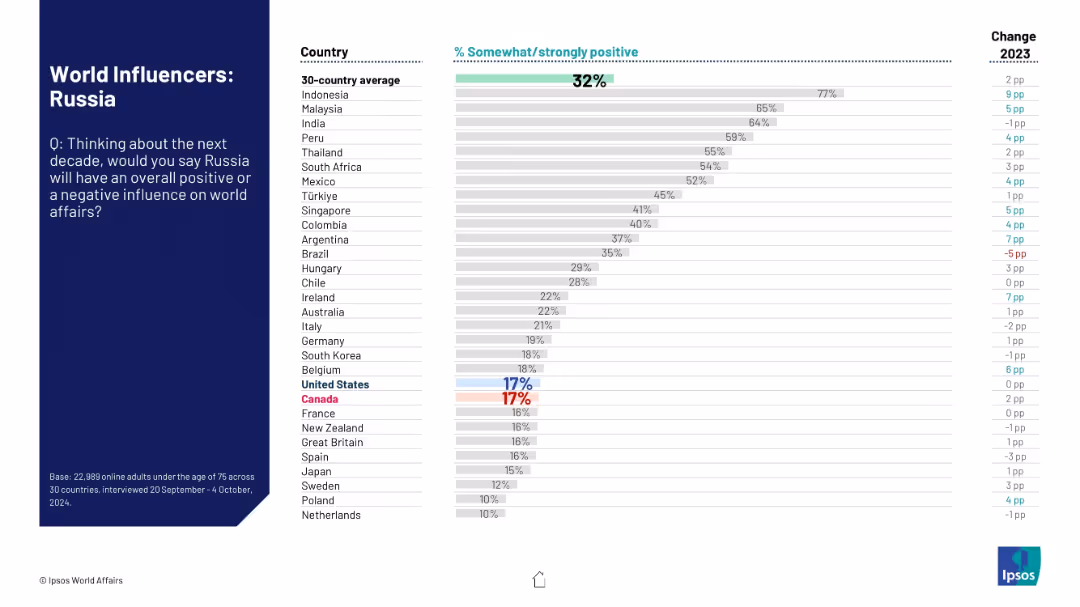
Standard design with bar chart on right and introductory context on left side.
Market Analysis and Trends
Government & Public Sector
This slide shows that Russia has the lowest perceived positive influence on global affairs among surveyed countries. Despite small upticks in some nations, overall global opinion remains highly negative.
Russia, global sentiment, geopolitical perception, Ipsos, international opinion, public influence, country ratings, trend change, 2024
Mixed Chart
IPSOS
Saved
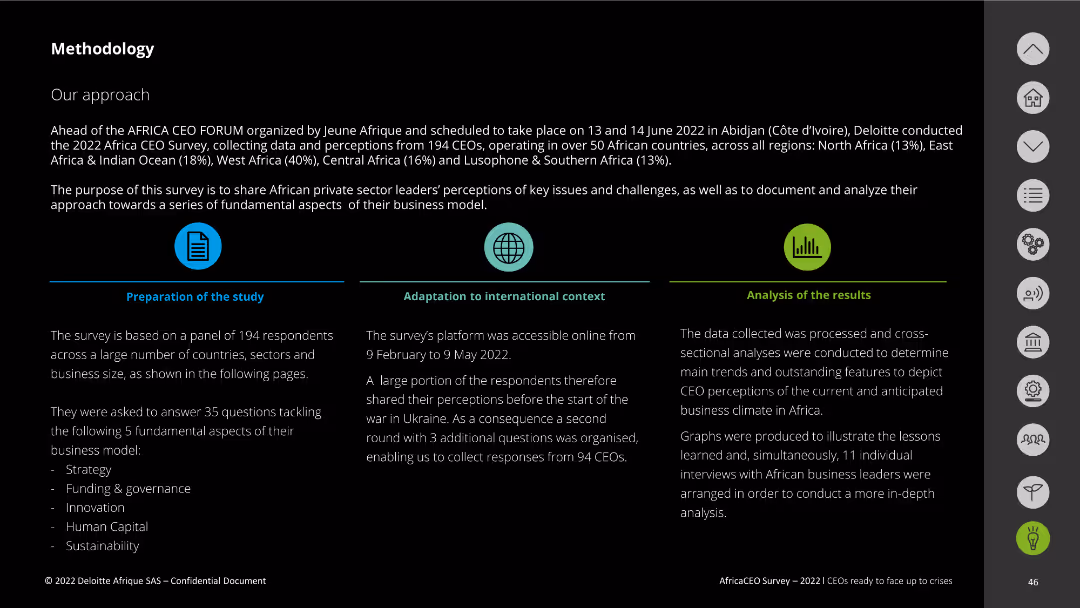
This slide provides an overview of the methodology with textual descriptions and icons.
Strategic Planning
Professional Services
It outlines the approach, preparation, adaptation, and analysis processes used in conducting the 2022 Africa CEO Survey.
methodology, survey approach, data analysis, Africa CEO Survey, preparation
Pillar
Deloitte
Saved
The slide includes tables and column charts presenting risk-based capital & liquidity metrics, end-of-period assets, and liabilities and equity.
Financial Performance
Financial Services
This slide gives a comprehensive view of capital and balance sheet metrics, highlighting liquidity, capital ratios, and asset distribution.
Capital, Balance Sheet, Liquidity, Assets, Liabilities, Equity, Metrics, Ratios, Financial, Performance
Multiple Chart
Citigroup
Saved
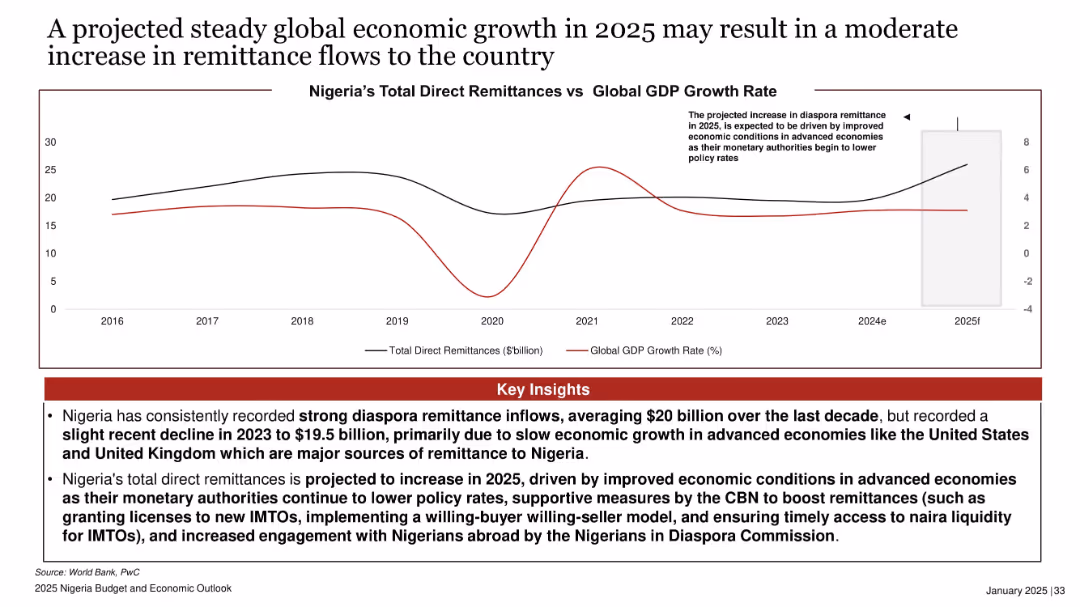
Dual-line chart comparing Nigeria’s remittances to global GDP growth; right-side projection box; red-highlighted insights box.
Market Analysis and Trends
Financial Services
Projects moderate increase in remittance inflows to Nigeria in 2025, driven by improved global economic conditions. Highlights historical remittance trends and links growth to falling interest rates and supportive policies by the CBN and Diaspora Commission.
remittances, diaspora, global GDP, economic growth, 2025, CBN, Nigeria, foreign inflows, IMTOs, diaspora engagement
Mixed Chart
PwC/Strategy&
Saved
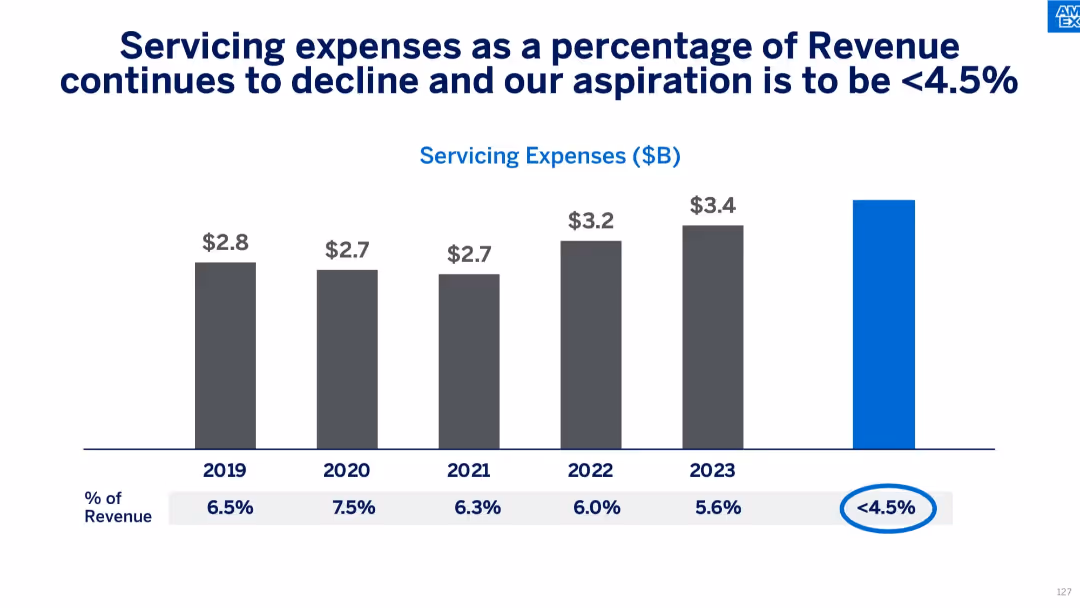
Gray vertical bar chart showing servicing costs and their percentage of revenue from 2019–2023 with future goal.
Operational Efficiency
Financial Services
The slide demonstrates a consistent decrease in servicing expenses as a percentage of revenue, with a goal of reaching under 4.5%. It supports Amex's efforts to improve operational cost efficiency and long-term financial planning.
servicing costs, efficiency, expense reduction, Amex targets, cost management, financial planning, operational strategy
Single Chart
McKinsey
Saved
The slide displays a stylized image of a sailing boat on blue waters with mountains in the background, under a bright yellow sun. The Vietnamese flag is visible on the boat, and a lighthouse stands on a green landmass. The graphical elements are simplistic, making it visually clear and uncluttered. The country name "Vietnam" is boldly placed.
Industry Overview
Hospitality & Tourism
The slide is a visual representation meant to showcase Vietnam, likely to be used in a context of discussing tourism, hospitality, or geographical overviews. The image conveys a sense of place and is likely to engage an audience with an interest in the region or in travel-related topics.
Vietnam, tourism, sailing, lighthouse, hospitality, travel, geography, image representation
Title
Bain
Saved
Line chart displaying the cost-to-income ratio (CIR) evolution in Europe from 2008 to 2023. Additional sections on AI investment impact and profit potential gap.
Financial Performance
Financial Services
Shows the decline in Europe's cost-to-income ratio over 15 years and discusses the impact of AI investment on profitability and cost efficiency.
CIR, AI investment, profitability, Europe, cost efficiency
Multiple Chart
Kearney
Saved
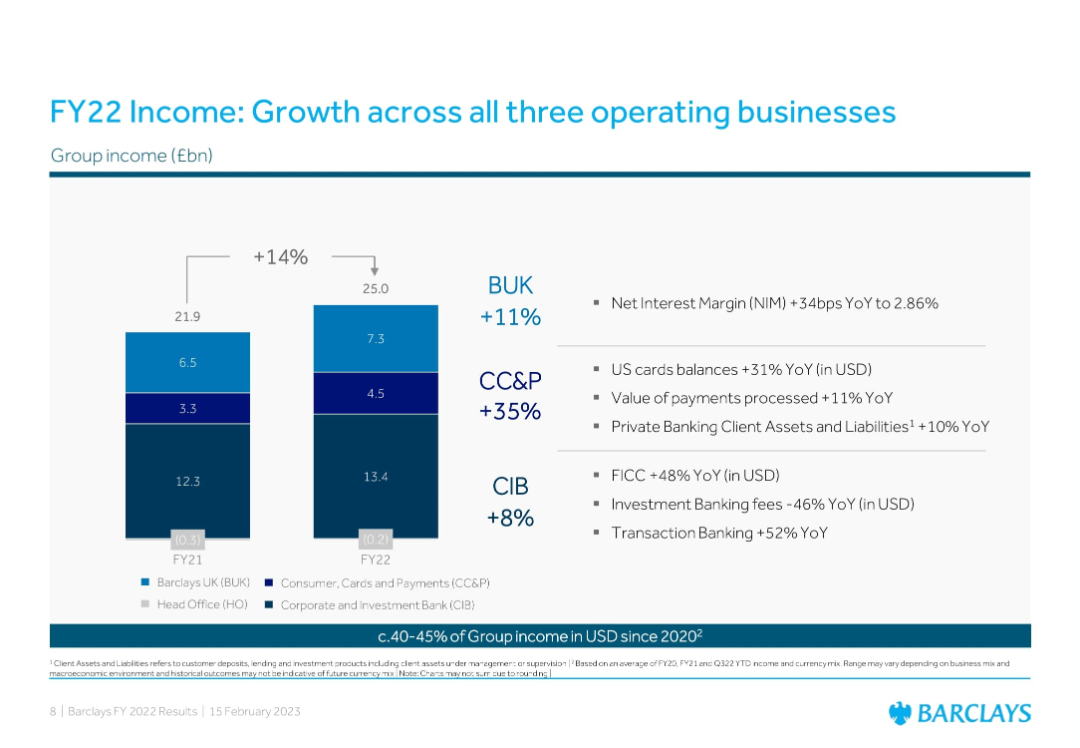
Stacked bar charts + bullet insights; YoY group income growth across BUK, CC&P, and CIB
Strategic Planning
Financial Services
Compares income across three Barclays business units in FY21 vs. FY22 with YoY percentage changes. Bullet points outline business segment growth drivers like US card balances, transaction banking, and FICC performance.
Income Growth, Operating Units, BUK, CC&P, CIB, YoY, Strategy, Revenue, Barclays
Mixed Chart
Barclays
Saved
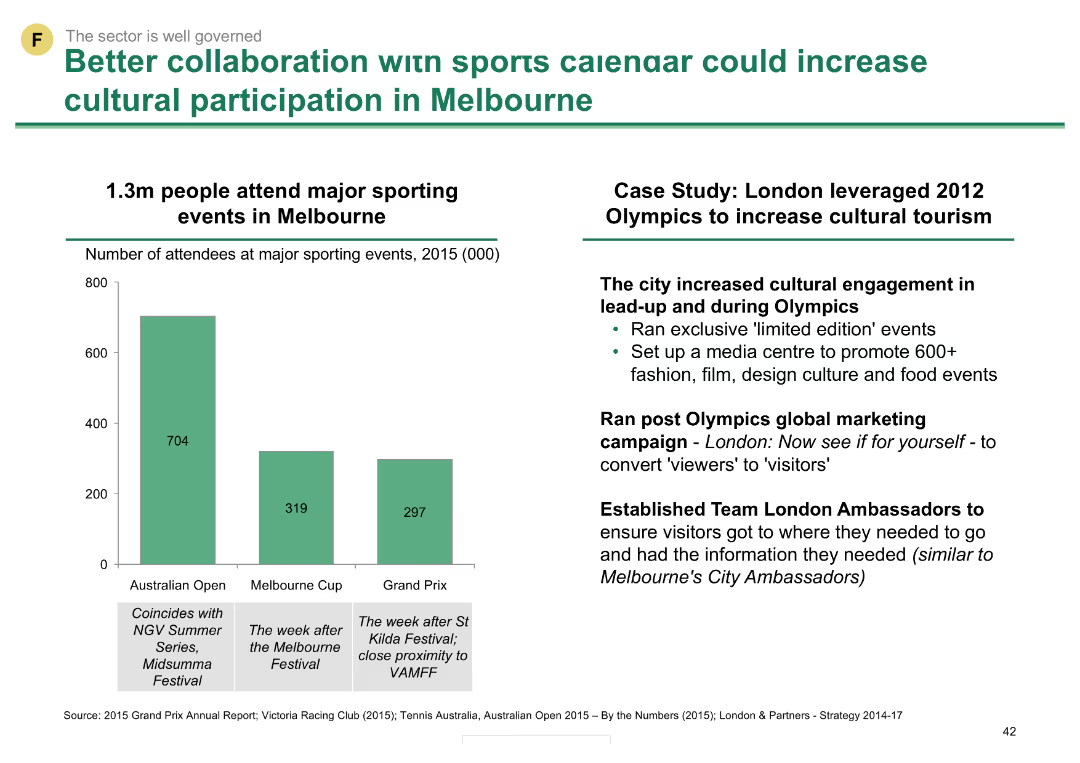
Column chart showing attendance numbers for major sporting events in Melbourne in 2015, alongside a case study of the London 2012 Olympics' impact on cultural tourism.
Strategic Planning
Hospitality & Tourism
This slide highlights the potential of leveraging sports events to boost cultural participation, using Melbourne and the London 2012 Olympics as examples.
sports, cultural participation, Melbourne, London, Olympics, tourism, events, collaboration, strategic planning
Mixed Chart
BCG
Saved
Previous
Next
If nothing, comes up, please save your slides first
Create a FREE account to continue browsing
Receive Instant Access to 1,000+ slides from companies like McKinsey, Google, and Goldman Sachs
First Name
Last Name
Email
Password
I agree to all
Terms & Privacy Policy
Thank you! Your submission has been received!
Oops! Something went wrong while submitting the form.
Have an account?
Sign in
Column Chart
Heatmap
Chevron
Org Chart
Infographic
Callouts
Timeline
List
Graphic
Picture
Process Flow
Diagram
Paragraph
Map
Table
Framework
Subtitle
Takeaway Box
Icon
Other Chart
Radar Chart
Waterfall Chart
Mekko Chart
Pie Chart
Scatter Plot
Line Chart
Bar chart
Bullet points