My Account
My Slides
Search by Category
Templates
Leave Feedback
Login
Logout
Get Started
Browse all Slides
Browse all Slides
Create a FREE Account
Instant access to 1,000+ real slides from top companies like McKinsey, BCG, Goldman Sachs, Google and many more!
First Name
Last Name
Email
Password
I agree to all
Terms & Privacy Policy
Thank you! Your submission has been received!
Oops! Something went wrong while submitting the form.
Have an account?
Sign in
Saved Slides
The slide includes a column chart showing the frequency of crypto asset trading among participants. Each column represents different trading frequencies.
Market Analysis and Trends
Financial Services
This slide displays the frequency at which participants traded crypto assets over the past year, ranging from daily to never.
Trading frequency, crypto, assets, participants, analysis
Mixed Chart
IPSOS
Saved
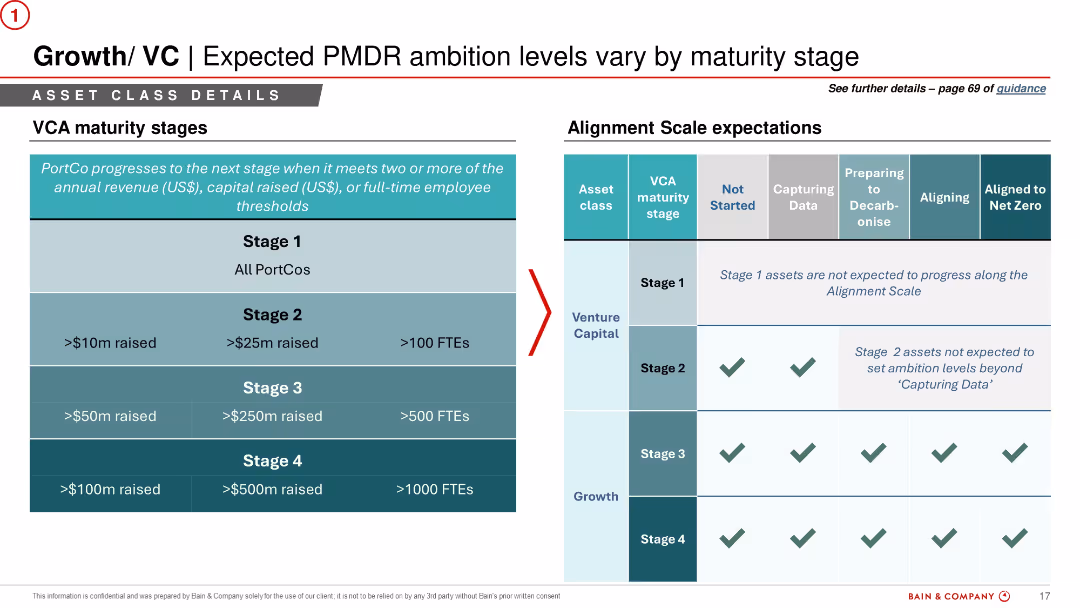
Split layout with a maturity stage table on the left and corresponding ambition levels in a matrix on the right. Uses checkmarks and shaded areas for visual emphasis.
Organizational Structure and Change
Financial Services
Links VC asset maturity stages (based on revenue, capital, and FTEs) with expected ambition levels in decarbonisation. Explains which stage each PortCo should achieve along the alignment scale, setting practical expectations for different investment levels.
growth stages, venture capital, PortCo, ambition, alignment scale, FTE, revenue, ESG strategy
Table
Bain
Saved
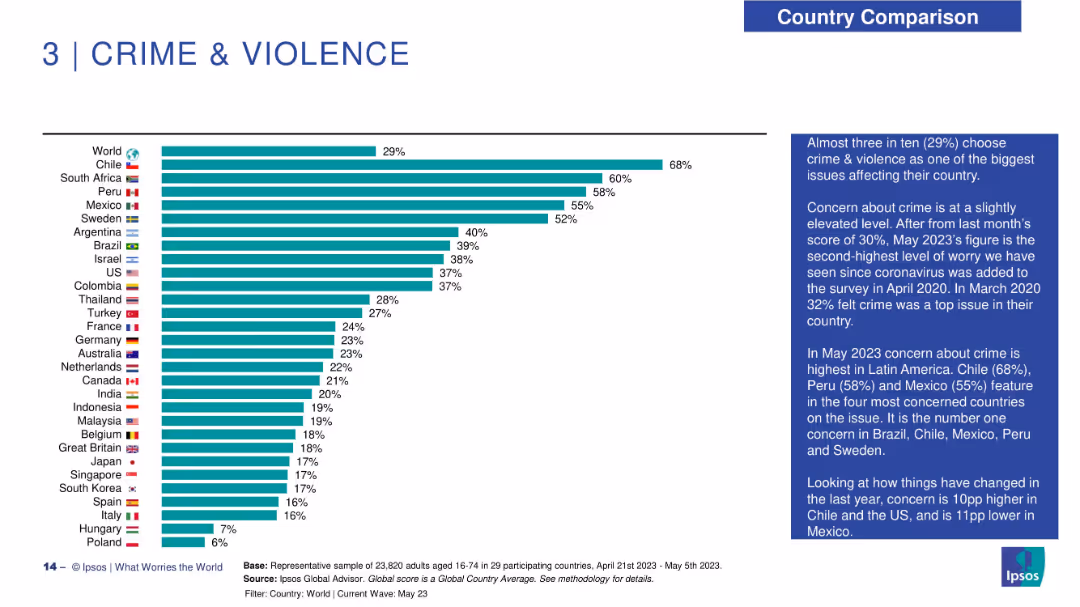
Bar chart layout on left with country flags and names on the Y-axis and horizontal bars indicating concern percentage. Right side features a narrative analysis in a dark blue box. Consistent with other slides in visual style.
Market Analysis and Trends
Government & Public Sector
This slide presents public concern over crime and violence across 29 countries. Chile has the highest concern (68%), followed by South Africa (60%) and Peru (58%). The global average is 29%. The right-hand commentary discusses Latin America's prominence in concern and notes recent changes, such as increased concern in Chile and decreased concern in Mexico.
crime, violence, public safety, global perception, concern levels, Latin America, Ipsos, societal issues, survey trends, insecurity
Mixed Chart
IPSOS
Saved
Slide integrates flow diagrams and bullet points. Visuals and text are arranged to delineate the full-service proposition and evolving client needs.
Strategic Planning
Financial Services
Discusses Barclays' strategy to align services with client needs, highlighting aspects like financing, investments, and risk management. It outlines the focus on digital delivery, client relationships, and market access.
strategy, services, client needs, digital, investments
Header Vertical
Barclays
Saved
Pie charts showing the employment status and satisfaction levels of highly skilled workers in local companies.
Human Resources and Talent Management
Professional Services
Surveys the employment trends among highly skilled workers in local companies, noting high satisfaction and mobility.
Employment trends, skilled workers, job satisfaction, local companies
Multiple Chart
Accenture
Saved
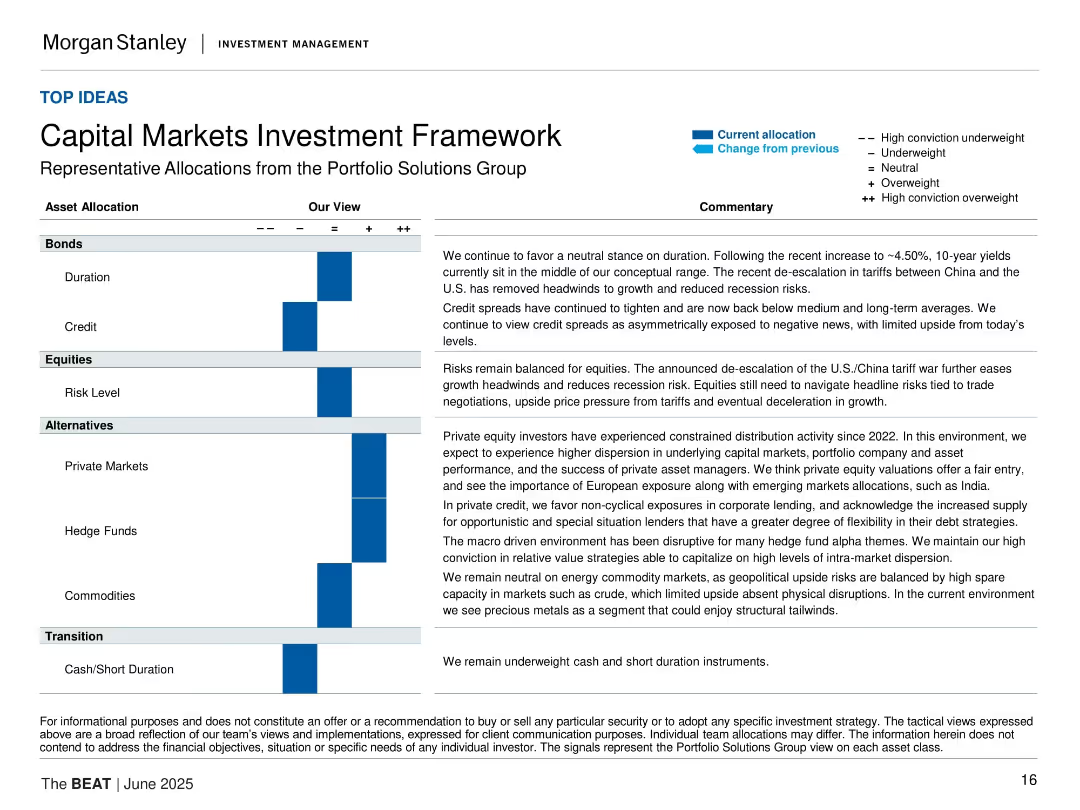
Matrix of asset allocation views with horizontal bars and textual commentary; structured, corporate layout.
Strategic Planning
Financial Services
The slide presents the Portfolio Solutions Group’s tactical asset allocation views across bonds, equities, alternatives, and cash. Commentary explains each allocation decision within a macroeconomic context.
capital markets, investment strategy, asset allocation, portfolio, tactical view, duration, credit, equities, alternatives
Table
Morgan Stanley
Saved
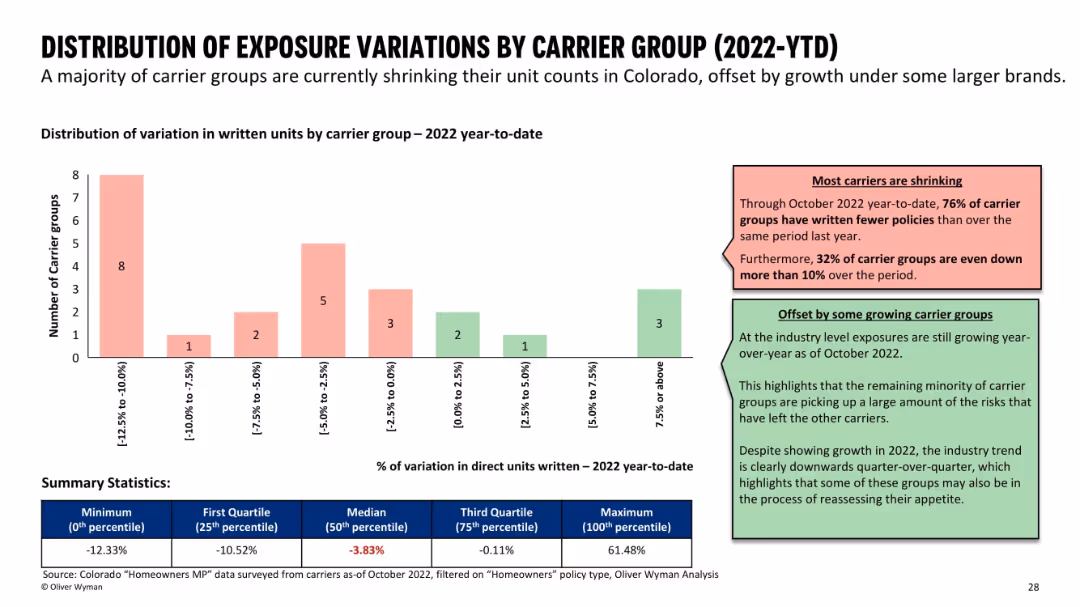
Bar chart grouped by unit variation ranges; supported by color-coded comments and summary stats at the bottom.
Risk Assessment and Management
Financial Services
Analyzes changes in written units by carrier groups in 2022. Most carriers are shrinking, with 76% reducing exposure, while a few are growing. A summary table shows statistics like median and quartile values for unit variation percentages.
insurance carriers, exposure variation, market trends, growth vs shrinkage
Mixed Chart
Oliver Wyman
Saved
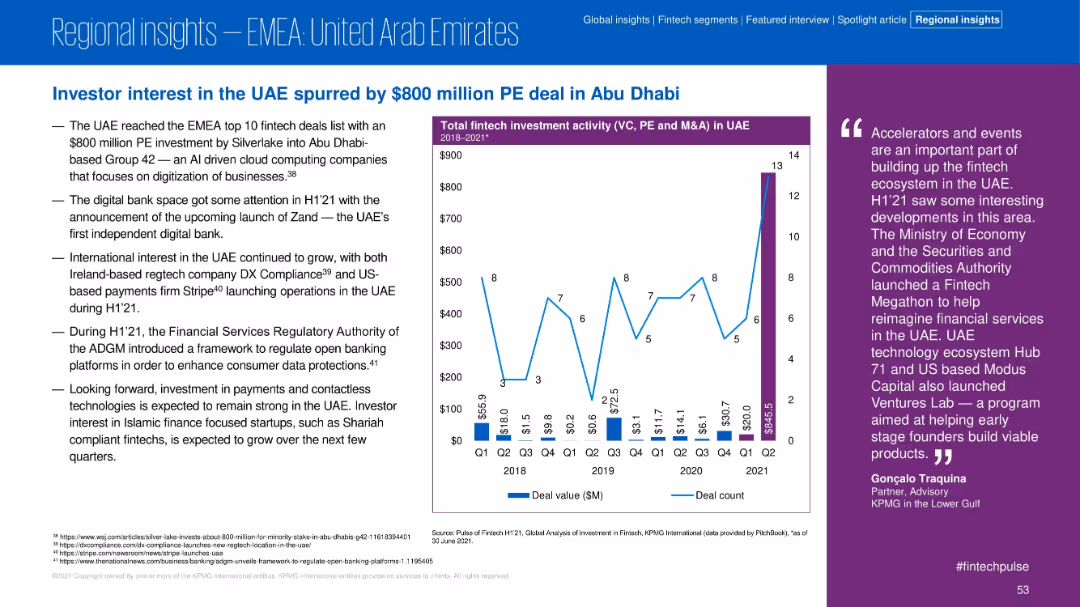
Standard layout with left-aligned narrative, center chart, and right-side quote. Color scheme and formatting match regional series.
Investment Analysis
Financial Services
The UAE fintech market was boosted by an $800M PE deal in H1 2021. The slide highlights the growth of digital banks, international fintech activity, and regulatory frameworks enhancing consumer protections.
UAE, PE Deal, Fintech, Abu Dhabi, Digital Bank, Investment, Regulation, H1 2021
Mixed Chart
KPMG
Saved
Three sets of column charts compare net profit contribution, base fees, and assets under management (AUM) over fiscal years and semesters.
Financial Performance
Financial Services
Analyzes the asset management division's financial performance over time, displaying trends in profit contribution, base fees, and AUM, suitable for historical performance analysis or financial planning.
asset management, net profit, base fees, AUM, financial, performance, trends
Multiple Chart
Goldman Sachs
Saved
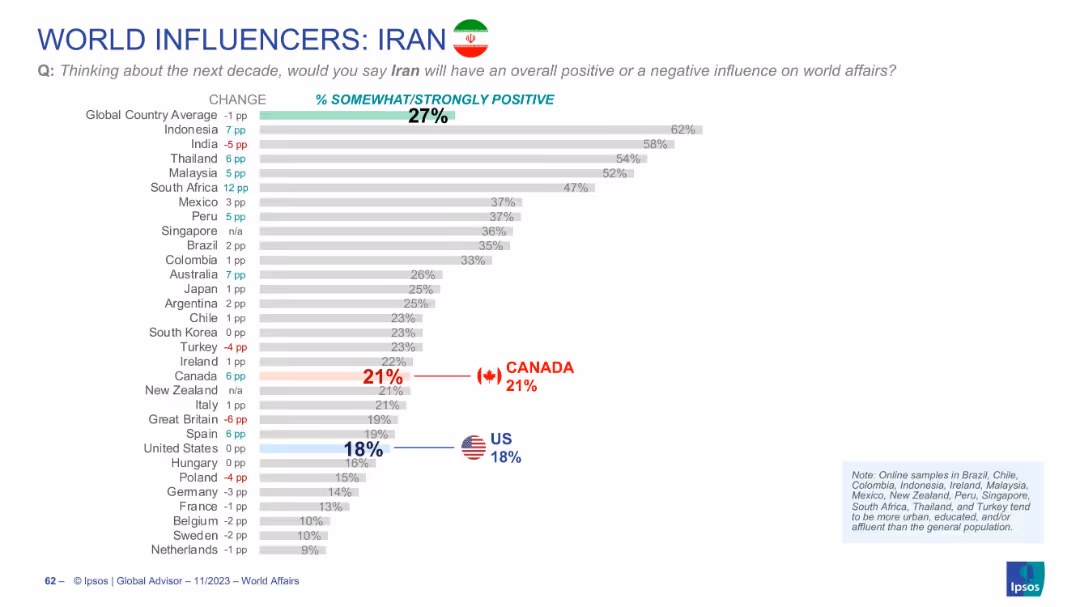
Bar chart displaying global perception of Iran’s influence, with flags highlighting US and Canada views and % changes.
Market Analysis and Trends
Government & Public Sector
Global perception of Iran’s influence is low (27% on average). Indonesia shows the highest approval, while the US (18%) and Canada (21%) are significantly below average.
Iran, global influence, international perception, Ipsos data, world affairs, rankings
Single Chart
IPSOS
Saved
This slide uses two bar charts to show market cap values in 2010 versus 2019 for companies in the US and China, with a percentage of tech companies noted.
Competitive Landscape
Technology & Software
Analyzing the shift in market capitalization among top companies in the US and China from 2010 to 2019, the slide indicates a significant increase in the proportion of tech companies.
market cap, tech companies, US, China, 2010 vs 2019
Multiple Chart
McKinsey
Saved
The slide combines text and a line chart. The text details the capital structure and free cash flow deployment, while the chart shows share repurchases over time.
Financial Performance
Financial Services
It discusses capital structure, financial leverage, free cash flow deployment, including strategic acquisitions, and debt ratings.
Capital Structure, Leverage, Free Cash Flow, Share Repurchases, Debt Ratings, Investment Grade
Mixed Chart
Gartner
Saved
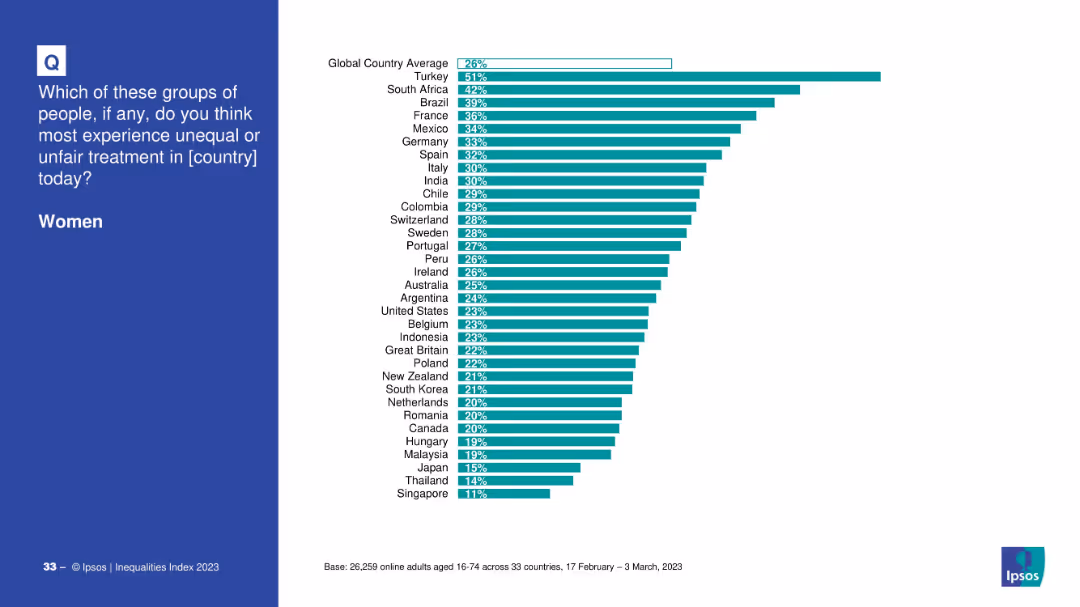
Country-level bar chart showing the perceived unfair treatment of women.
Customer and Market Segmentation
Government & Public Sector
This slide ranks countries based on how many believe women experience unfair treatment. Turkey, South Africa, and Brazil top the list, while countries like Singapore and Japan are at the lower end of perception.
gender inequality, women, unfair treatment, international comparison, discrimination
Mixed Chart
IPSOS
Saved
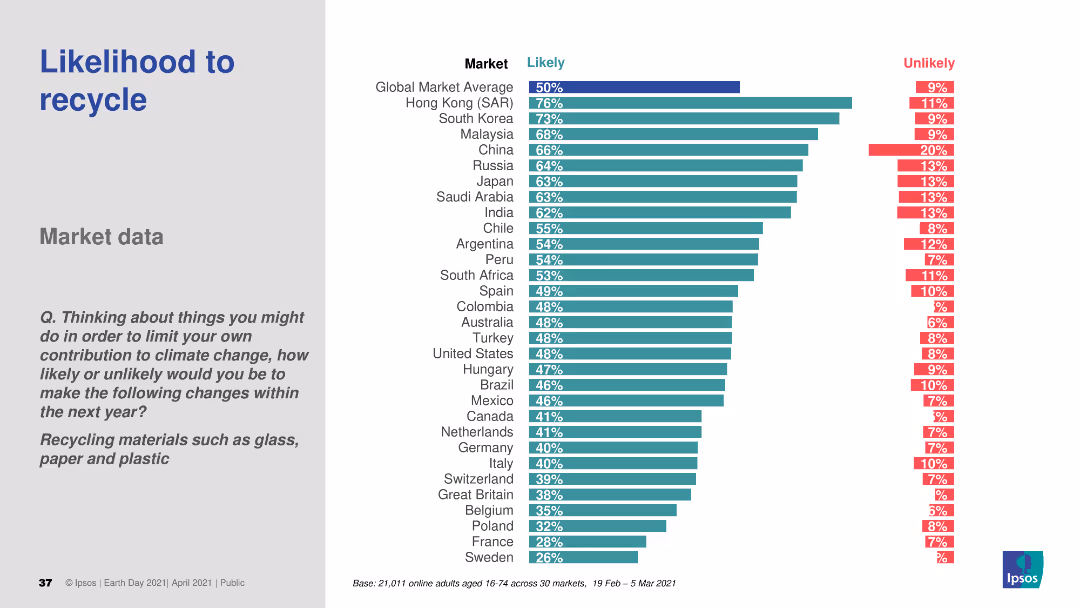
A bar chart (horizontal) illustrating the likelihood of recycling behaviors across various countries. Different colors represent likely and unlikely responses.
Market Analysis and Trends
Environmental Services & Sustainability
This slide provides a comparative analysis of consumer recycling behaviors. It highlights the likelihood of recycling materials like glass, paper, and plastic, offering insights into environmental awareness and practices.
recycling, consumer behavior, sustainability, environmental awareness, comparative data
Multiple Chart
IPSOS
Saved
The slide features multiple column charts on a dark background, focusing on technology-enhanced healthcare preferences, with white and yellow text.
Technology and Digital Transformation
Healthcare & Pharmaceuticals
It highlights consumer readiness for personalized medicine, genetic testing, and wearable technology in healthcare.
technology, personalized care, genetic testing, survey, Germany
Mixed Chart
EY
Saved
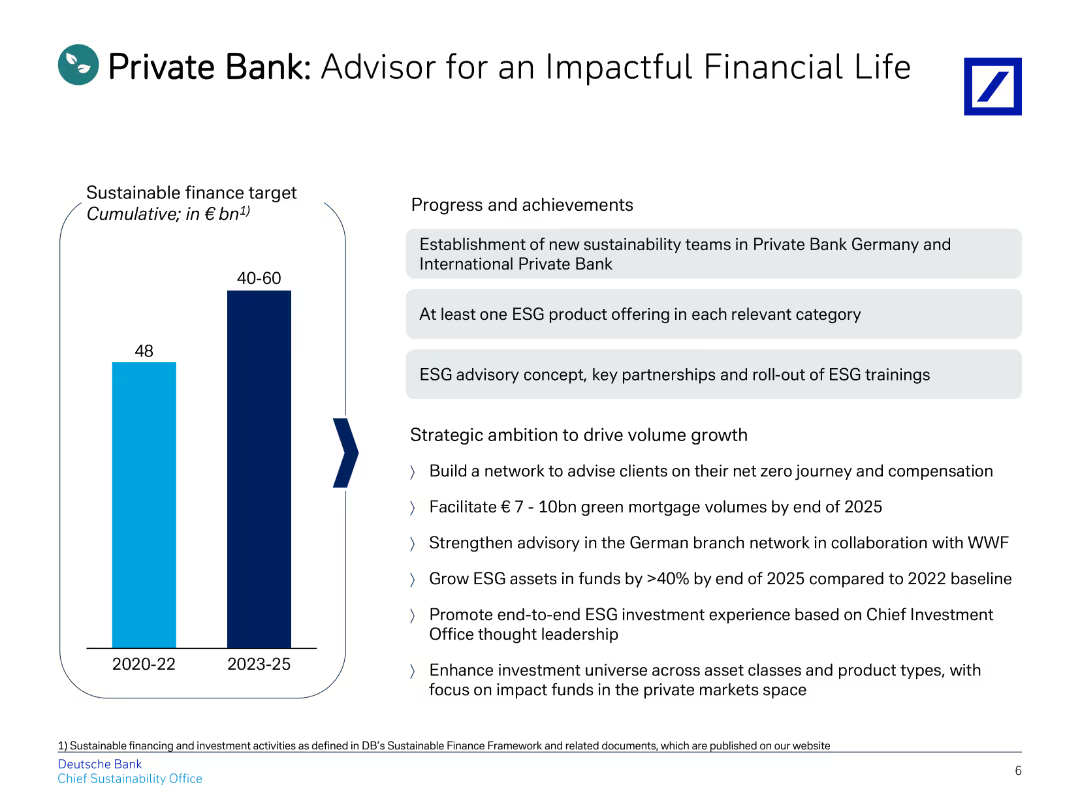
The slide includes a title, a vertical bar chart on the left, and bullet points on the right detailing progress and strategic goals.
Client Case Studies
Financial Services
Describes the progress and strategic ambitions of the Private Bank, emphasizing sustainable finance and ESG advisory services.
private, advisor, financial, ESG, impact
Mixed Chart
Deutsche Bank
Saved
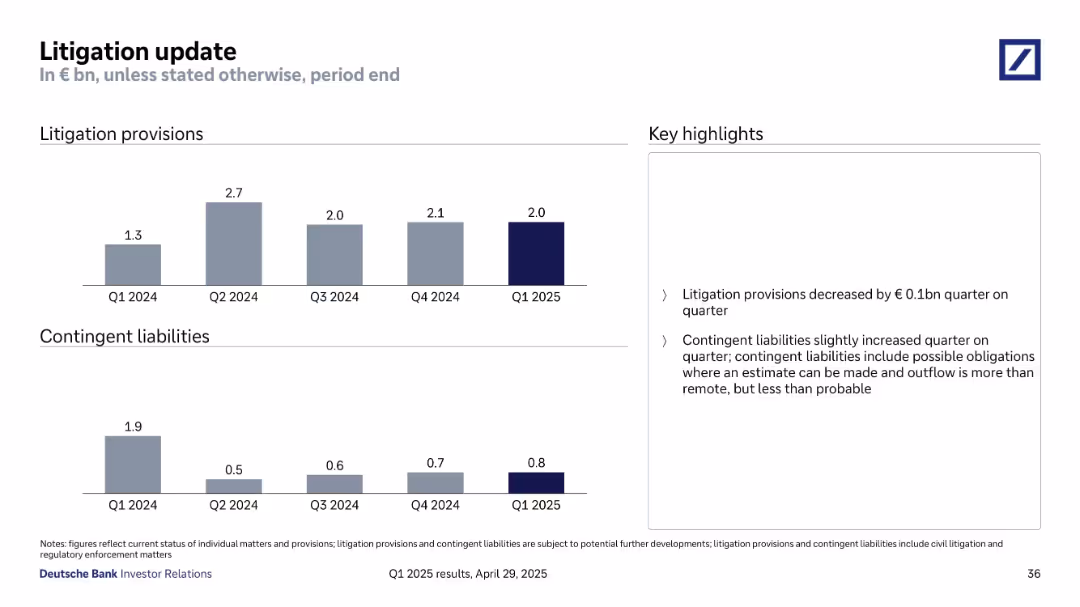
Bar charts display litigation provisions and contingent liabilities by quarter. Key highlights summarized in right-side text box.
Risk Assessment and Management
Financial Services
Deutsche Bank's legal risks are outlined through quarterly trends in litigation provisions and contingent liabilities from Q1 2024 to Q1 2025. The slide notes a slight decrease in provisions and a marginal increase in contingent liabilities, while emphasizing ongoing regulatory developments and potential obligations.
litigation, provisions, contingent liabilities, legal risk, compliance
Mixed Chart
Deutsche Bank
Saved
Includes infographics and bullet points, detailing reasons why immersive-reality technologies are significant for business leaders.
Technology and Digital Transformation
Technology & Software
Argues for the importance of immersive-reality technologies, pointing to trends and forecasts for market growth and innovation.
immersive reality, market trends, innovation, venture capital, training scalability
Header Horizontal
McKinsey
Saved
The slide includes detailed text and small graphs to explain how highly resilient boards behave differently and the steps to increase resilience.
Risk Assessment and Management
Professional Services
The slide outlines how resilient boards are proactive in risk management, use data-driven decision-making, and embed risk strategies within business operations, offering actionable steps for improvement.
resilient boards, risk management, professional services, resilience, decision-making, data-driven, improvement steps
Mixed Chart
EY
Saved
The slide shows a column chart displaying the growth in Global Alternatives AUM with predictions up to 2027, complemented by bullet points discussing industry dynamics on the side. The color blue is used to represent data points effectively against the dark background.
Client Case Studies
Financial Services
Highlights a case study on the collaboration between global banking and market sectors to show growth opportunities, suitable for illustrating market expansion and client base growth.
Case study, banking, market growth
Mixed Chart
Goldman Sachs
Saved
Slide contains multiple pie charts and column charts showing the composition of deposits and liquidity metrics. Layout is straightforward with distinct color coding.
Financial Performance
Financial Services
Analysis of funding sources and liquidity ratios, important for assessing the financial health and operational capabilities.
funding, liquidity, deposits, financial health, ratios
Multiple Chart
Deutsche Bank
Saved
The slide includes icons and dense texts, a photograph of a sunrise over a solar farm, and a smaller photograph featuring a wind turbine. The layout is clean with bulleted text on the left and images on the right.
Market Analysis and Trends
Environmental Services & Sustainability
This slide presents recommendations for organizations to align their strategies with sustainable practices, highlighting the need for embedding climate goals into business operations and building trust through credible climate actions.
sustainability, climate goals, business strategy, credible actions, Science Based Targets
Header Vertical
Deloitte
Saved
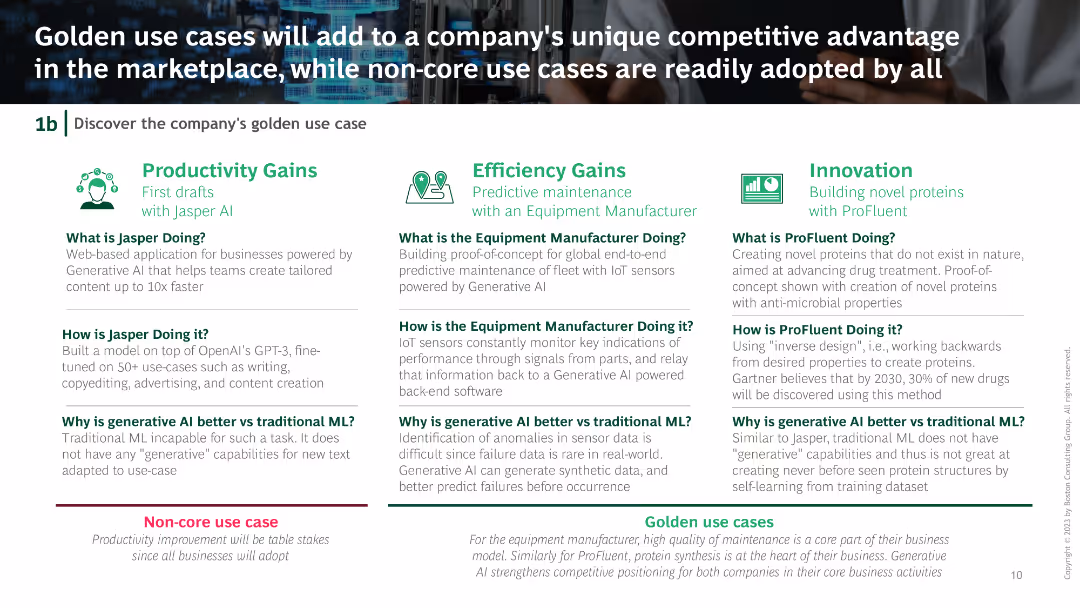
Side-by-side comparison of core and non-core use cases for Generative AI, with detailed examples under Productivity Gains, Efficiency Gains, and Innovation.
Strategic Planning
Technology & Software
The slide discusses strategic use cases of Generative AI that can provide a competitive advantage, compared to general use cases adopted by all businesses.
Generative AI, Competitive advantage, Use cases, Productivity, Efficiency
Pillar
BCG
Saved
This slide features multiple vertical bar (column) charts showing the S&P 500 sectors' current P/E ratios against 10-year highs, lows, and averages, with annotations for specific dates and a descriptive legend below. The layout is information-dense with a mix of vibrant colors for differentiation.
Financial Performance
Financial Services
The slide presents a comparative valuation analysis of S&P 500 sectors using current and historical P/E ratios, useful for financial analysts and investors.
S&P 500, valuation, P/E ratio, financial analysis, equity markets, historical comparison, investment, sector analysis
Single Chart
Morgan Stanley
Saved
The slide contains two column charts showing capital development and ratios at different stages, with notes on funding cost saves and capital ratio requirements.
Financial Performance
Financial Services
This slide discusses the group's strong capital position and outlines the expected development of capital ratios from 2023 to 2026, emphasizing funding cost savings.
capital position, ratios, funding cost, development, 2026
Multiple Chart
UBS
Saved
Previous
Next
If nothing, comes up, please save your slides first
Create a FREE account to continue browsing
Receive Instant Access to 1,000+ slides from companies like McKinsey, Google, and Goldman Sachs
First Name
Last Name
Email
Password
I agree to all
Terms & Privacy Policy
Thank you! Your submission has been received!
Oops! Something went wrong while submitting the form.
Have an account?
Sign in
Column Chart
Heatmap
Chevron
Org Chart
Infographic
Callouts
Timeline
List
Graphic
Picture
Process Flow
Diagram
Paragraph
Map
Table
Framework
Subtitle
Takeaway Box
Icon
Other Chart
Radar Chart
Waterfall Chart
Mekko Chart
Pie Chart
Scatter Plot
Line Chart
Bar chart
Bullet points