My Account
My Slides
Search by Category
Templates
Leave Feedback
Login
Logout
Get Started
Browse all Slides
Browse all Slides
Create a FREE Account
Instant access to 1,000+ real slides from top companies like McKinsey, BCG, Goldman Sachs, Google and many more!
First Name
Last Name
Email
Password
I agree to all
Terms & Privacy Policy
Thank you! Your submission has been received!
Oops! Something went wrong while submitting the form.
Have an account?
Sign in
Saved Slides
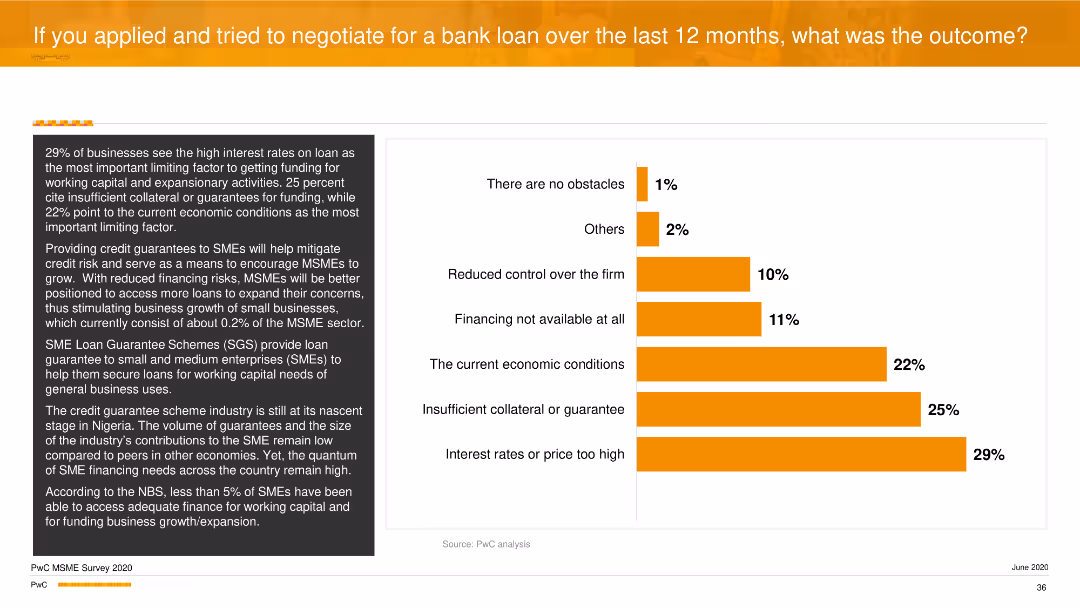
A vertical column chart detailing limiting factors in obtaining loans, such as high interest rates and insufficient collateral. Text on the left elaborates these factors.
Risk Assessment and Management
Financial Services
The slide focuses on the barriers to securing bank loans, emphasizing high interest rates and insufficient collateral as major obstacles. It discusses the potential impact of credit guarantee schemes on improving access to finance for SMEs.
Loans, Barriers, Financing, SMEs, PwC
Mixed Chart
PwC/Strategy&
Saved
This slide features multiple line charts showing Japan's inflation, wage growth, correlation between yen and equity market, and a column chart showing the price-to-book ratio of Japanese companies.
Market Analysis and Trends
Financial Services
The slide provides an economic overview of Japan, covering inflation and wage growth trends, currency market correlation with equity, and valuation metrics for Japanese companies, useful for market analysis.
Japan, economy, inflation, wage growth, yen, equity market, price-to-book ratio, Japanese companies, market analysis
Multiple Chart
JP Morgan
Saved
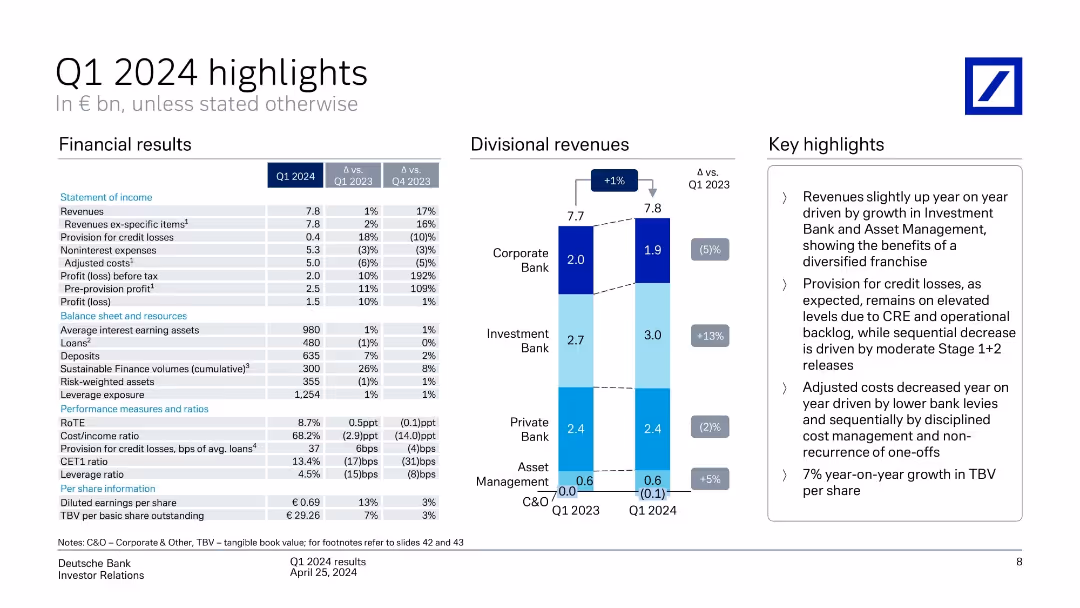
Left: detailed financial table; Right: stacked bar chart of division revenues; Top-right: bullet point summary. Balanced, text-heavy layout.
Financial Performance
Financial Services
Details Q1 2024 results including €7.8bn revenue, €2.5bn pre-provision profit, and €1.5bn net profit. Highlights growth in Investment Bank and Asset Management, improved cost management, and increased TBV per share.
financials, Q1 2024, revenue, costs, TBV, divisional performance
Mixed Chart
Deutsche Bank
Saved
The slide contains a line chart showing global temperature anomalies against pre-industrial levels and a bar chart depicting the global energy mix by country for 2022.
Market Analysis and Trends
Environmental Services & Sustainability
It provides insights into the impact of global warming by displaying temperature anomalies and the energy consumption mix of different countries, related to climate policy targets.
global warming, energy consumption, temperature anomalies, climate change, energy mix, sustainability, country comparison, J.P. Morgan, environmental impact, energy policy
Multiple Chart
JP Morgan
Saved
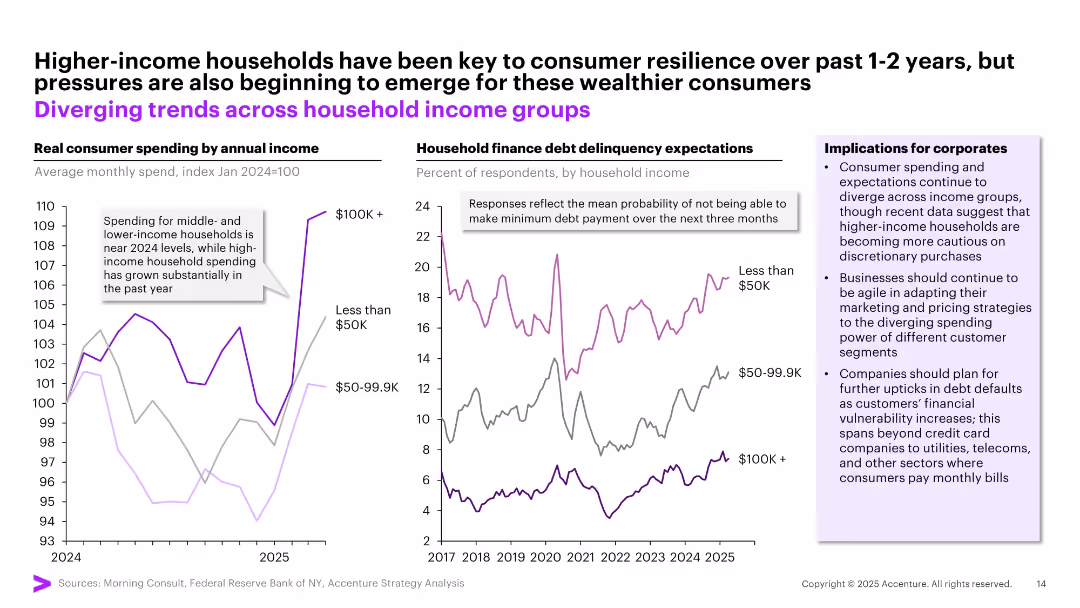
Two-panel layout: line charts on left and right show trends in consumer spending and debt expectations by income level; side note box lists implications; consistent use of purple and gray tones.
Market Analysis and Trends
Financial Services
The slide compares real consumer spending and debt delinquency expectations across three income brackets. It shows that high-income households have driven resilience but are starting to feel pressure, while lower-income groups remain financially vulnerable. Key corporate implications include the need for adaptive marketing and preparation for rising debt defaults.
consumer spending, debt expectations, income groups, financial pressure, corporate planning
Multiple Chart
Accenture
Saved
Features a bar chart showing the frequency of reviews for healthcare professional speakers. The layout is straightforward, using varying shades of green to represent different frequencies, which aids in distinguishing the data points clearly.
Regulatory and Compliance
Healthcare & Pharmaceuticals
Surveys the frequency at which healthcare organizations review their speaker rosters and contract statuses. It aims to provide insights into how often healthcare professionals are engaged and reassess their roles, contributing to better management and compliance in healthcare engagements.
speaker review, healthcare, engagement frequency, compliance, survey results
Single Chart
Deloitte
Saved
The slide has a combination of icons, bullet points, and a column chart showing annual shareholder activism campaigns in the US by size from 2017 to 2023. The layout is visually appealing and informative.
Risk Assessment and Management
Financial Services
The slide outlines key areas of focus for shareholder activism and the trends in activism campaigns over recent years, emphasizing the sectors most targeted by activists.
shareholder activism, trends, campaigns
Mixed Chart
JP Morgan
Saved
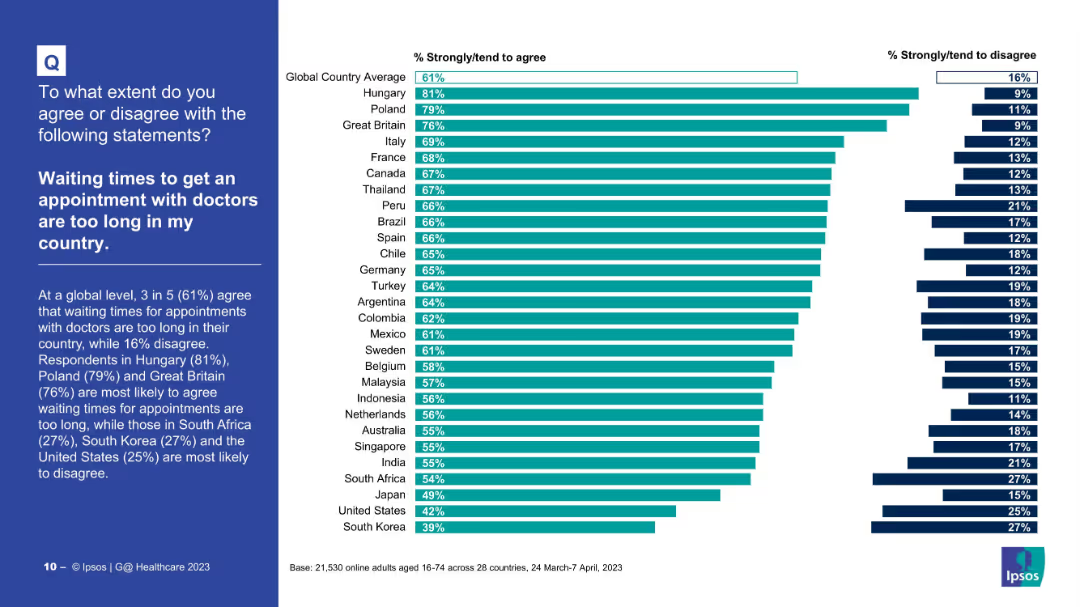
Left text with explanation; right side features bar chart ranking countries by agreement on long wait times for doctor appointments.
Performance Metrics and KPIs
Healthcare & Pharmaceuticals
The slide explores perceptions of appointment wait times. Countries like Hungary and Poland report the longest perceived wait times, while South Korea and the U.S. show lower concern. Global average agreement stands at 61%.
wait times, appointments, healthcare efficiency, public survey, delays, Ipsos, access to care, international comparison, satisfaction, medical services
Mixed Chart
IPSOS
Saved
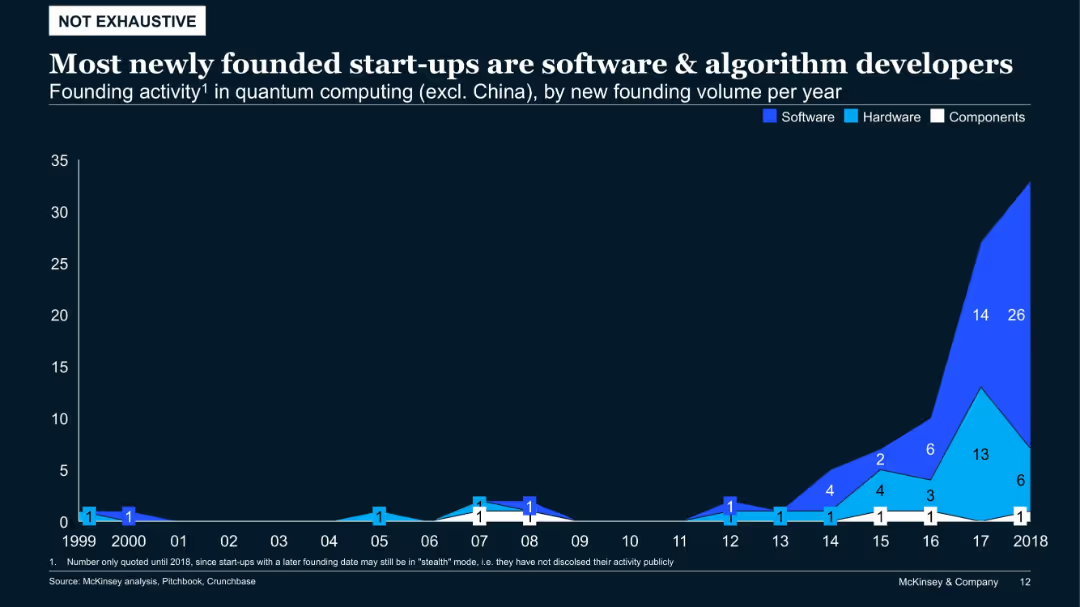
Area chart (stacked by type: software, hardware, components) showing founding volume by year (1999–2018)
Product and Service Analysis
Artificial Intelligence
Recent years show a sharp rise in quantum computing start-ups, predominantly in software and algorithm development. Hardware-focused ventures have remained comparatively fewer. This indicates a strategic shift toward scalable, software-based innovations.
quantum software, founding trends, components, hardware, algorithms, start-up analysis
Single Chart
McKinsey
Saved
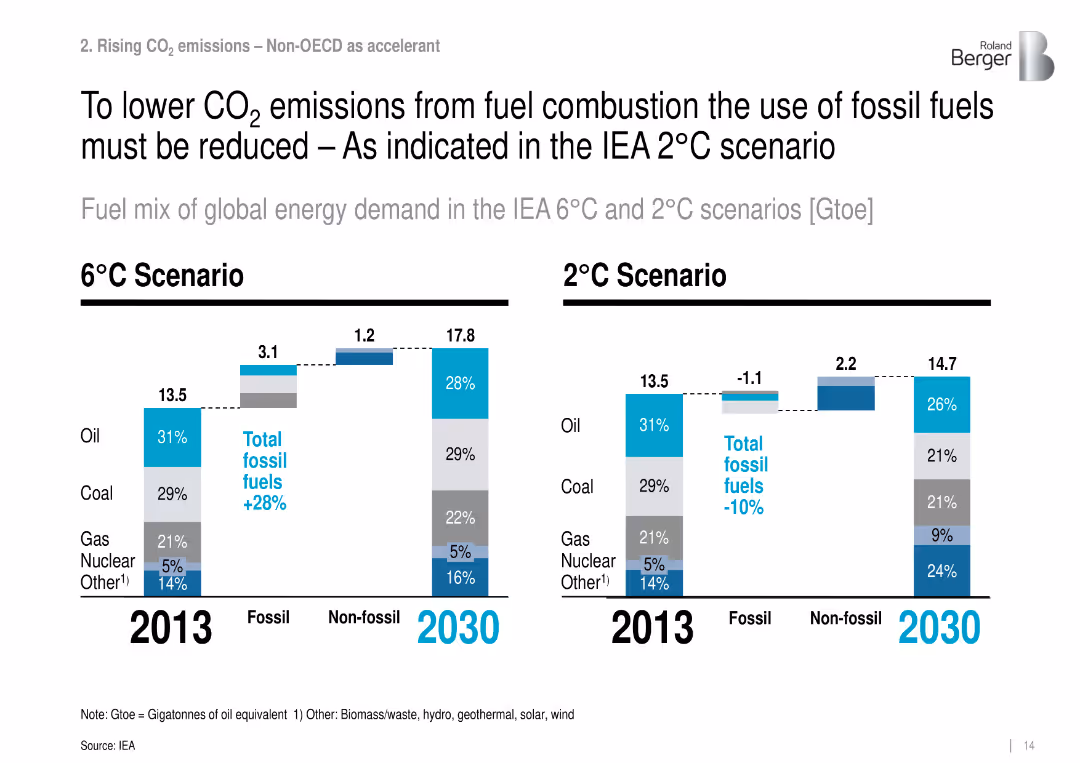
Bar charts of energy mix by fuel type for 2013 and 2030 under 2°C and 6°C IEA scenarios.
Strategic Planning
Environmental Services & Sustainability
Compares projected global energy demand and fossil fuel use under different warming scenarios, showing reductions in fossil fuel share needed to achieve the 2°C target.
energy mix, fossil fuels, IEA scenario, global warming, CO₂ reduction
Multiple Chart
Roland Berger
Saved
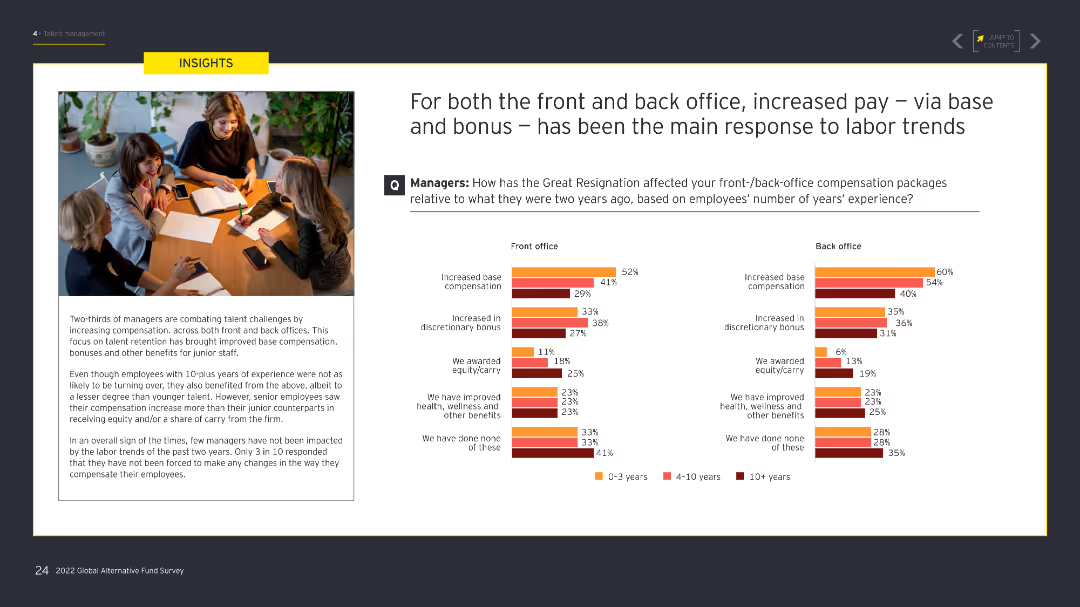
The slide features two column charts comparing the impact of the Great Resignation on front and back office compensation packages. An image on the left shows professionals in a casual meeting. The charts use different shades of orange and red to display data.
Human Resources and Talent Management
Financial Services
The slide outlines how managers have increased base compensation and discretionary bonuses to address labor challenges for both front and back offices, focusing on improving compensation to retain staff.
Compensation, labor trends, Great Resignation, front office, back office
Multiple Chart
EY
Saved
This slide features a large pie chart, presented in a green and white color scheme for clear differentiation of data points. The layout is clean and focuses on the main data visualization elements.
Technology and Digital Transformation
Technology & Software
Analyzes trends in AI deployment and investment, showing a significant increase in AI applications and investment plans. It is relevant for discussions on technology budgeting and strategic investment in the tech industry.
AI deployment, investment trends, technology, strategic investment, tech industry, application increase, budgeting
Mixed Chart
Deloitte
Saved
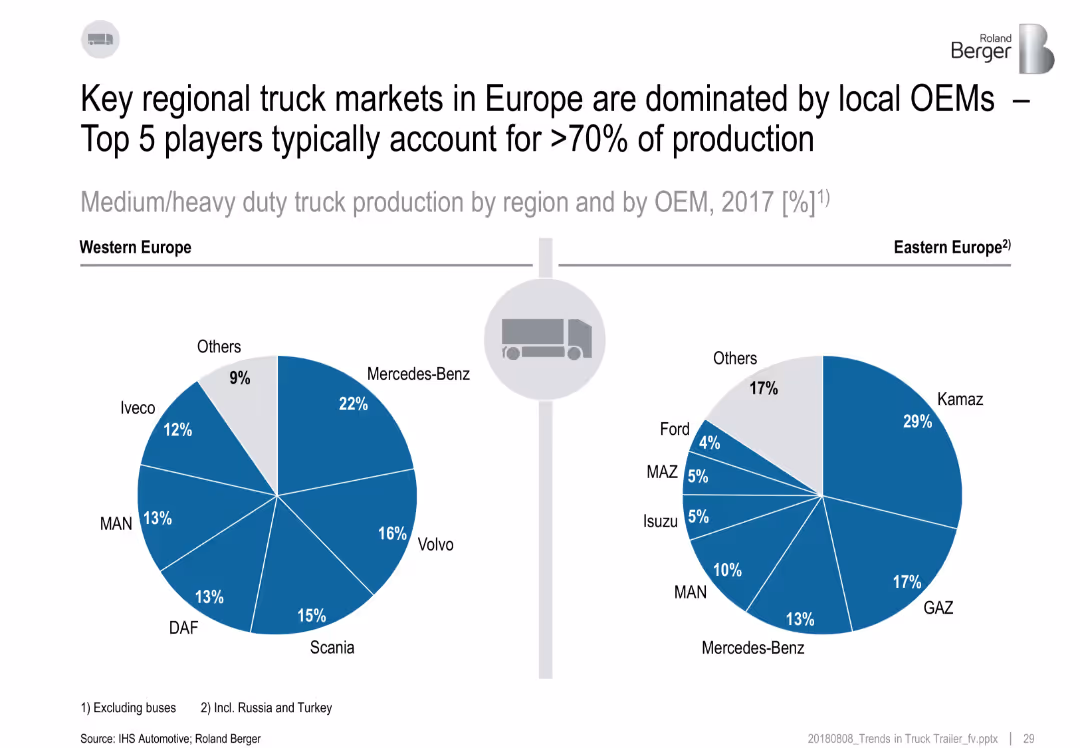
Two pie charts comparing market shares of OEMs in Western and Eastern Europe.
Competitive Landscape
Transportation & Logistics
The slide presents the OEM landscape for heavy-duty truck production in Europe. Western Europe is dominated by Mercedes-Benz, Volvo, and Scania, while Eastern Europe sees Kamaz, GAZ, and Mercedes-Benz leading. Top 5 OEMs hold over 70% share.
OEM, Europe, market share, trucks, production, Mercedes-Benz, Kamaz
Multiple Chart
Roland Berger
Saved
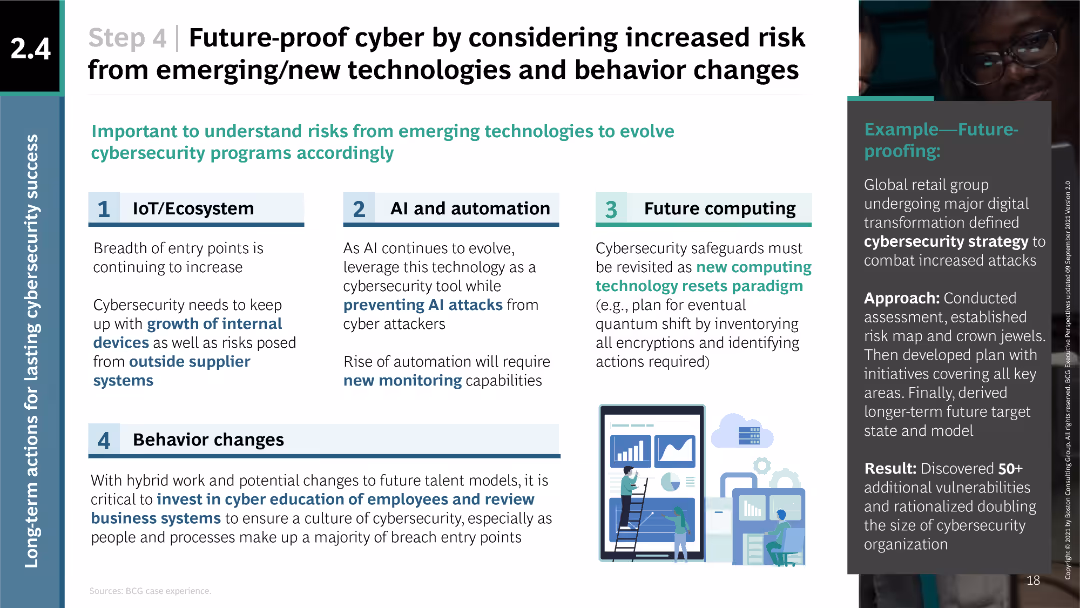
The slide is structured with numbered sections and icons representing IoT/Ecosystem, AI and automation, future computing, and behavior changes. It uses a balanced layout of text and icons to convey information clearly.
Strategic Planning
Technology & Software
The slide discusses the need for future-proofing cybersecurity strategies by considering risks from emerging technologies and behavior changes. It outlines four key areas to focus on, providing specific strategies and examples of future-proofing efforts by global companies.
future-proofing, IoT, AI, automation, computing, behavior
Linear Flow
BCG
Saved
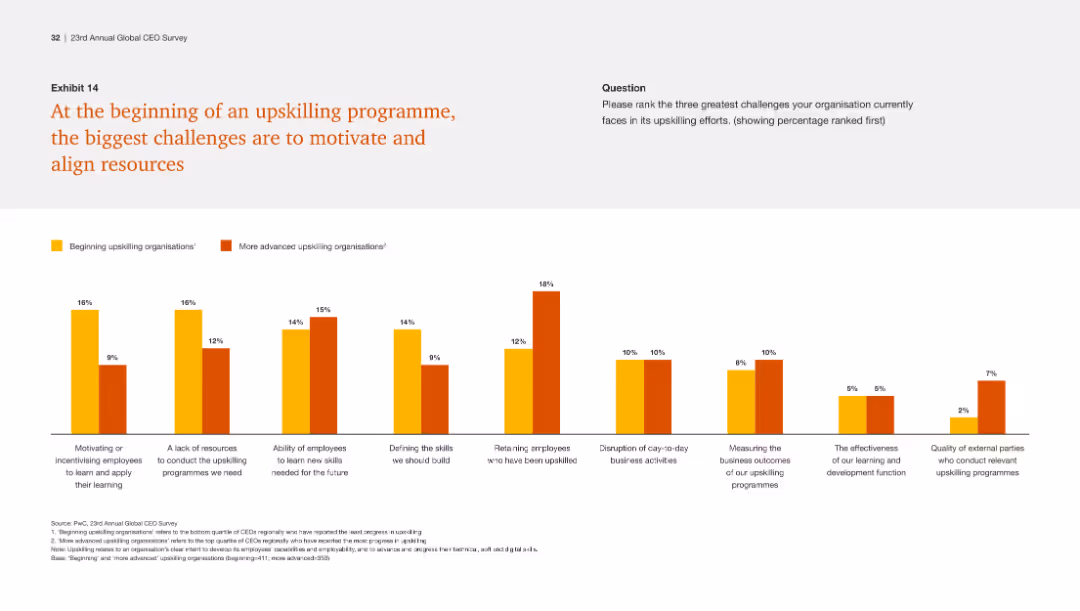
This slide includes a column chart comparing challenges faced by beginning and advanced upskilling organizations, with bars representing different challenges and their severity.
Human Resources and Talent Management
Professional Services
The slide discusses the primary challenges in initiating upskilling programs, including motivating employees, resource limitations, and aligning efforts.
Upskilling challenges, motivation, resource alignment, employee engagement, program initiation
Single Chart
PwC/Strategy&
Saved
This comparative slide is divided into two sections contrasting what has been done with what is left to do regarding the company's optimisation efforts. It's a visually simple design with checkmarks for completed tasks and bullet points for planned tasks.
Operational Efficiency
Financial Services
This slide assesses the company's operational optimisation progress against future goals, serving as a status update and action plan for continuous improvement.
Optimisation, Progress, Future Goals, Action Plan, Improvement
Table
Morgan Stanley
Saved
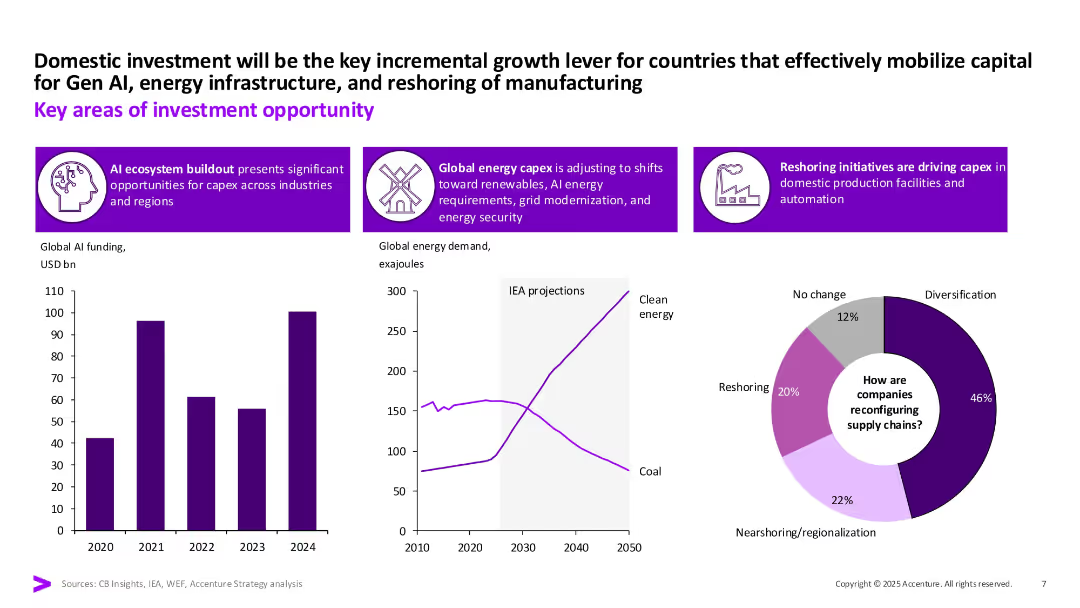
Three-part layout with icon-based headers, three data visualizations (bar chart, line graph, pie chart). Strong purple highlights and white space separate sections clearly.
Strategic Planning
Financial Services
Identifies domestic investment drivers such as GenAI, energy capex, and reshoring. Uses data visualizations to support claims around AI funding, clean energy demand, and supply chain diversification strategies.
GenAI, reshoring, clean energy, capex, investment, supply chains, diversification
Multiple Chart
Accenture
Saved
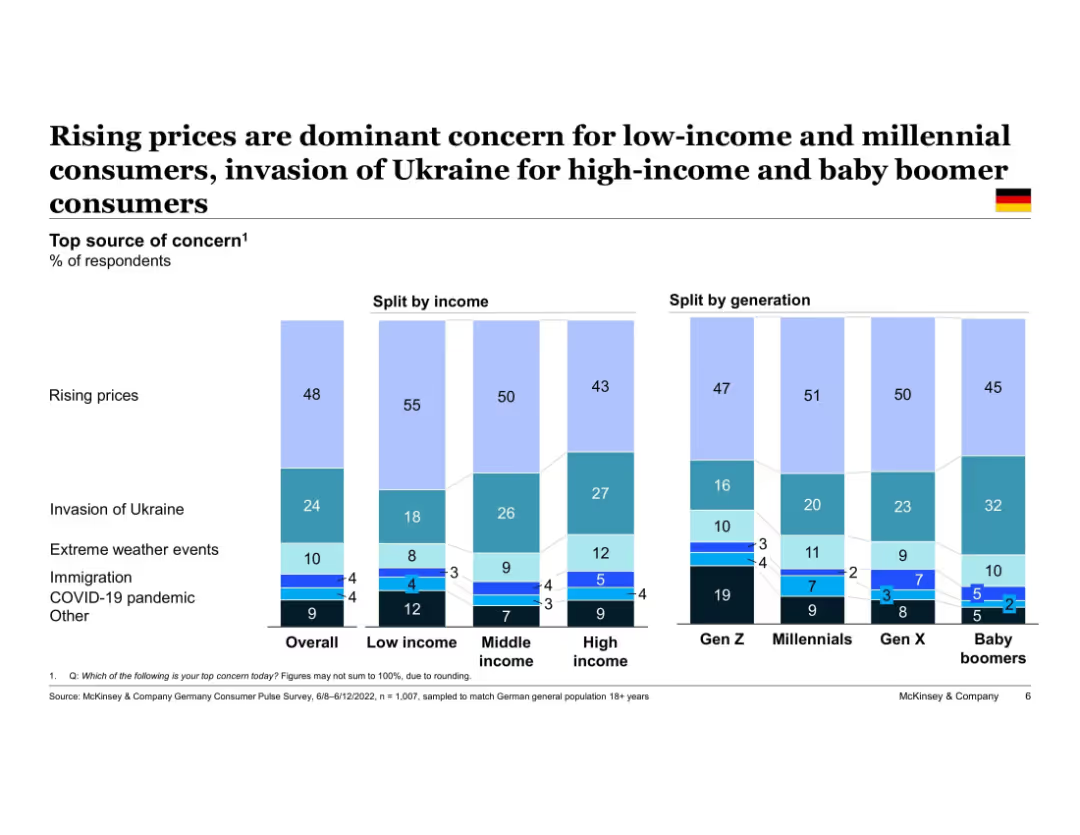
Dual split-bar charts dividing data by income and generation. Pastel color palette with a clean white background and national flag indicator.
Customer and Market Segmentation
Consumer Goods
This slide analyzes top concerns among German consumers segmented by income and age group. Rising prices concern all segments but more so low-income and younger people. Older and high-income individuals are more worried about geopolitical issues.
income segmentation, generational concerns, inflation, Ukraine war, consumer insights, Germany, behavioral analysis
Single Chart
McKinsey
Saved
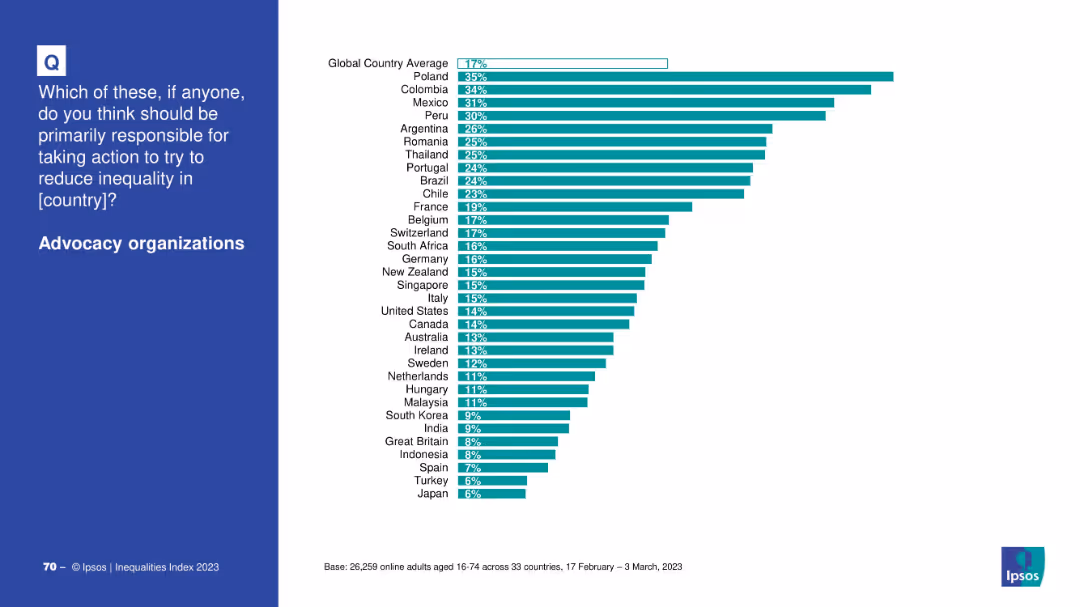
Horizontal bar chart by country comparing support for advocacy organizations’ role in addressing inequality; clean white background.
Market Analysis and Trends
Government & Public Sector
This slide shows how people in various countries perceive advocacy organizations as responsible actors in fighting inequality, with Poland and Colombia ranking highest.
advocacy, NGOs, inequality, country-level views, global opinion, public responsibility
Mixed Chart
IPSOS
Saved
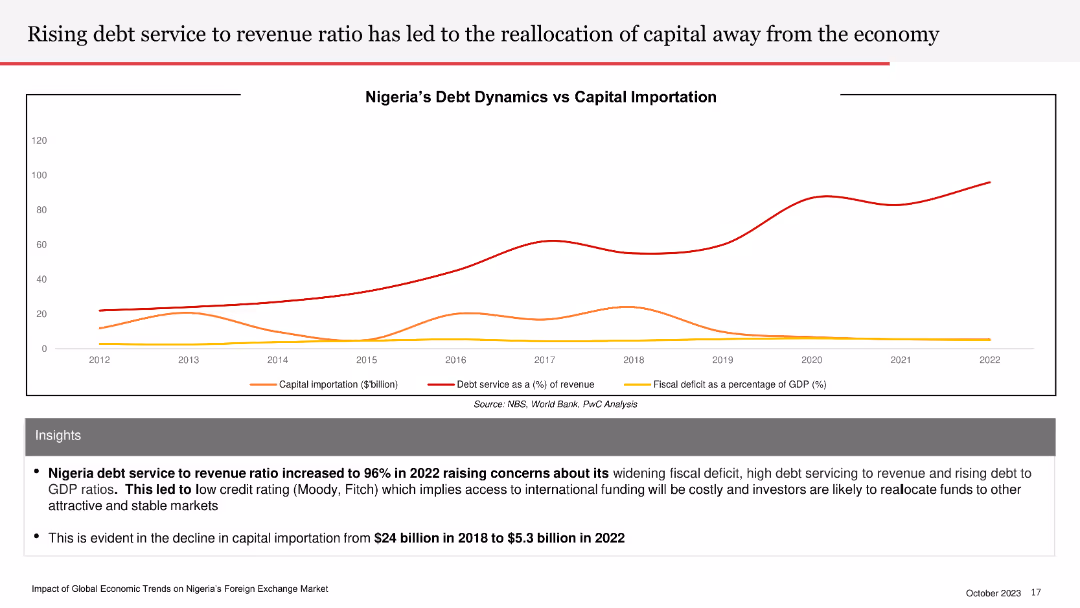
The slide features a line chart showing Nigeria’s debt dynamics versus capital importation over time, with separate lines for each metric.
Risk Assessment and Management
Financial Services
The slide highlights the rising debt service to revenue ratio in Nigeria and its impact on capital importation and economic stability.
debt service, revenue ratio, capital importation, Nigeria, economic impact
Mixed Chart
PwC/Strategy&
Saved
Presents column chart to depict asset management growth, alongside textual annotations. The design is straightforward, utilizing different shades of blue to distinguish between categories.
Investment Analysis
Financial Services
Shows asset under management movement, useful for investment analysis and understanding the impact of various financial factors such as foreign exchange and market movements on asset management.
Asset Management, Investment Growth, MAM, MIRA, Financial Impact
Single Chart
Goldman Sachs
Saved
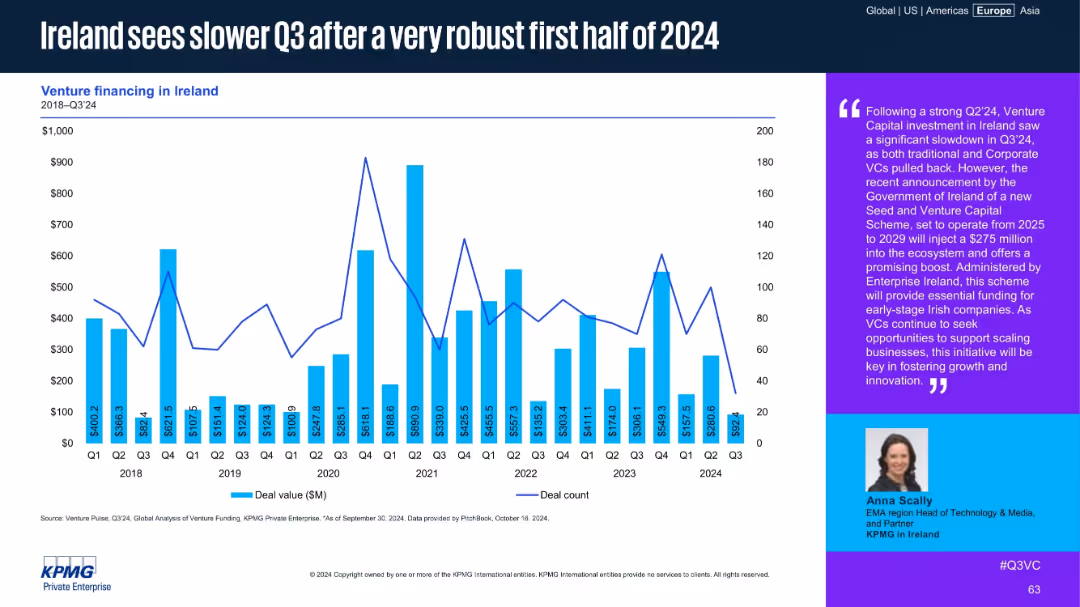
Bar and line chart of Irish venture financing from 2018 to Q3 2024, with a large text box commentary on the right. Highlights major ups and downs, with emphasis on Q2 and Q3 2024.
Market Analysis and Trends
Financial Services
After a strong first half in 2024, Ireland's VC market declined in Q3. Commentary discusses VC pullback and a new government scheme injecting $275M between 2025-2029 to support early-stage startups through Enterprise Ireland.
Ireland, venture capital, Q3 2024, government funding, Enterprise Ireland, early-stage, capital slowdown, investment trends
Mixed Chart
KPMG
Saved
Diagram of three interlocking circles labeled as 'The Orange World', 'The Green World', and 'The Blue World', with adjacent text descriptions.
Industry Overview
Professional Services
Showcasing three possible future scenarios of work culture: 'The Orange World' focusing on flexibility, 'The Green World' on social responsibility, and 'The Blue World' on big corporation dominance. Suited for discussions on corporate culture.
work culture, future scenarios, social responsibility, corporate dominance, flexibility, collectivism, individualism
Framework
PwC/Strategy&
Saved
Three circular diagrams, percentage figures, green theme
Technology and Digital Transformation
Technology & Software
Discusses readiness and impact of technology in business
Technology, readiness, business impact
Multiple Chart
Deloitte
Saved
Bar chart presenting future plans of refugees regarding their stay in Poland.
Strategic Planning
Government & Public Sector
Analyzes the future intentions of refugees in Poland based on survey data.
refugees, future plans, Poland, survey data
Single Chart
Deloitte
Saved
Previous
Next
If nothing, comes up, please save your slides first
Create a FREE account to continue browsing
Receive Instant Access to 1,000+ slides from companies like McKinsey, Google, and Goldman Sachs
First Name
Last Name
Email
Password
I agree to all
Terms & Privacy Policy
Thank you! Your submission has been received!
Oops! Something went wrong while submitting the form.
Have an account?
Sign in
Column Chart
Heatmap
Chevron
Org Chart
Infographic
Callouts
Timeline
List
Graphic
Picture
Process Flow
Diagram
Paragraph
Map
Table
Framework
Subtitle
Takeaway Box
Icon
Other Chart
Radar Chart
Waterfall Chart
Mekko Chart
Pie Chart
Scatter Plot
Line Chart
Bar chart
Bullet points