My Account
My Slides
Search by Category
Templates
Leave Feedback
Login
Logout
Get Started
Browse all Slides
Browse all Slides
Create a FREE Account
Instant access to 1,000+ real slides from top companies like McKinsey, BCG, Goldman Sachs, Google and many more!
First Name
Last Name
Email
Password
I agree to all
Terms & Privacy Policy
Thank you! Your submission has been received!
Oops! Something went wrong while submitting the form.
Have an account?
Sign in
Saved Slides
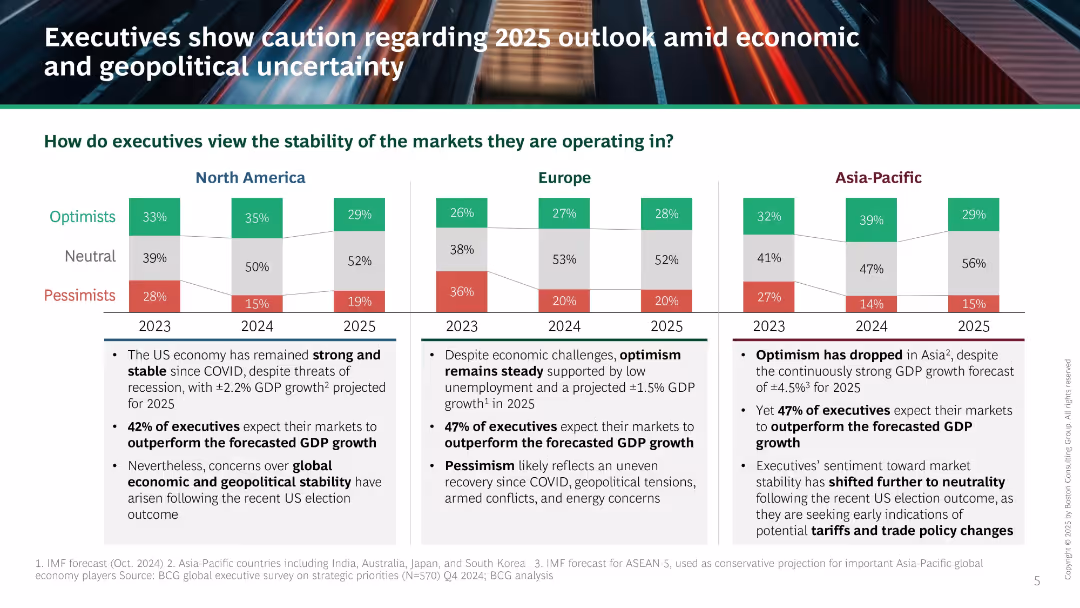
Comparative bar chart across three regions (NA, Europe, APAC) with Optimists/Neutral/Pessimists segments; bullet points underneath each chart; black headline area.
Market Analysis and Trends
Professional Services
The slide summarizes executive sentiment about market stability in 2025, highlighting regional variations in optimism and pessimism. Key points include projected GDP, geopolitical concerns, and shifts toward neutrality due to global uncertainties and recent election outcomes.
market outlook, executive sentiment, geopolitical risk, GDP forecast, economic stability, 2025
Mixed Chart
BCG
Saved
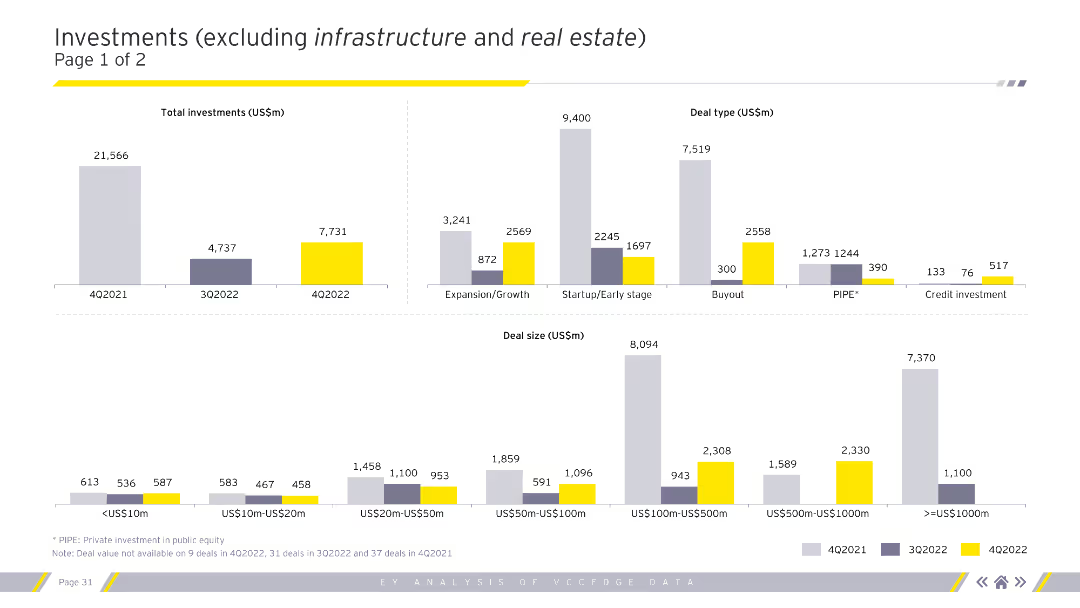
The slide features multiple column charts displaying total investments, deal types, and deal sizes for various quarters. The charts are color-coded to represent different time periods.
Market Analysis and Trends
Financial Services
This slide focuses on investments excluding infrastructure and real estate, showing detailed breakdowns by deal type and size, aiding in understanding specific investment trends.
Investments, deal types, deal sizes, quarterly data
Multiple Chart
EY
Saved
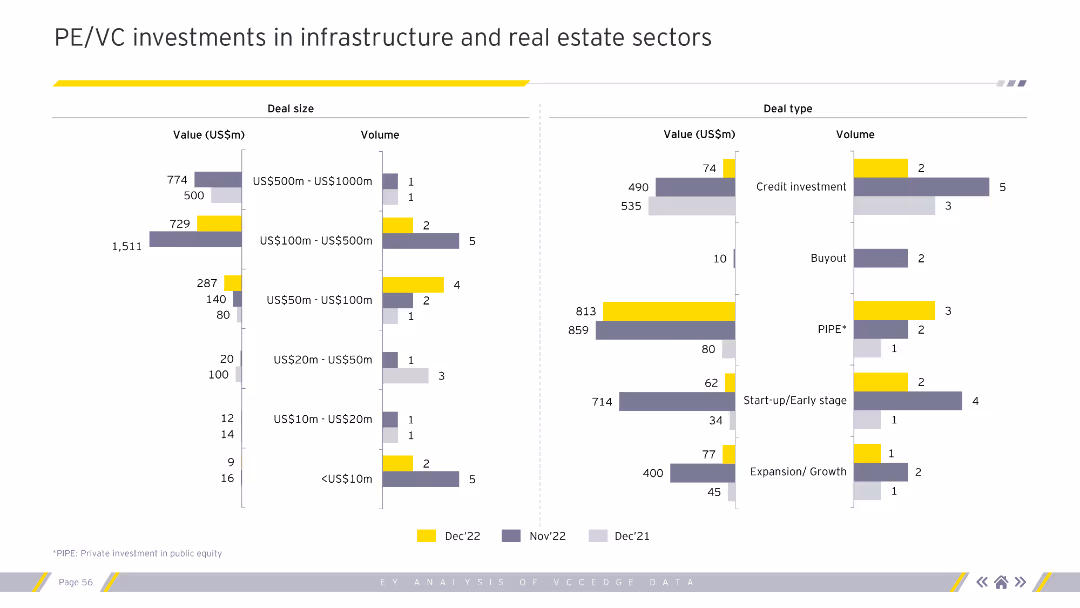
The slide features two bar charts. The left bar chart shows deal sizes by value and volume. The right bar chart shows deal types by value and volume.
Investment Analysis
Real Estate & Construction
This slide compares the PE/VC investments in infrastructure and real estate sectors based on deal size and type.
PE, VC, infrastructure, real estate, investments, deal size, deal type, volume, value
Multiple Chart
EY
Saved
Horizontal bar chart ranked by country; “Likely” vs “Unlikely” opinions; placeholder [COUNTRY] in title
Regulatory and Compliance
Government & Public Sector
This slide surveys global expectations for bans on under-14 social media use. India and Malaysia show highest belief in such regulation; global average is 28%.
social media, regulation, youth, child safety, digital access, parental control, policy, internet usage, Ipsos
Mixed Chart
IPSOS
Saved
The slide includes two column charts: one comparing EV sales in key markets (China and USA) from December 21 to December 22, and the other showing YTD EV sales growth from December 21 to December 22.
Market Analysis and Trends
Transportation & Logistics
This slide illustrates the growth in EV sales in key markets, showing a 40% increase in December 2022 compared to December 2021, and a 47% increase in year-to-date EV sales, emphasizing the upward trend in EV adoption.
EV sales, growth, China, USA, market trends, YTD
Multiple Chart
PwC/Strategy&
Saved
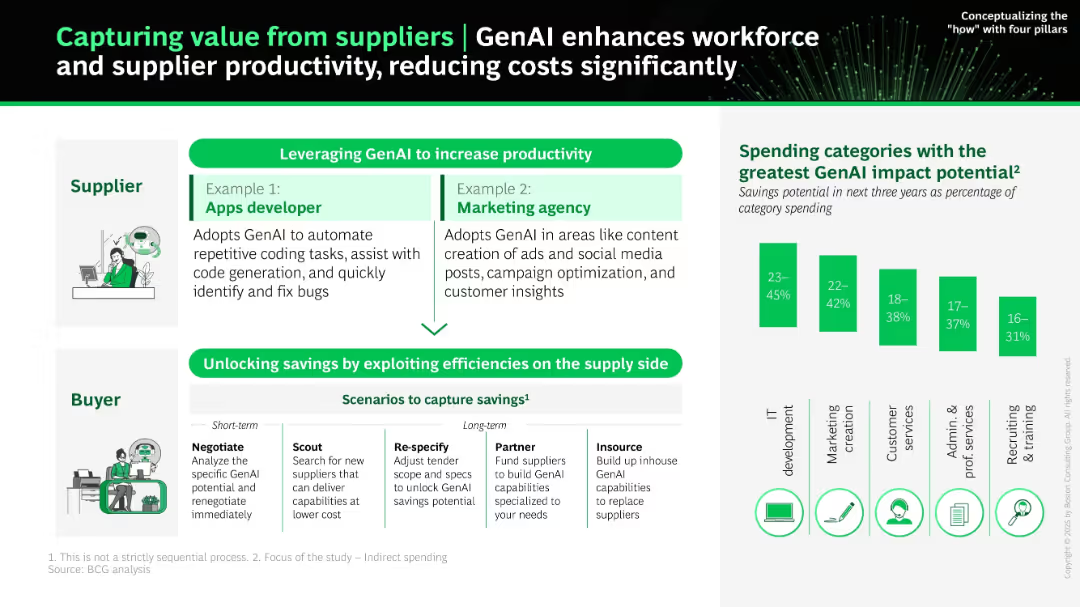
Divided into supplier and buyer sections, showing use case examples. Includes bar chart showing categories with highest GenAI impact. Green color highlights impact zones.
Strategic Planning
Technology & Software
Demonstrates how GenAI boosts productivity for suppliers (e.g., devs, marketers) and enables buyers to reduce costs via strategic steps (e.g., renegotiation, insourcing). The right-side bar chart shows where GenAI savings are highest, focusing on indirect spend.
supplier productivity, savings, GenAI, marketing, app development, indirect spend, buyer strategy
Mixed Chart
BCG
Saved
Two donut charts showing the distribution of podcast campaign types by revenue in 2015 and 2016, with a shift towards brand awareness and the emergence of branded content.
Market Analysis and Trends
Media & Entertainment
Discusses the evolution of revenue-generating campaign types in podcasting, highlighting shifts towards brand awareness and branded content. Key for strategic discussions on content and advertising models in media.
podcast, campaign types, revenue, media
Multiple Chart
PwC/Strategy&
Saved
Graphical elements and text boxes detail the loyalty program structures and impacts on a Japanese e-commerce and media company's market growth.
Customer and Market Segmentation
Retail & E-commerce
This slide showcases the success of a loyalty program in retaining market leadership and expanding market share, highlighting the incentives and rewards that encourage repeat customer engagement in a Japanese e-commerce context.
Loyalty programs, e-commerce, Japan, market growth
Framework
BCG
Saved
Text, percentage circles, and horizontal bar chart illustrating employee empowerment and primary reasons for job changes, such as pay and career growth.
Human Resources and Talent Management
Professional Services
This slide discusses employee expectations in a tight labor market, focusing on empowerment, likelihood of leaving, and primary reasons for considering new job offers, including pay and career advancement.
Employee expectations, empowerment, job change reasons, pay, career growth, labor market
Mixed Chart
EY
Saved
Text and stacked column charts detailing fee preferences among different age groups of investors
Technology and Digital Transformation
Financial Services
Discusses fee preferences among young and older investors, focusing on performance-based fees and the shift in pricing structures.
investor fees, performance-based, age differences, financial services
Mixed Chart
Deloitte
Saved
Line graphs showing app usage over time, bar charts showing daily mobile time usage per app
Market Analysis and Trends
Technology & Software
Examines luxury consumers' app usage patterns, highlighting preferred platforms
Luxury, Consumer Behavior, Apps, Usage Patterns
Multiple Chart
BCG
Saved
This slide has bullet points, growth metrics, and a mix of traditional and alternative assets bar graphs.
Financial Performance
Financial Services
Highlights the decade-long growth of JPMorgan's Asset & Wealth Management and Private Bank sectors, emphasizing its market-leading position with data comparisons and client asset flows in a visually dense layout.
market-leading, growth, JPMorgan, asset management, private bank
Multiple Chart
JP Morgan
Saved
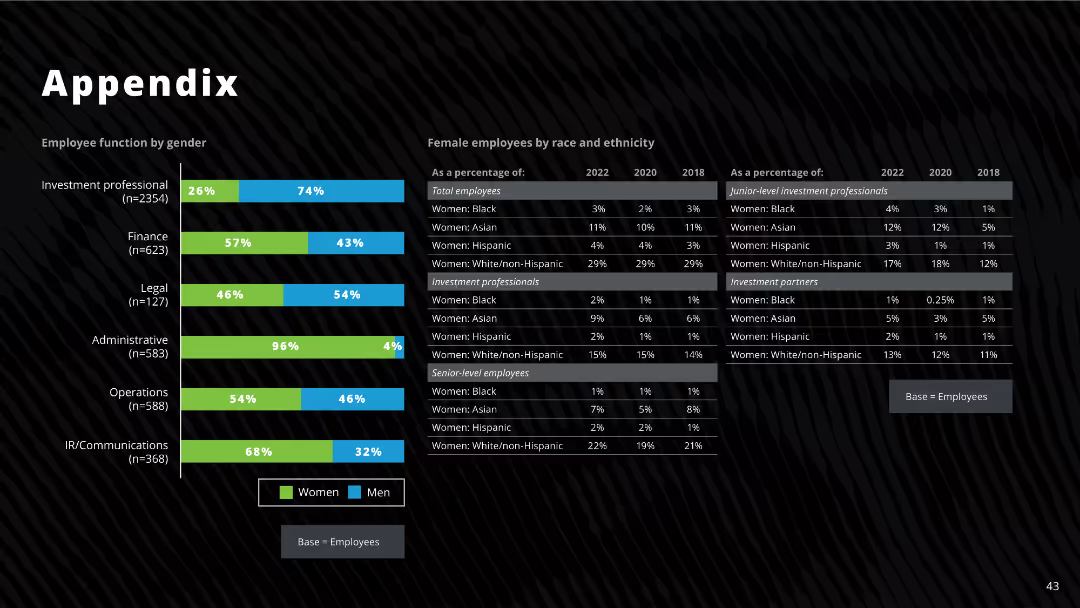
The slide features bar charts and tables showing employee function by gender, race, and ethnicity, including detailed percentages for different categories from 2018, 2020, and 2022.
Human Resources and Talent Management
Professional Services
The slide provides detailed demographic data on employees by function, gender, race, and ethnicity, highlighting changes over time.
employee demographics, gender, race, ethnicity, investment professionals, diversity
Mixed Chart
Deloitte
Saved
Includes text boxes and icons emphasizing the strategic benefits of cell manufacturing in Australia.
Market Analysis and Trends
Energy & Utilities
Advocates for prioritizing cell manufacturing in Australia due to its strategic importance to the battery value chain.
cell manufacturing, strategic importance, Australia, battery industry
Pillar
Accenture
Saved
Contains four numbered sections, each describing a different strategy for overcoming AI deployment challenges, presented in a clear and structured manner. The use of icons and minimal text helps emphasize the strategies effectively.
Technology and Digital Transformation
Technology & Software
Offers strategies for optimizing AI deployment, including investing in culture and leadership, transforming operations, and orchestrating tech and talent. This slide is ideal for strategic planning sessions in technology sectors.
AI deployment, strategies, culture investment, operations transformation, tech orchestration, strategic planning
Linear Flow
Deloitte
Saved
The slide includes a header, a background image, and two main sections: a text block on the left and a column chart on the right. The column chart compares the perceived usefulness of various wellness wearable features from 2018 and 2021, with a focus on features like activity tracking and heart rate monitoring.
Product and Service Analysis
Healthcare & Pharmaceuticals
Discusses the evolution and adoption of wellness wearables, highlighting their increasing functionality and the balance between data privacy and usefulness. The column chart illustrates changes in the perceived usefulness of wellness wearables over time, focusing on features such as activity tracking and heart rate monitoring.
Wellness, wearables, activity tracking, heart rate, survey
Mixed Chart
IPSOS
Saved
A pipeline diagram illustrating a working capital improvement approach with phases: Quick scan, Diagnostic, Design, and Implementation, accompanied by lists of specific actions and outcomes.
Operational Efficiency
Financial Services
The slide explains PwC's approach to improving working capital, detailing steps and examples in accounts receivable, inventory, and accounts payable.
Working capital, Quick scan, Diagnostic, Design, Implementation, Accounts receivable, Inventory, Accounts payable, Outcomes, Efficiency
Header Vertical
PwC/Strategy&
Saved
Features a vertical three-step list labeled from 1 to 3 with corresponding icons and short descriptions, all color-coded in shades of green and blue.
Strategic Planning
Professional Services
Describes the three crucial strategies for successful business integration, focusing on continuity, delivery of synergies, and transformation beyond the deal.
success, planning, business, integration, continuity, synergies, transformation
Vertical Flow
Deloitte
Saved
Slide contains three column charts analyzing generation cost, electrolyzer utilization, and transmission for optimizing green hydrogen production in Chile.
Market Analysis and Trends
Energy & Utilities
Analyzes three cost factors essential for optimizing green hydrogen production in Chile, focusing on generation location, technology, and transmission costs.
Chile, green hydrogen, cost optimization, generation, transmission, electrolyzer
Pillar
McKinsey
Saved
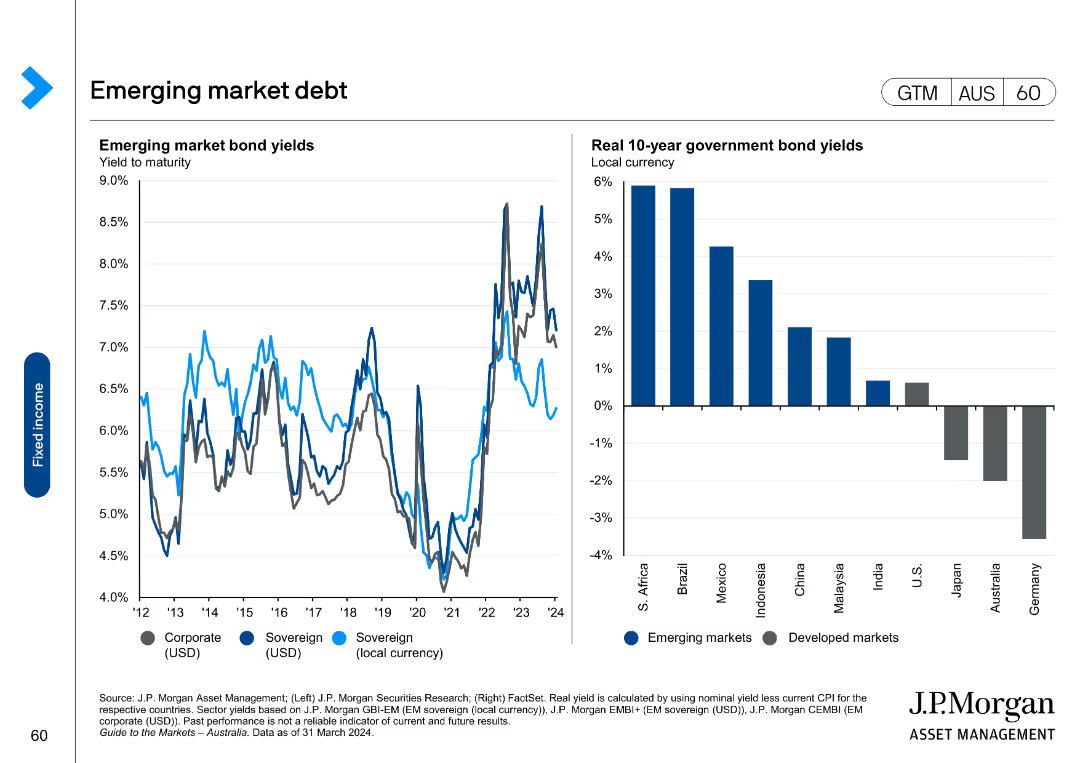
The slide includes two charts: a line chart on the left showing emerging market bond yields, and a column chart on the right showing real 10-year government bond yields.
Market Analysis and Trends
Financial Services
It provides data on emerging market debt, including yields and real government bond yields, useful for understanding investment opportunities in emerging markets.
emerging market, debt, bond yields, government, real yield
Multiple Chart
JP Morgan
Saved
Bar chart showing recent average Z-spread and change relative to average for various sectors with commentary on the right.
Risk Assessment and Management
Financial Services
Highlights the perceived credit risk in the financial, real estate, and energy sectors due to recent US bank failures.
Bond spreads, financial sectors, risk, credit, US
Mixed Chart
Accenture
Saved
The slide presents a bar chart with arrows indicating percentage changes, focusing on practices like dedicating time to change management. It uses purple tones to differentiate total enterprise reinventors from transformers and optimizers.
Strategic Planning
Professional Services
Discusses the significance of communication in organizational change, focusing on the allocation of time, leadership communication, and skilling for effective delivery. The slide is a tool for analyzing the human aspects of organizational transformation and change management.
Change Management, Organizational Change, Leadership Communication, Skilling, Reinvention, Human Factors, Engagement Practices, Delivery Strategies
Multiple Chart
Accenture
Saved
Comprises column charts representing the percentage of respondents considering EVs before and during COVID-19.
Market Analysis and Trends
Transportation & Logistics
Discusses the stability of consumer interest in electric vehicles despite the disruptions caused by the pandemic.
electric vehicles, consumer preference, market stability, global trends
Multiple Chart
McKinsey
Saved
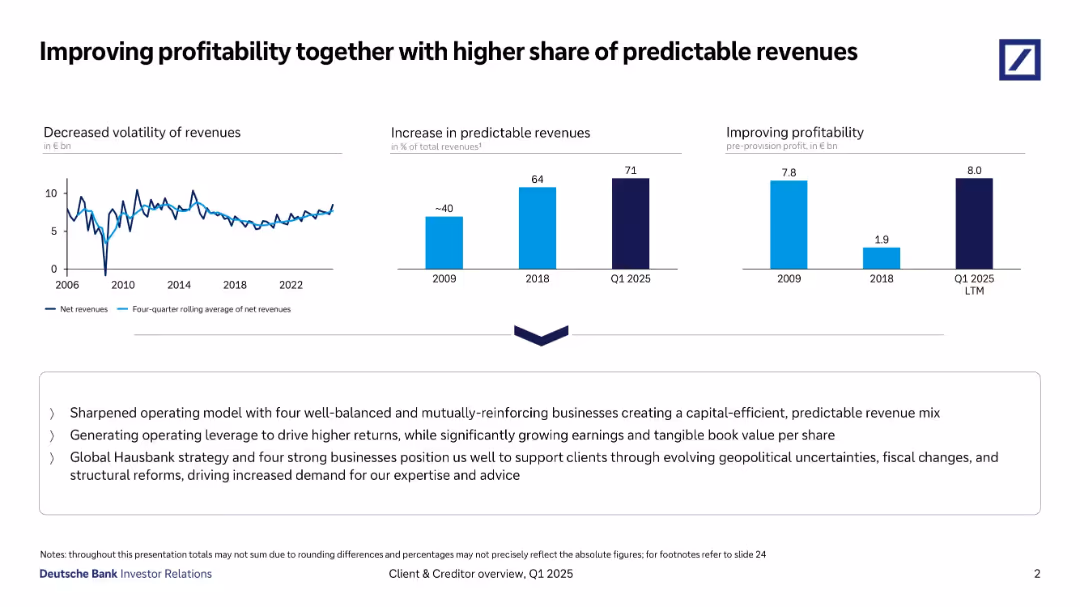
Three-panel horizontal layout showing revenue trends, predictable revenue growth, and profitability, with a strategic summary below.
Strategic Planning
Financial Services
Emphasizes reduced revenue volatility, increased share of predictable revenues (71% by Q1 2025), and strong pre-provision profitability. Highlights strategy with operational leverage, Hausbank positioning, and geopolitical risk management.
Profitability, Predictable Revenues, Strategy, Net Revenues, Hausbank
Multiple Chart
Deutsche Bank
Saved
This slide features a complex table correlating SDG goals with business metrics like new markets, sustainable operations, and risk management, indicating areas of high and low potential for value creation with color shading.
Strategic Planning
Professional Services
Discusses how businesses perceive the potential for value creation through responsible consumption and production, decent work, and partnerships, according to SDGs, focusing on sectors with significant operational and strategic impacts.
SDGs, value creation, business strategy, operational efficiency
Table
McKinsey
Saved
Previous
Next
If nothing, comes up, please save your slides first
Create a FREE account to continue browsing
Receive Instant Access to 1,000+ slides from companies like McKinsey, Google, and Goldman Sachs
First Name
Last Name
Email
Password
I agree to all
Terms & Privacy Policy
Thank you! Your submission has been received!
Oops! Something went wrong while submitting the form.
Have an account?
Sign in
Column Chart
Heatmap
Chevron
Org Chart
Infographic
Callouts
Timeline
List
Graphic
Picture
Process Flow
Diagram
Paragraph
Map
Table
Framework
Subtitle
Takeaway Box
Icon
Other Chart
Radar Chart
Waterfall Chart
Mekko Chart
Pie Chart
Scatter Plot
Line Chart
Bar chart
Bullet points


![Children under 14 in [COUNTRY] will be banned from using social media](https://cdn.prod.website-files.com/654e70fb59937215cac87b19/6899b95ee44404f6f3c16dbd_qROGhk2ldmPp3HP2t1lKIRGByOAa2DXOUUaKEJG1Brc.avif)