My Account
My Slides
Search by Category
Templates
Leave Feedback
Login
Logout
Get Started
Browse all Slides
Browse all Slides
Create a FREE Account
Instant access to 1,000+ real slides from top companies like McKinsey, BCG, Goldman Sachs, Google and many more!
First Name
Last Name
Email
Password
I agree to all
Terms & Privacy Policy
Thank you! Your submission has been received!
Oops! Something went wrong while submitting the form.
Have an account?
Sign in
Saved Slides
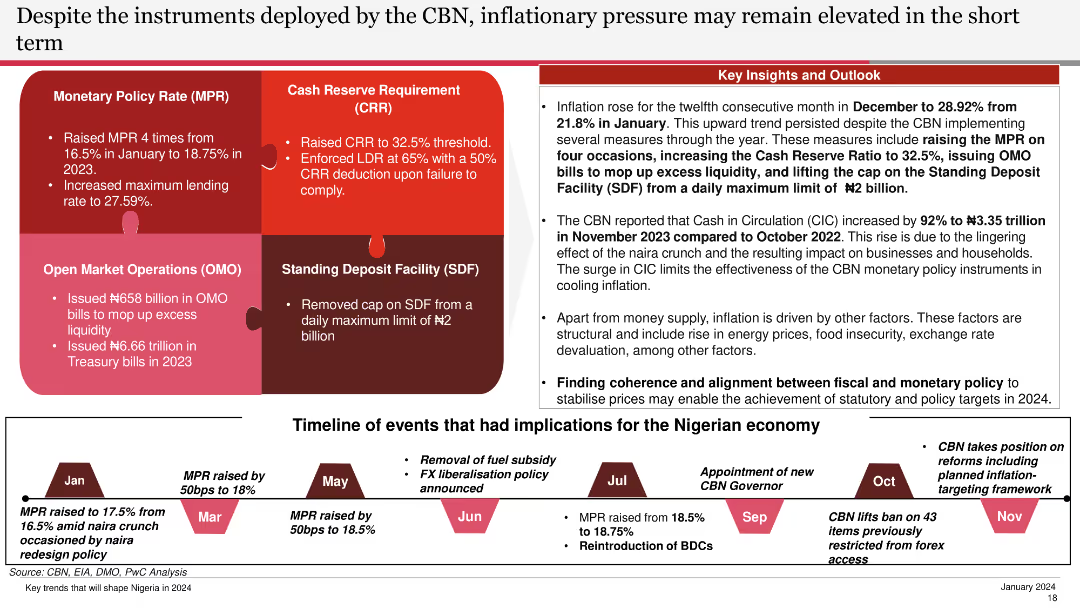
The slide includes text blocks and a timeline of monetary policy events. It is moderately complex, with clear use of color coding and annotations to highlight key measures.
Regulatory and Compliance
Financial Services
This slide details the monetary policy instruments used by the CBN to control inflation, providing a timeline of key events and their impact on the Nigerian economy in the short term.
CBN, Inflation, Policy, Instruments, Timeline
Linear Flow
PwC/Strategy&
Saved
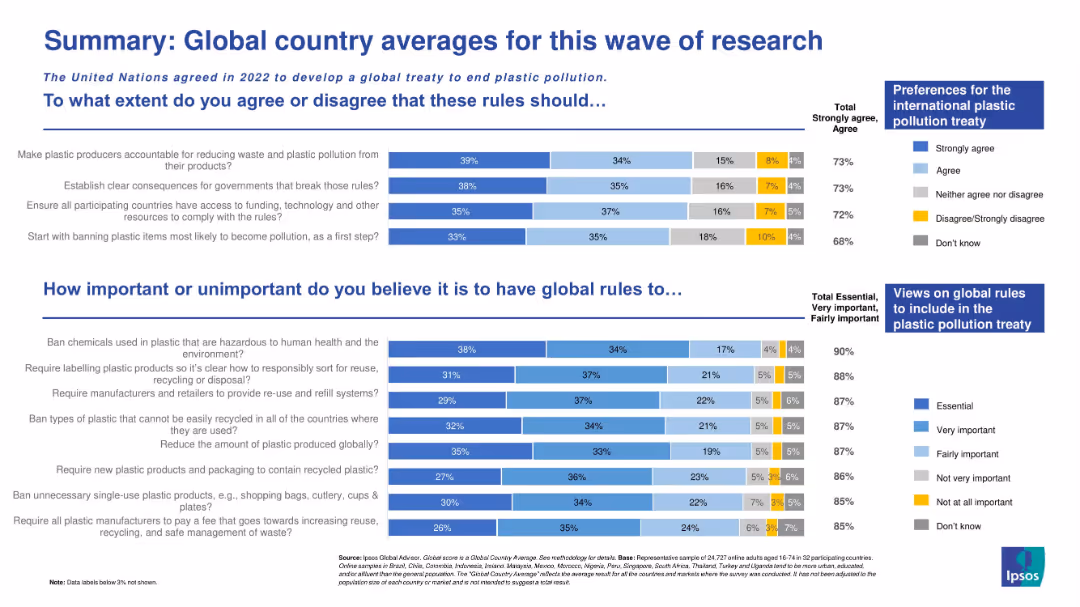
Two-section layout with horizontal bar charts: one for agreement on treaty rules and another for rule importance. Clear color-coded response categories.
Regulatory and Compliance
Environmental Services & Sustainability
This slide shows global sentiment toward proposed plastic pollution treaty rules, detailing both agreement levels and perceived importance of actions such as banning hazardous chemicals and labeling plastic products.
treaty support, global survey, plastic regulation, importance ratings, Ipsos data, environmental policy, waste reduction, consumer perspectives
Multiple Chart
IPSOS
Saved
Gradient pink-purple background with white text; icons and labeled segments describing drivers; bottom section outlines research methodology
Strategic Planning
Financial Services
Identifies four main drivers of customer advocacy—Reassure me, Remember me, Delight me, Reward me—based on global banking study findings. Describes methodology used (49,300 surveyed, 194 variables analyzed) to derive 21 significant variables into 4 key groups.
Pillar
Accenture
Saved
Column charts and text comparison of market capitalization changes in different regions, highlighting Europe's growth against other regions. Each region's performance is detailed with supporting data.
Market Analysis and Trends
Financial Services
Focuses on regional economic performance, particularly Europe's market dynamics, useful for understanding shifts in global market capitalization.
market capitalization, regional analysis, economic growth
Mixed Chart
PwC/Strategy&
Saved
The slide features a column chart showing global M&A volume by deal type from 2017 to 2023, and a line chart depicting S&P 500 cash/assets from 2007 to Q3 2023. The layout is moderately complex with well-structured visual elements.
Financial Performance
Financial Services
The slide analyzes the trend in global M&A volumes and the cash position of corporates over time, highlighting their financial resilience and strategic positioning.
M&A, cash position, S&P 500, financial trend
Multiple Chart
JP Morgan
Saved
This slide includes a line chart illustrating ECB forecasts for core inflation versus actual outturns. The red line represents the forecast, while the multi-colored bars indicate different years' actual outturns. The slide includes a textual source reference.
Market Analysis and Trends
Financial Services
This slide shows the European Central Bank's core inflation forecasts in comparison to the actual figures, emphasizing the difference between projected and real outcomes. It is suitable for discussions on economic forecasting accuracy, policy decision-making, and the challenges of predicting inflation trends.
ECB, Inflation Forecasts, Economic Predictions, Core Inflation, EU, Bar Chart, Forecast Accuracy
Single Chart
JP Morgan
Saved
Slide with a timeline graph, text, and color-coded phases representing pandemic response strategies.
Market Analysis and Trends
Government & Public Sector
Analyzes strategies for dealing with COVID-19's impact over time, including flattening the curve and economic recovery.
Pandemic Recovery, COVID-19, Flatten, Fight, Future, Economic Impact, Government Policy
Linear Flow
BCG
Saved
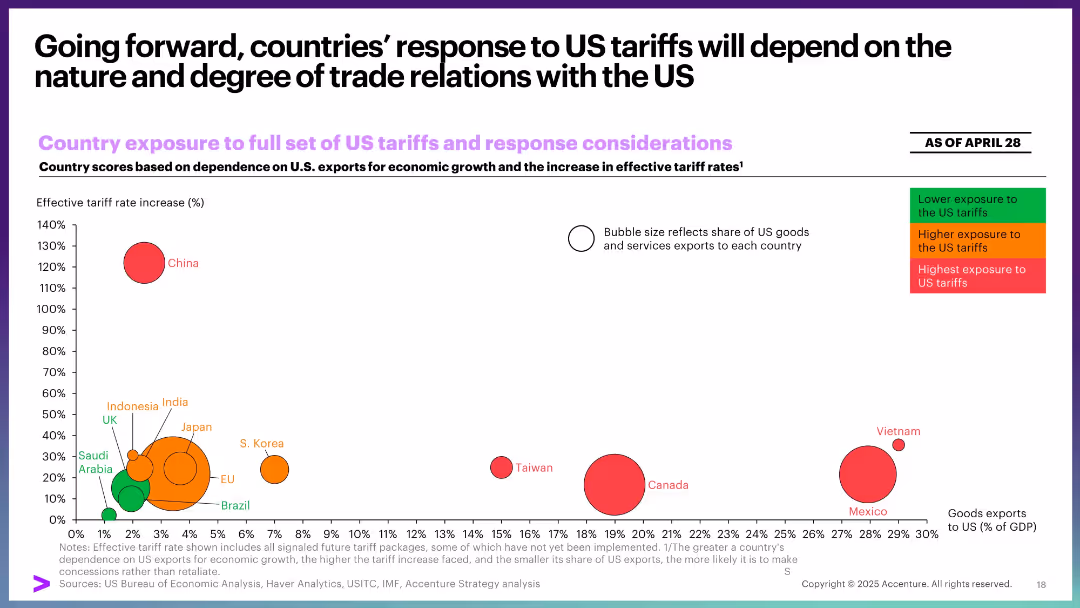
Bubble chart with x-axis for export dependence, y-axis for effective tariff increase, and color-coded exposure risk.
Strategic Planning
Government & Public Sector
This slide visualizes country-specific vulnerability to US tariffs, balancing tariff impact against export reliance. It highlights countries at highest risk (e.g., China, Vietnam) and those more insulated (e.g., Saudi Arabia, Brazil).
tariff exposure, exports, trade relations, country impact, bubble chart, dependence, economic risk
Single Chart
Accenture
Saved
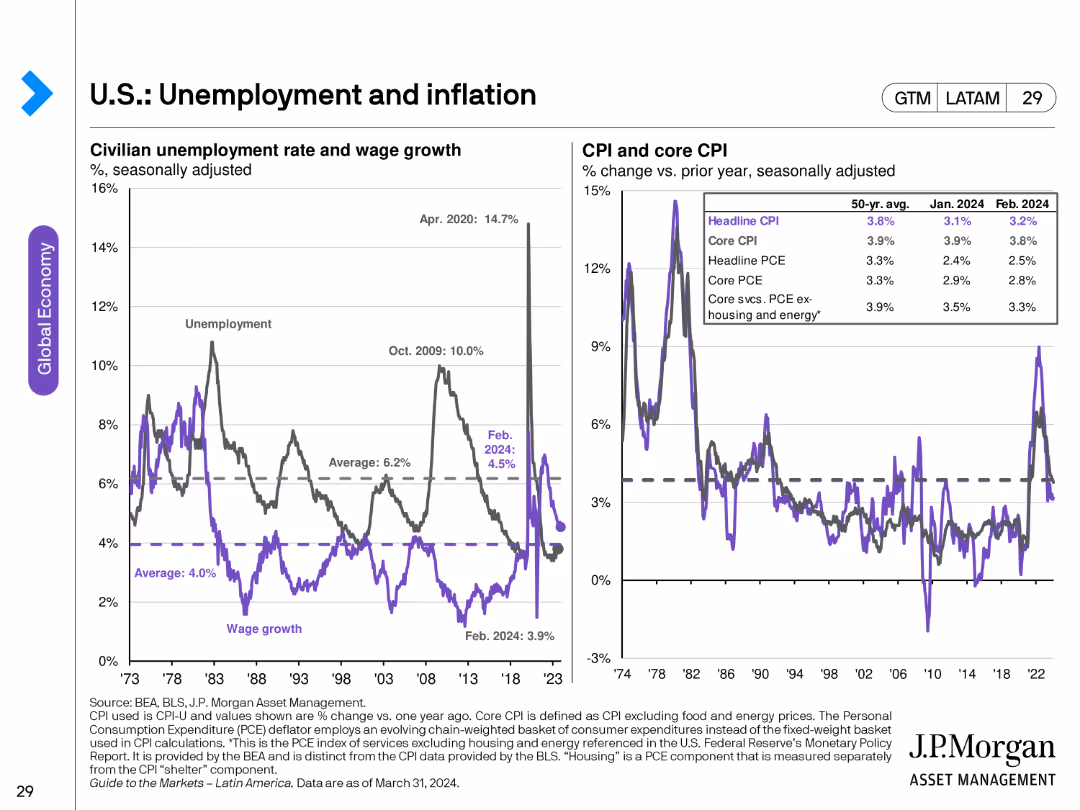
The slide features two line charts: one showing civilian unemployment rate and wage growth, and another displaying CPI and core CPI changes over time.
Market Analysis and Trends
Financial Services
This slide provides a detailed analysis of unemployment and inflation rates in the U.S., illustrating trends in wage growth and consumer price indices.
unemployment, inflation, wage growth, CPI, core CPI, economic trends
Multiple Chart
JP Morgan
Saved
The slide features a mix of a large image on the left and column charts on the right. The charts show percentages of compliance budget allocations and anticipated changes over the next two years.
Regulatory and Compliance
Financial Services
The slide discusses the increased compliance budgets for hedge funds due to regulatory requirements, with detailed statistics on current budget allocations and future expectations.
compliance, regulatory, hedge funds, budget, chart
Multiple Chart
EY
Saved
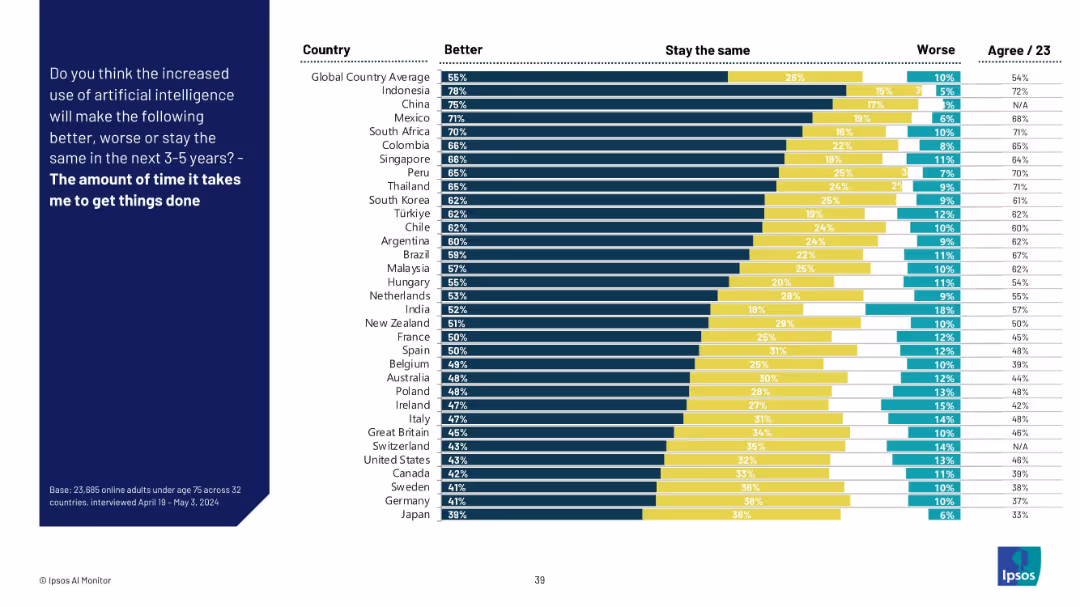
Bar chart format with country comparisons, dark blue side panel for the question.
Performance Metrics and KPIs
Technology & Software
This slide evaluates how AI is perceived to affect personal productivity in the near future. A majority across countries believe it will reduce the time needed to get tasks done. Indonesia, China, and Mexico rank highest in positive sentiment.
productivity, AI efficiency, time management, survey, global insights, AI tools, task automation, Ipsos data, personal impact
Mixed Chart
IPSOS
Saved
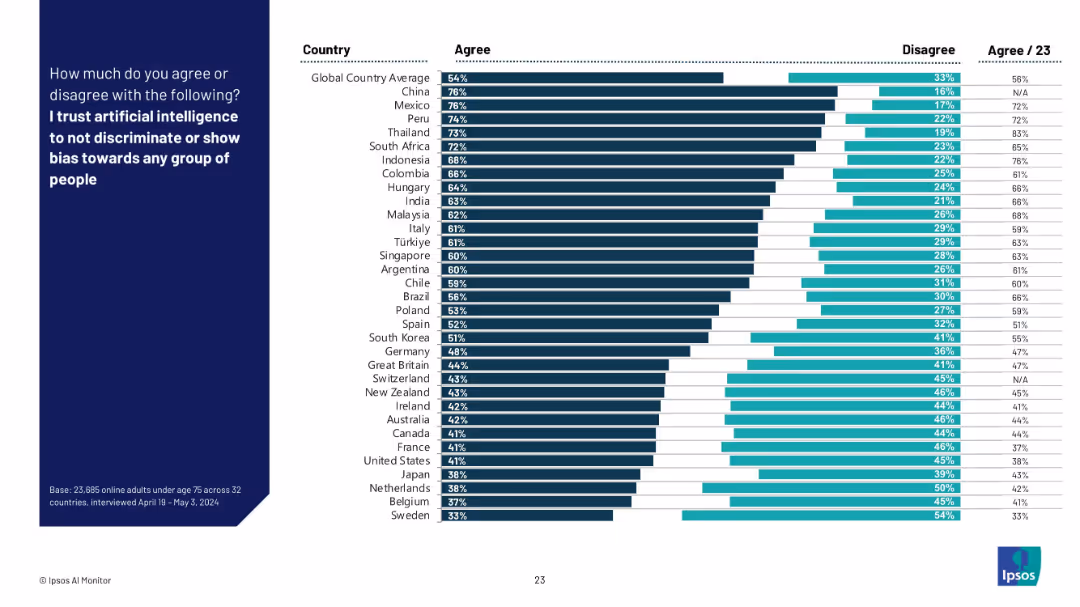
Bar chart by country with % agree and disagree; countries sorted by trust in AI to be unbiased.
Regulatory and Compliance
Artificial Intelligence
This slide presents how much respondents across countries trust AI systems to avoid discrimination or bias. It highlights global perceptions of fairness in AI and potential ethical concerns.
AI bias, fairness, discrimination, trust in AI, ethics, global comparison, Ipsos, regulation, responsible AI
Mixed Chart
IPSOS
Saved
Slide with three column charts and related imagery reflecting strategies for different customer segments like Youth and Families, Low-to-Moderate Income, and Affluent.
Customer and Market Segmentation
Financial Services
Targeted at showing tailored approaches for diverse customer segments, focusing on specific banking products and services offered.
segmentation, value proposition, banking, customers, services, youth, income, affluent, strategy, products
Multiple Chart
JP Morgan
Saved
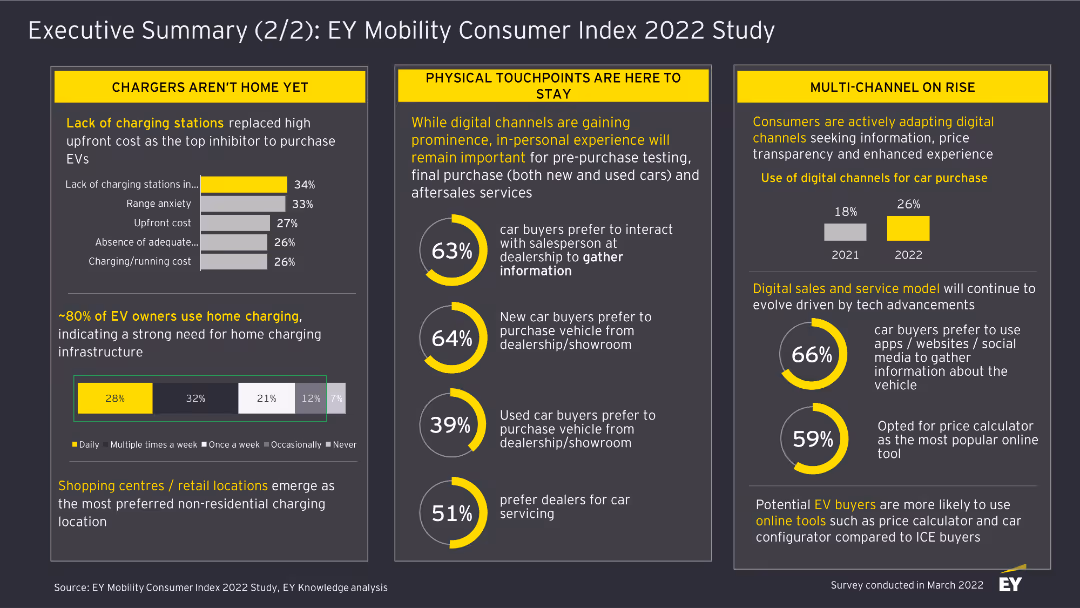
This slide includes column charts and textual highlights. It discusses the challenges in EV adoption, the importance of physical touchpoints, and the rise of digital channels for car purchases.
Market Analysis and Trends
Transportation & Logistics
The slide summarizes findings from the EY Mobility Consumer Index 2022 Study, focusing on barriers to EV adoption, the role of physical touchpoints, and the increasing use of digital channels in car buying.
EV Adoption, Physical Touchpoints, Digital Channels, Car Buying, Transportation, Market Analysis, 2022, Survey, Consumer Trends
Multiple Chart
EY
Saved
Lists advantages of smart contracts such as security and cost savings, presented through a combination of icons and bullet points which simplify complex information into easily digestible segments.
Technology and Digital Transformation
Technology & Software
Details the benefits of using smart contracts in blockchain technology, emphasizing aspects like speed, accuracy, and cost efficiency. Useful for discussions on improving business processes through technology.
smart contracts, advantages, security, efficiency, cost savings
Boxed
McKinsey
Saved
The slide features multiple line charts displaying price trends of steel HRC, scrap, iron ore, and met coal from Q1 2020 to October 2022, accompanied by key challenge notes on the side.
Risk Assessment and Management
Industrial & Manufacturing
This slide discusses the volatility in the global steel supply chain in 2022, highlighting supply chain disruptions, demand disruptions, and inflation impacts through various price charts.
Steel supply chain, volatility, price trends, disruptions, demand, inflation, global, 2022, charts, risks
Single Chart
BCG
Saved
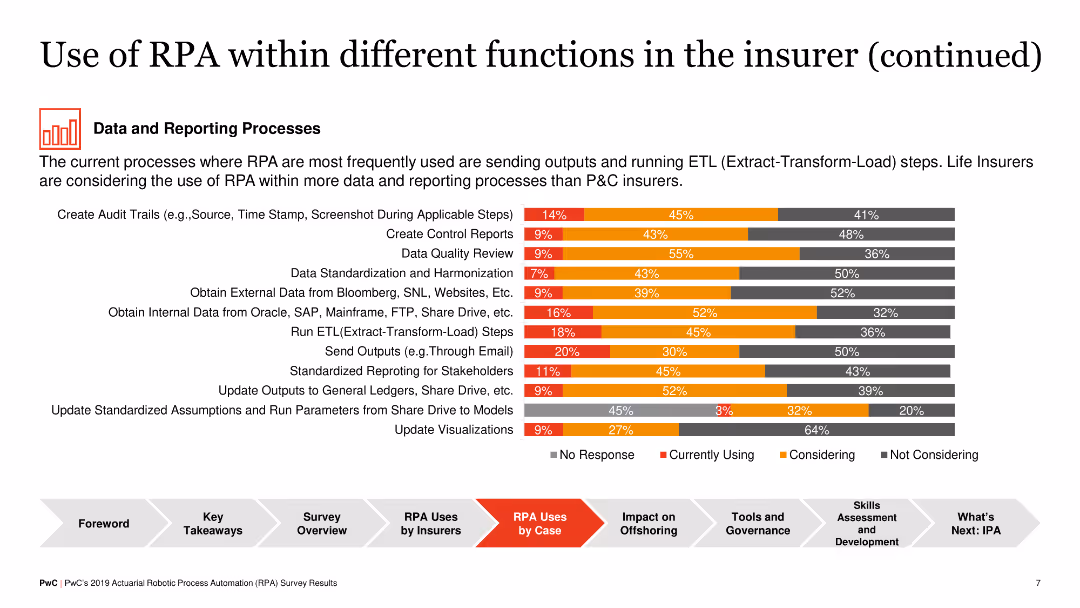
A detailed horizontal bar chart showing various processes within Data and Reporting, highlighting levels of RPA adoption (No Response, Currently Using, Considering, Not Considering).
Operational Efficiency
Financial Services
The slide showcases RPA usage in data and reporting processes within insurance, identifying which steps are most automated. Life insurers use RPA for ETL processes more than P&C insurers, highlighting areas like audit trails, data harmonization, and visual updates.
RPA, Data Reporting, Insurance, ETL, Automation
Single Chart
PwC/Strategy&
Saved
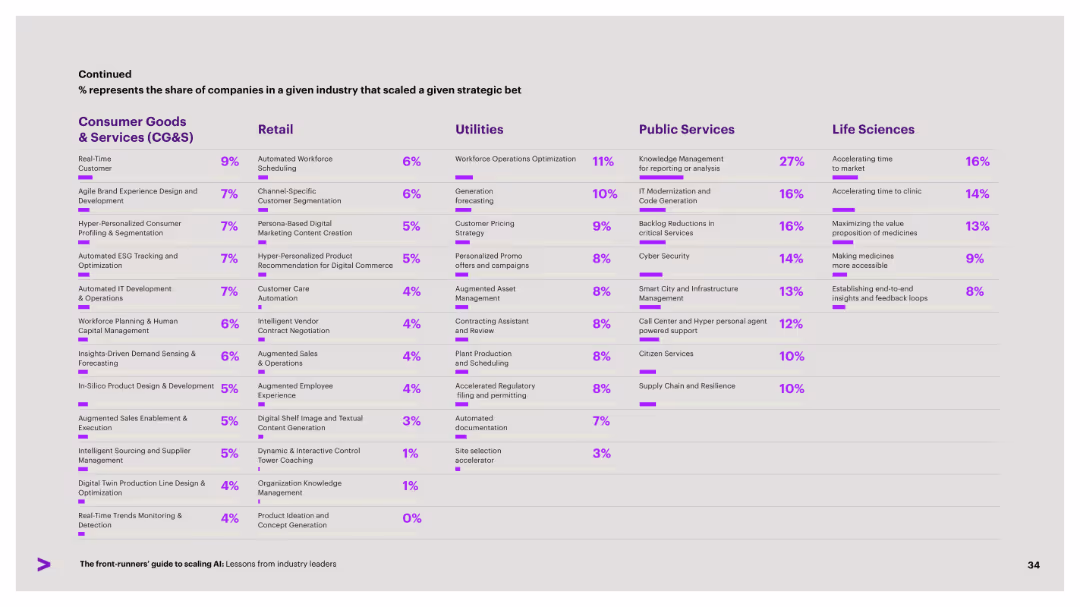
Continuation of previous slide in same layout, showing strategic AI bets by industry. Purple % bars illustrate adoption.
Strategic Planning
Artificial Intelligence
A continuation of strategic AI initiatives by industry, covering sectors like CG&S, Retail, Utilities, Public Services, and Life Sciences. The slide emphasizes the percentage of companies scaling each initiative.
industry scaling, AI strategy, CG&S, Life Sciences, digital innovation
Single Chart
Accenture
Saved
The slide contains three key strategy blocks with associated actions, displayed in a columnar format. The content is supported by performance metrics, depicted in a clear and structured manner.
Strategic Planning
Financial Services
Outlining strategies for sustained business success, the slide discusses expanding the card member base, engaging through experiences, and creating deeper customer relationships, accompanied by goals and performance indicators.
Business Strategy, Card Members, Customer Engagement, Relationship Building, Performance Metrics
Table
JP Morgan
Saved
Displays a comparison of H2 vessel types by application and geography for 2023 and 2030, highlighting the expected dominance of Type IV vessels.
Technology and Digital Transformation
Energy & Utilities
Discusses the anticipated dominance of Type IV H2 vessels by 2030, focusing on their application in mobility and infrastructure and various pressure levels.
Type IV vessels, H2 storage, dominance, application, geography, mobility, infrastructure, pressure levels, 2030
Table
Roland Berger
Saved
The slide has two column charts. The left chart shows U.S. online retail sales by segment as a percentage of total retail sales for 2Q18 and 1Q24. The right chart details the change in the number of physical retail establishments from 2Q13 to 3Q23.
Market Analysis and Trends
Real Estate & Construction
This slide analyzes U.S. online retail sales by segment and tracks changes in the number of physical retail establishments over time. It provides insights into the shifting landscape of retail and e-commerce trends.
online retail, sales segments, physical retail, e-commerce, market trends, retail analysis
Multiple Chart
JP Morgan
Saved
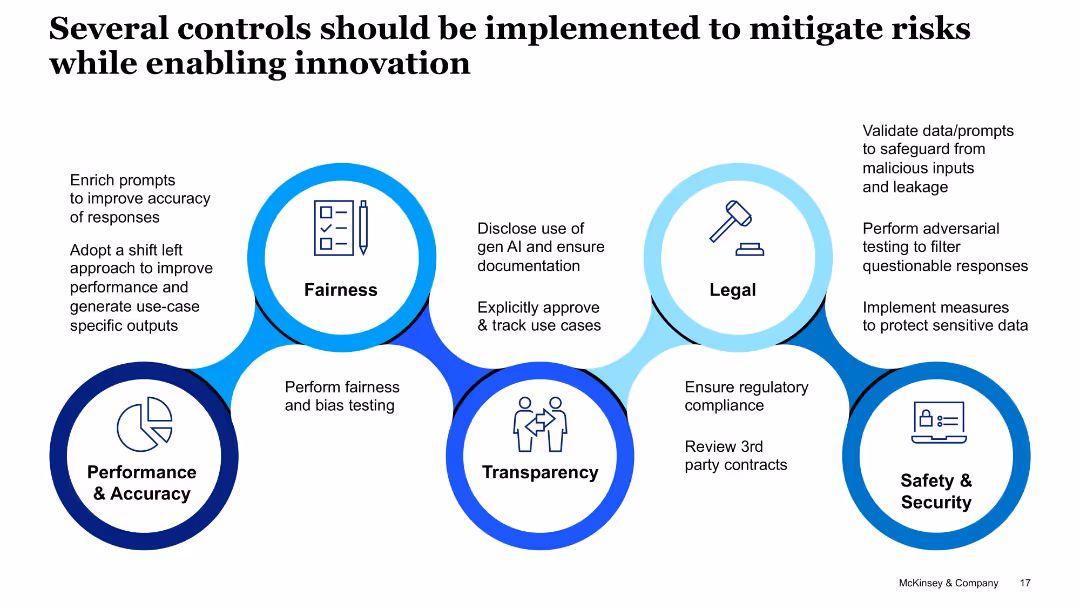
Interlinked circular icons with section titles: Performance, Fairness, Transparency, Legal, Safety; each with bullet-point best practices.
Regulatory and Compliance
Artificial Intelligence
This slide outlines five control domains essential for safe and ethical Gen AI deployment: accuracy, fairness, transparency, legal compliance, and security—alongside actionable guidance for risk mitigation and innovation support.
risk controls, compliance, fairness, safety, transparency, AI governance, regulation
Linear Flow
McKinsey
Saved
The slide includes images and text discussing data-driven, social media, and omnichannel strategies for efficient digital marketing in the luxury sector.
Technology and Digital Transformation
Media & Entertainment
The slide emphasizes the need for luxury brands to adopt efficient digital marketing strategies, focusing on data-driven approaches, social media engagement, and omnichannel marketing to maximize their impact and reach.
digital marketing, data-driven, social media, omnichannel, luxury brands
Pillar
BCG
Saved
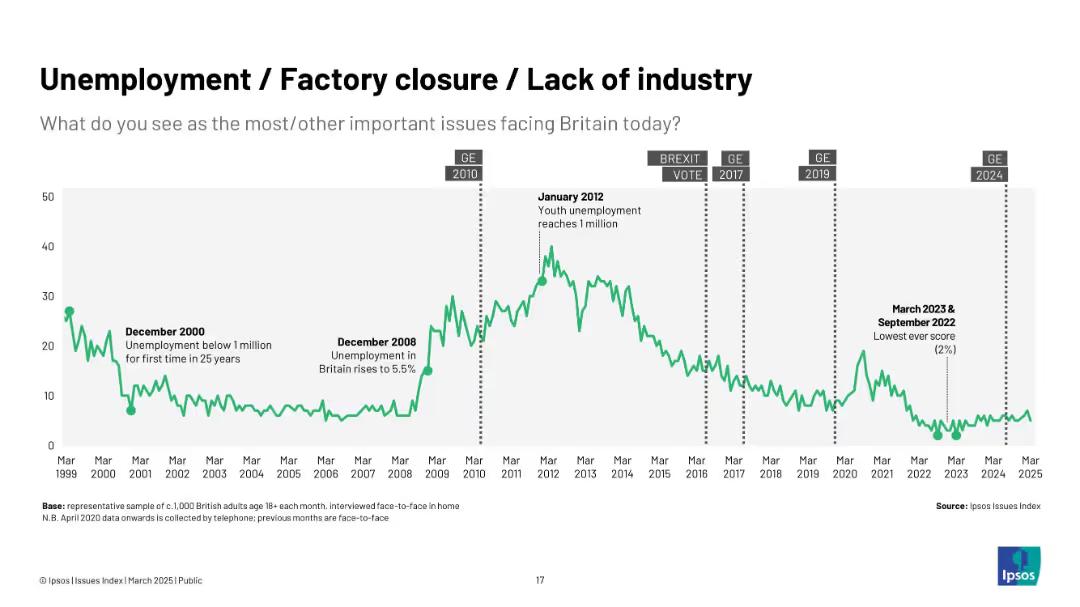
Green line graph showing trend from 1999–2025; annotated with unemployment milestones and elections.
Market Analysis and Trends
Industrial & Manufacturing
The chart displays trends in public concern about unemployment and industry, peaking around economic crises like in 2008 and 2012, and falling to record lows post-2022.
unemployment, factory closure, industry, jobs, economy, Ipsos, recession, economic concern, joblessness
Single Chart
IPSOS
Saved
This slide features a bar graph showing the net present value (NPV) build-up for the H-vision project, including revenue, costs, and subsidies required for profitability.
Investment Analysis
Energy & Utilities
The slide illustrates the financial requirements and expected profitability of the H-vision project in the reference scenario, highlighting the need for a €0.7 billion subsidy and the avoided cost of ETS certificates to achieve economic viability.
H-vision, subsidy, NPV, investment, profitability
Mixed Chart
Kearney
Saved
Previous
Next
If nothing, comes up, please save your slides first
Create a FREE account to continue browsing
Receive Instant Access to 1,000+ slides from companies like McKinsey, Google, and Goldman Sachs
First Name
Last Name
Email
Password
I agree to all
Terms & Privacy Policy
Thank you! Your submission has been received!
Oops! Something went wrong while submitting the form.
Have an account?
Sign in
Column Chart
Heatmap
Chevron
Org Chart
Infographic
Callouts
Timeline
List
Graphic
Picture
Process Flow
Diagram
Paragraph
Map
Table
Framework
Subtitle
Takeaway Box
Icon
Other Chart
Radar Chart
Waterfall Chart
Mekko Chart
Pie Chart
Scatter Plot
Line Chart
Bar chart
Bullet points