My Account
My Slides
Search by Category
Templates
Leave Feedback
Login
Logout
Get Started
Browse all Slides
Browse all Slides
Create a FREE Account
Instant access to 1,000+ real slides from top companies like McKinsey, BCG, Goldman Sachs, Google and many more!
First Name
Last Name
Email
Password
I agree to all
Terms & Privacy Policy
Thank you! Your submission has been received!
Oops! Something went wrong while submitting the form.
Have an account?
Sign in
Saved Slides
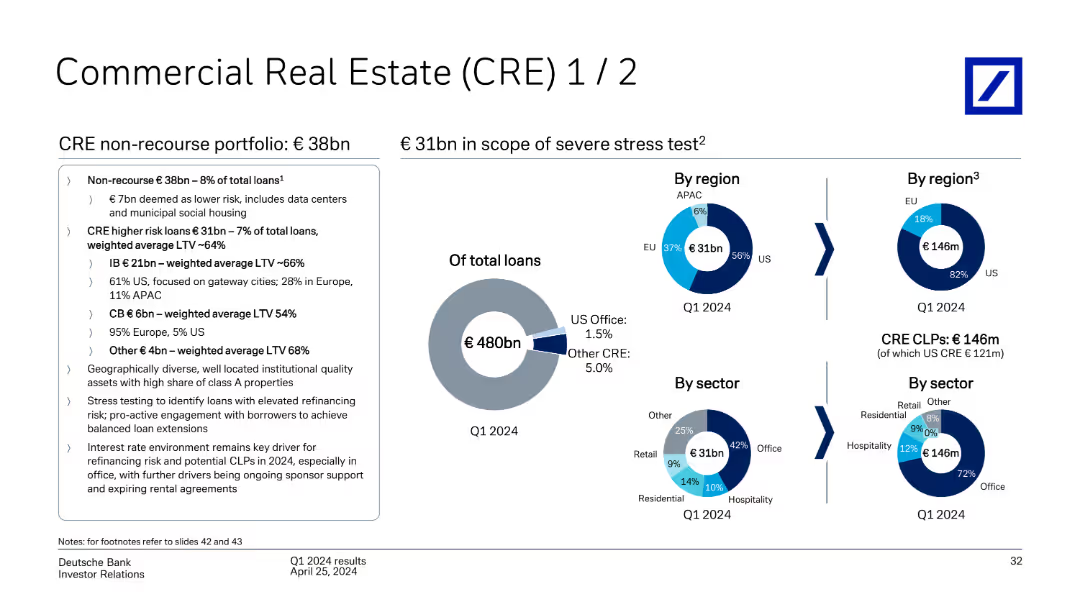
This slide contains pie charts and text detailing Deutsche Bank's CRE portfolio, including non-recourse loans and higher risk loans, segmented by region (US, EU, APAC) and sector (Office, Retail, etc.) as of Q1 2024.
Market Analysis and Trends
Real Estate & Construction
The slide provides an overview of Deutsche Bank's commercial real estate portfolio as of Q1 2024, highlighting non-recourse and higher risk loans, and breaking down the portfolio by region and sector.
commercial real estate, CRE, non-recourse loans, higher risk loans, region, sector, Deutsche Bank, Q1 2024
Multiple Chart
Deutsche Bank
Saved
The slide contains multiple line charts showing the performance of emerging market currencies, including nominal and REER index weights. The layout is focused and data-driven.
Market Analysis and Trends
Financial Services
The slide examines the strengthening of emerging market currencies during Q4, influenced by weaker economic data from the U.S. and Fed policy changes. It provides detailed index performance comparisons.
emerging markets, currencies, Q4 performance, FX, economic data
Mixed Chart
Morgan Stanley
Saved
A line chart comparing Netflix's penetration rates in MVPD (Multichannel Video Programming Distributor) and Non-MVPD U.S. TV households over several quarters. The chart uses two lines to represent each category's penetration trend.
Market Analysis and Trends
Media & Entertainment
This slide compares the penetration of Netflix in MVPD versus Non-MVPD U.S. TV households, showing trends and growth patterns over multiple quarters from Q1 2018 to Q4 2021.
Netflix penetration, MVPD, Non-MVPD, U.S. households, quarterly trends
Single Chart
Nielsen
Saved
Slide details the transition of workforce priorities from COVID-19 to a new reality, focusing on remote work, health, and organizational resilience.
Human Resources and Talent Management
Professional Services
Discusses evolving workforce strategies in response to COVID-19, emphasizing remote work and health, useful for HR and organizational development.
COVID-19, workforce, remote work, health, organizational change
Header Horizontal
BCG
Saved
Diagrams and descriptive text explain the concept of smart contracts, showing examples of how they operate in transactions and loan processes, with visual aids like flowcharts and character illustrations.
Technology and Digital Transformation
Technology & Software
Outlines the functionality of smart contracts in blockchain, detailing their role in automating transactions and enforcing agreements digitally. Ideal for illustrating innovative contract management solutions in technology applications.
smart contracts, blockchain, automation, digital agreements, transactions
Boxed
McKinsey
Saved
Green themed slide showcasing circular statistics about organizational views on sustainability and its impact on workers and society.
Regulatory and Compliance
Environmental Services & Sustainability
Discusses the growing focus on sustainability in business strategies and the readiness of organizations to implement sustainable practices.
sustainability, organizational readiness, human element, societal impact, business strategy
Multiple Chart
Deloitte
Saved
The slide includes column chart and diagrams showing the economic impact of Copernicus on agriculture.
Market Analysis and Trends
Agriculture & Food Production
Focuses on precision farming and the economic benefits derived from using Copernicus data in agriculture, aiming to enhance profitability and productivity.
Agriculture, Precision Farming, Copernicus, Profitability, Productivity
Mixed Chart
PwC/Strategy&
Saved
Contains a mix of bar charts and tables depicting financial metrics like revenues and costs, alongside textual annotations and a simple, professional color scheme.
Financial Performance
Financial Services
This slide covers the financial outcomes for the Corporate & Other segment, detailing losses and expenses with key highlights noted.
corporate finance, losses, expenses, financial results, Q4 2023
Mixed Chart
Deutsche Bank
Saved
Features a series of column chart and trend arrows with annotations. It is color-coded to differentiate between various financial metrics over time.
Financial Performance
Financial Services
Slide details factors contributing to profitability, using ROTE and efficiency ratio metrics. Intended for financial analysis or investor briefings.
Profitability, ROTE, Efficiency, Financial Analysis, Performance, Metrics, Trends, Improvement
Single Chart
Goldman Sachs
Saved
Line charts on this slide show the development of annual disposable income in various country clusters, marked by simple graphical elements for clarity.
Market Analysis and Trends
Financial Services
This slide focuses on the projected growth in disposable income, indicating potential changes in consumer markets and economic power shifts.
disposable income, consumer markets, BRICS, economic growth, income analysis
Multiple Chart
Roland Berger
Saved
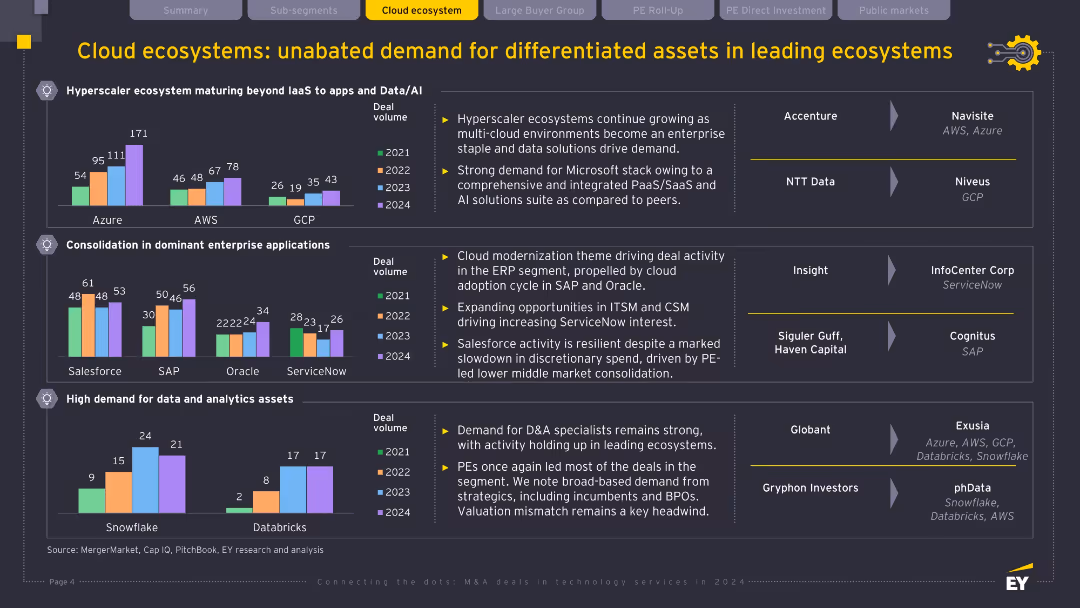
Three bar chart panels (hyperscaler growth, enterprise application consolidation, D&A demand); company logos and acquisition arrows on right; black background with yellow title bar.
Market Analysis and Trends
Technology & Software
This slide explores persistent demand for cloud ecosystem assets, highlighting hyperscaler expansion, application modernization (Salesforce, SAP), and continued strength in data & analytics. It notes strategic acquisitions and key players expanding within AWS, Azure, and other cloud domains to meet enterprise transformation demands.
cloud ecosystem, hyperscaler, data analytics, AWS, Azure, SAP, acquisitions
Multiple Chart
EY
Saved
A horizontal bar chart showing the percentage of titles distributed among various linear and OTT services as of February 2022, alongside a key statistic of 817K unique program titles.
Product and Service Analysis
Media & Entertainment
The slide provides an overview of the distribution of video content titles across different services, emphasizing the growth in content availability.
video, content, titles, services, distribution
Mixed Chart
Nielsen
Saved
The slide features a column chart detailing U.S. real estate transaction volumes from 1Q13 to 1Q24. The volumes are segmented by property types: Office, Industrial, Retail, and Apartment.
Market Analysis and Trends
Real Estate & Construction
This slide shows the trends in U.S. real estate transaction volumes over time, segmented by different types of properties. It's useful for understanding market activity and investment trends in the real estate sector.
transaction volumes, property types, market trends, investment, real estate, analysis
Single Chart
JP Morgan
Saved
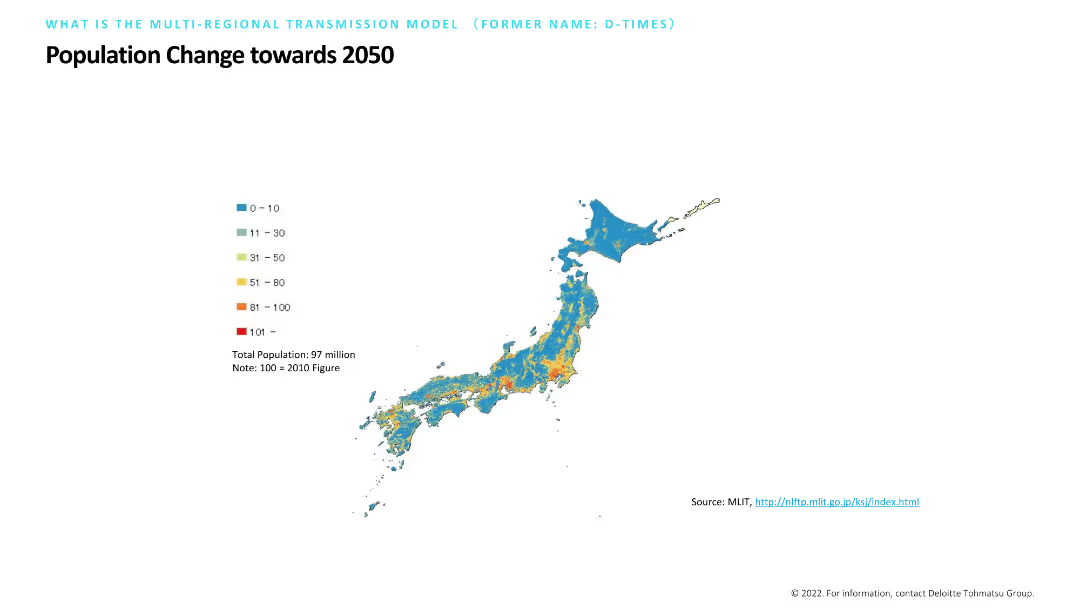
The slide shows a map of Japan with regions color-coded to indicate population change by 2050. Colors range from blue (0-10) to red (101+), providing a visual representation of demographic shifts over time.
Market Analysis and Trends
Government & Public Sector
The slide projects population changes in Japan towards 2050, showing areas of growth and decline. This is useful for urban planning and resource allocation in public sector projects.
Population change, 2050, Japan, demographic shifts, map
Graphic
Deloitte
Saved
Describes DEI initiatives, including tying executive compensation to DEI goals and fostering an inclusive culture.
Strategic Planning
Professional Services
Highlights DEI as a key element of the firm's growth plans and client mission needs.
DEI, diversity, equity, inclusion, leadership, innovation
Text Only
Booz Allen Hamilton
Saved
Line chart showing Japan's policy rate and yield curve control band. Another chart shows BOJ's holdings of government bonds and ETFs.
Market Analysis and Trends
Financial Services
Examines the Bank of Japan's monetary policy, highlighting the policy rate and bond holdings to understand its impact on the market.
Bank of Japan, monetary policy, yield curve, bonds, ETFs
Multiple Chart
JP Morgan
Saved
Contains a line graph comparing TCO for electric and diesel buses over mileage.
Investment Analysis
Financial Services
Analyzes how long-term savings from EVs can offset higher initial costs.
EV, TCO, cost savings, electric buses, diesel comparison
Mixed Chart
PwC/Strategy&
Saved
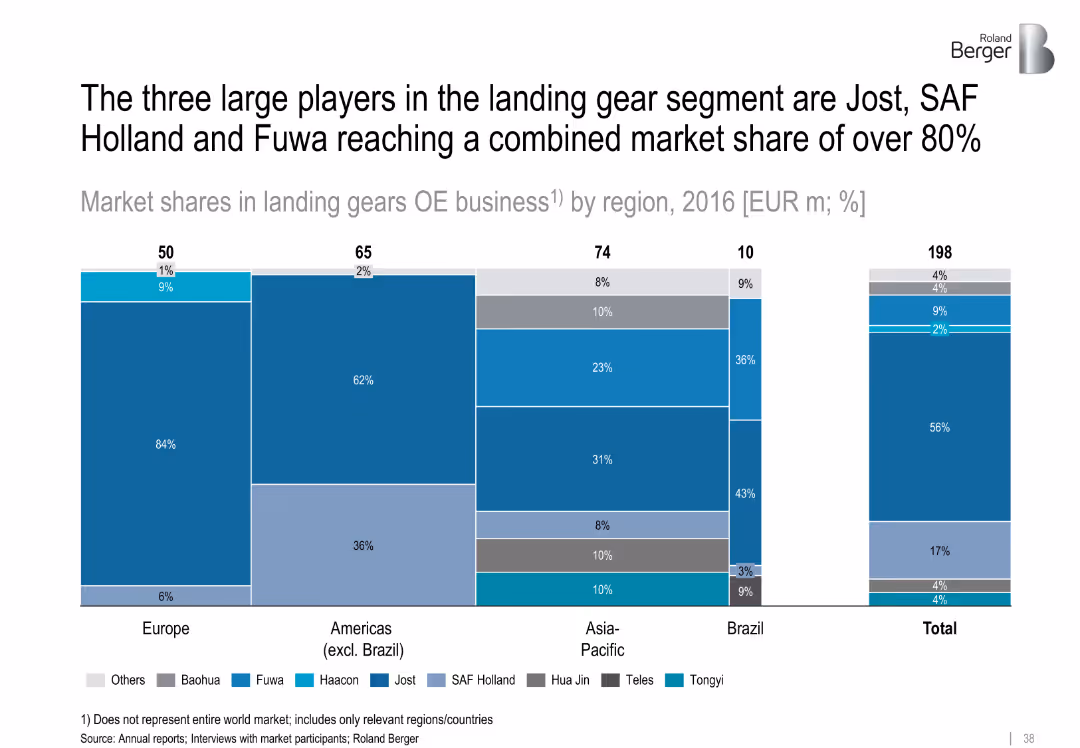
Bar chart showing 2016 landing gear market shares by region and company; color-coded segments
Competitive Landscape
Transportation & Logistics
Jost, SAF Holland, and Fuwa dominate the landing gear market with over 80% combined share. Regional charts illustrate varying dominance by player. Asia-Pacific and Brazil show more diversity among manufacturers.
landing gears, Jost, SAF Holland, Fuwa, market share, OE business, regional competition
Single Chart
Roland Berger
Saved
This slide features a line chart depicting the maturity curve of CO₂ separation and capture technologies. It includes different colored lines representing various industries and technologies.
Technology and Digital Transformation
Energy & Utilities
It illustrates the maturity stages of CO₂ separation and capture technologies from lab work to widely deployed stages, highlighting the capital requirements and technology risk involved.
CO₂ capture, maturity curve, separation technologies, capture technologies, energy, utilities, capital requirements
Single Chart
Kearney
Saved
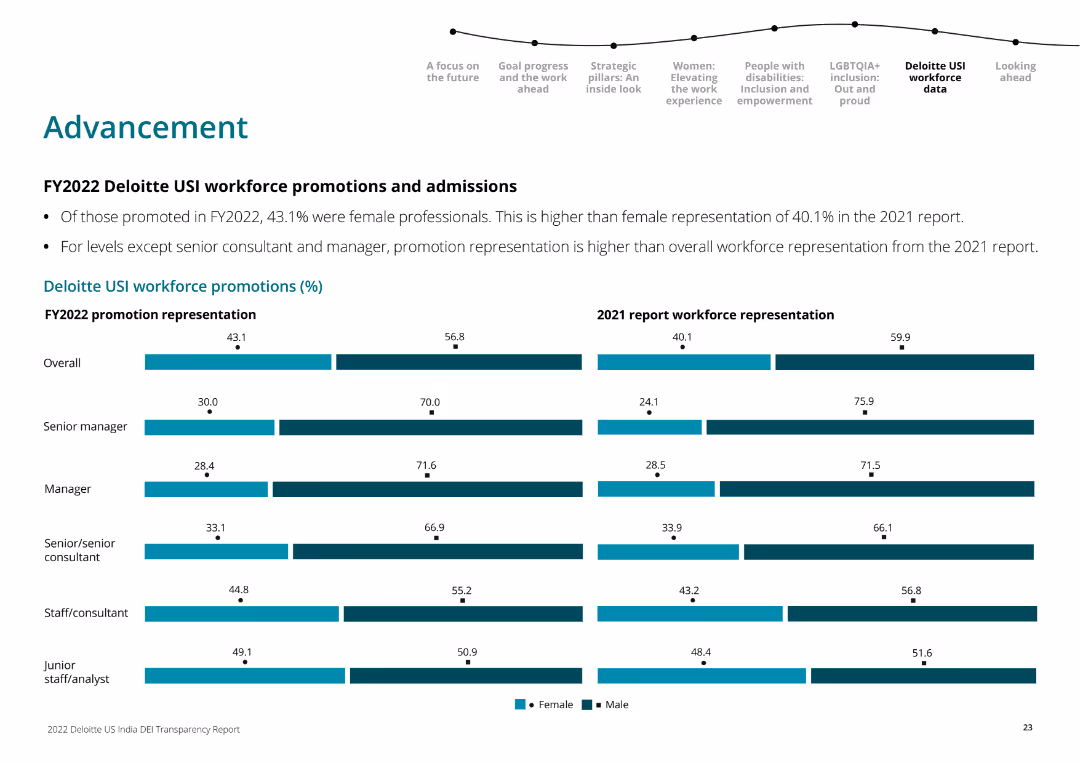
Horizontal bar charts comparing workforce promotion representation by gender across different levels for FY2022 and 2021.
Human Resources and Talent Management
Professional Services
This slide compares gender distribution in promotions at Deloitte USI for various organizational levels between FY2022 and the 2021 report.
workforce, promotions, gender, Deloitte, comparison, FY2022, FY2021, bar chart
Multiple Chart
Deloitte
Saved
A text section with bullet points next to a pie chart illustrating the 2021 allocations by impact theme. The text outlines the framework and strategic objectives of green bond issuance, with an emphasis on alignment with climate transition and inclusive growth themes.
Regulatory and Compliance
Environmental Services & Sustainability
Details the company's commitment to sustainability through the issuance of green bonds, aligned with strategic themes such as clean energy and community support. It also outlines the annual impact and reporting strategy, illustrating the distribution of investments across various sustainability initiatives.
green bonds, sustainability, impact investment, climate transition, inclusive growth, pie chart
Mixed Chart
Goldman Sachs
Saved
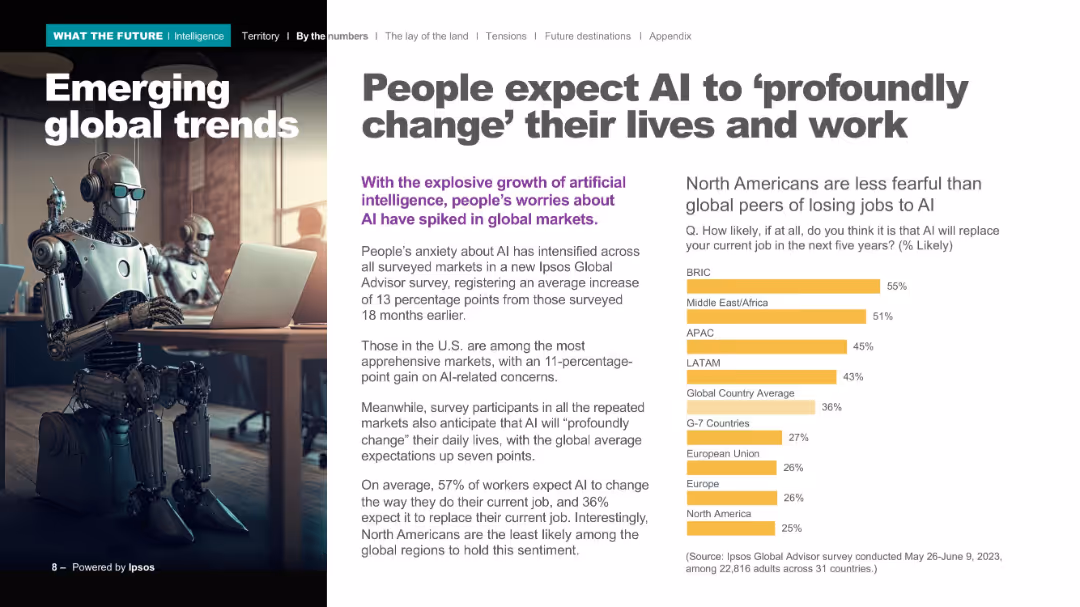
Full-page photo on left with humanoid robot, right side includes text block and yellow horizontal bar chart.
Market Analysis and Trends
Artificial Intelligence
Details global perspectives on AI’s impact on jobs and daily life. Emphasizes rising concern levels, with a breakdown of expected job displacement likelihood by region. North America is shown as least concerned compared to others.
AI transformation, job loss, global sentiment, Ipsos Global Advisor, survey, BRIC, regional trends
Mixed Chart
IPSOS
Saved
Utilizes pie charts and bar charts to assess challenges in customer interactions and current strategies employed by GBS organizations to enhance customer experience.
Customer and Market Segmentation
Professional Services
Analyzes challenges and steps taken by GBS organizations to improve customer service and engagement.
GBS, customer experience, service improvement, engagement strategies, challenges
Multiple Chart
Deloitte
Saved
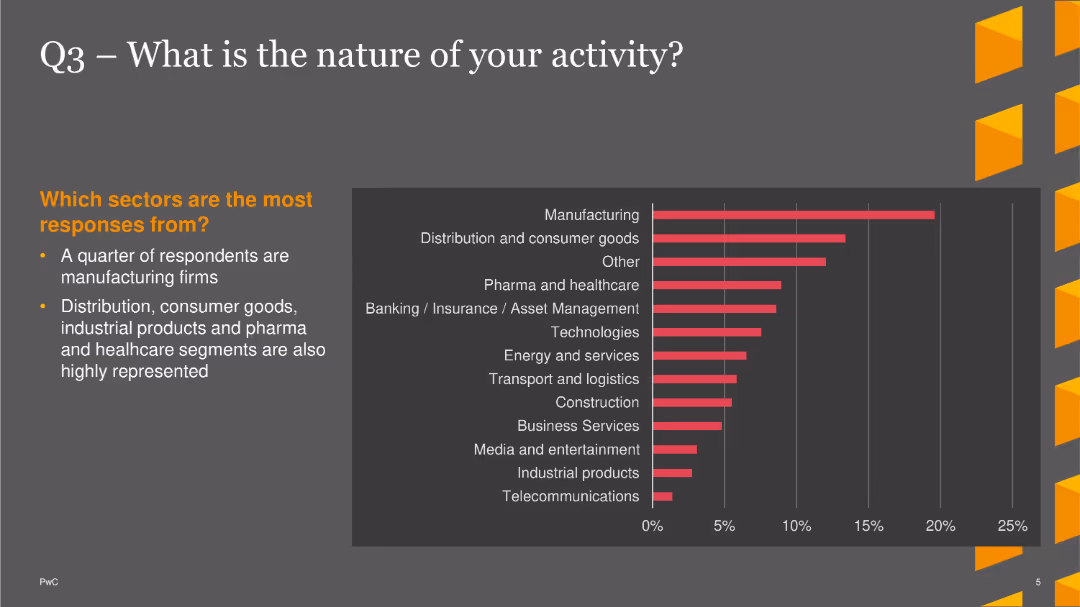
The slide displays a column chart showing the nature of business activities, with manufacturing and distribution/consumer goods being the most common.
Market Analysis and Trends
Financial Services
The slide indicates that a quarter of respondents are in manufacturing, with significant representation in distribution, consumer goods, and healthcare sectors.
Business Activity, Manufacturing, Distribution, Column Chart, PwC, Survey, 2022
Mixed Chart
PwC/Strategy&
Saved
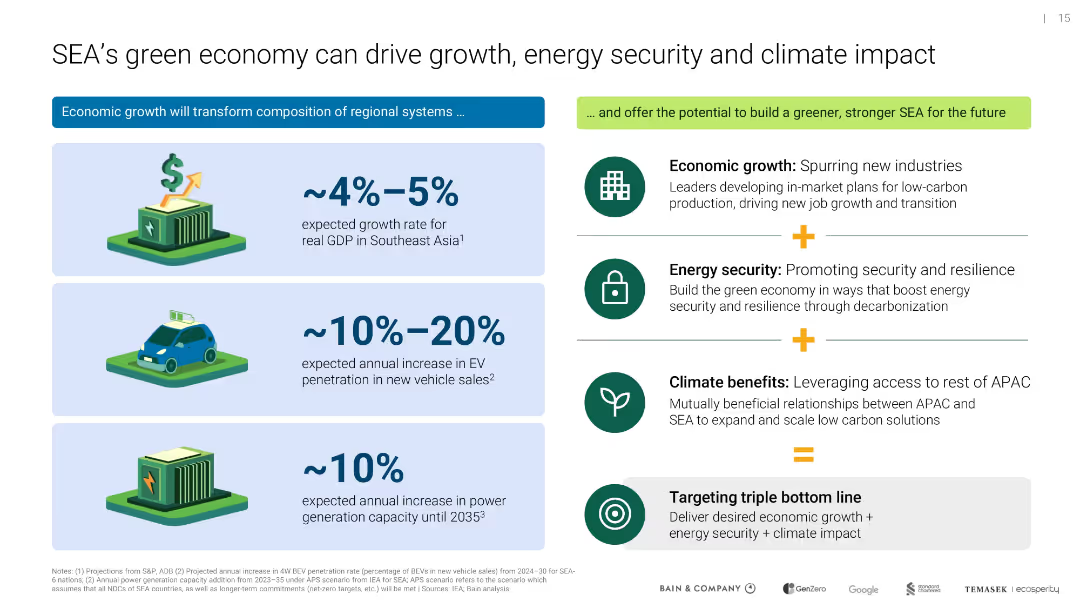
Two-column layout with graphics on left and summary points on right; bright icons and metrics highlight economic and environmental benefits
Market Analysis and Trends
Environmental Services & Sustainability
Highlights Southeast Asia’s green economy potential for GDP growth, EV adoption, and power generation, emphasizing economic, energy security, and climate benefits of regional transformation.
green economy, Southeast Asia, GDP, EV growth, energy security, climate impact
Table
Bain
Saved
Previous
Next
If nothing, comes up, please save your slides first
Create a FREE account to continue browsing
Receive Instant Access to 1,000+ slides from companies like McKinsey, Google, and Goldman Sachs
First Name
Last Name
Email
Password
I agree to all
Terms & Privacy Policy
Thank you! Your submission has been received!
Oops! Something went wrong while submitting the form.
Have an account?
Sign in
Column Chart
Heatmap
Chevron
Org Chart
Infographic
Callouts
Timeline
List
Graphic
Picture
Process Flow
Diagram
Paragraph
Map
Table
Framework
Subtitle
Takeaway Box
Icon
Other Chart
Radar Chart
Waterfall Chart
Mekko Chart
Pie Chart
Scatter Plot
Line Chart
Bar chart
Bullet points