My Account
My Slides
Search by Category
Templates
Leave Feedback
Login
Logout
Get Started
Browse all Slides
Browse all Slides
Create a FREE Account
Instant access to 1,000+ real slides from top companies like McKinsey, BCG, Goldman Sachs, Google and many more!
First Name
Last Name
Email
Password
I agree to all
Terms & Privacy Policy
Thank you! Your submission has been received!
Oops! Something went wrong while submitting the form.
Have an account?
Sign in
Saved Slides
This slide shows a series of column charts comparing the share of quantum patents by country and technology type (QT, QC, QComms, QS). Each chart lists countries such as China, Japan, EU, USA, and others.
Market Analysis and Trends
Technology & Software
The slide highlights the dominance of Chinese companies in obtaining QT patents across various technology types. It compares the patent shares of different countries and provides key takeaways on global patent trends.
QT, Patents, China, Technology, Countries
Multiple Chart
McKinsey
Saved
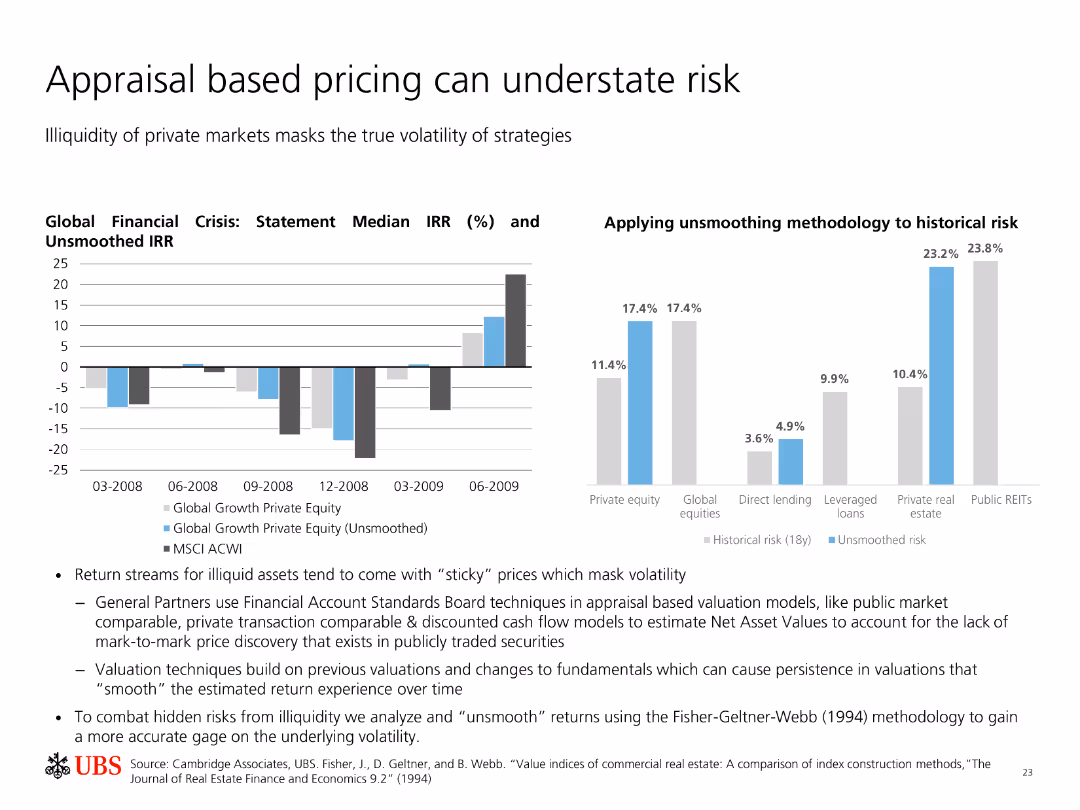
Two charts: one column chart showing IRR during the financial crisis, and another column chart comparing historical risk with unsmoothed risk.
Risk Assessment and Management
Financial Services
The slide discusses how illiquidity in private markets can mask true volatility. It shows the difference in performance when using smoothed vs. unsmoothed valuation models.
Appraisal, Risk, Volatility, Private Equity, Financial Crisis
Multiple Chart
UBS
Saved
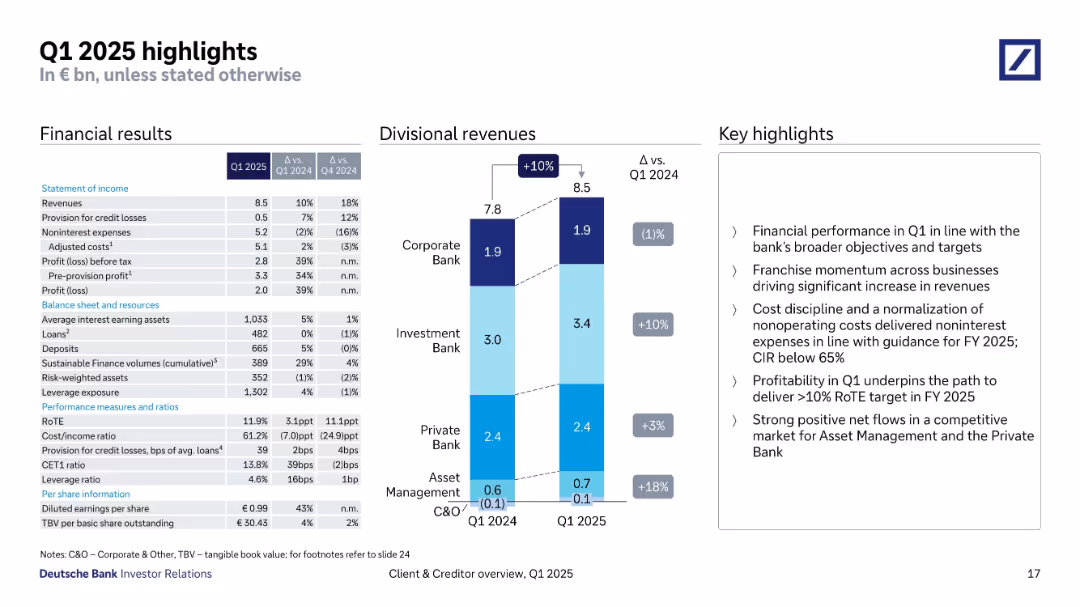
Combined table and chart layout showing financial summary, divisional revenues, and key bullet insights.
Financial Performance
Financial Services
This overview presents key Q1 2025 metrics: revenues of €8.5bn (up 10% YoY), reduced noninterest expenses, 11.9% RoTE, and CIR below 65%. Divisional revenues show strong gains in Investment and Asset Management, reinforcing performance aligned with strategic targets.
Q1 2025, financial results, revenue growth, RoTE, CIR, divisional performance, cost control, strategy execution
Mixed Chart
Deutsche Bank
Saved
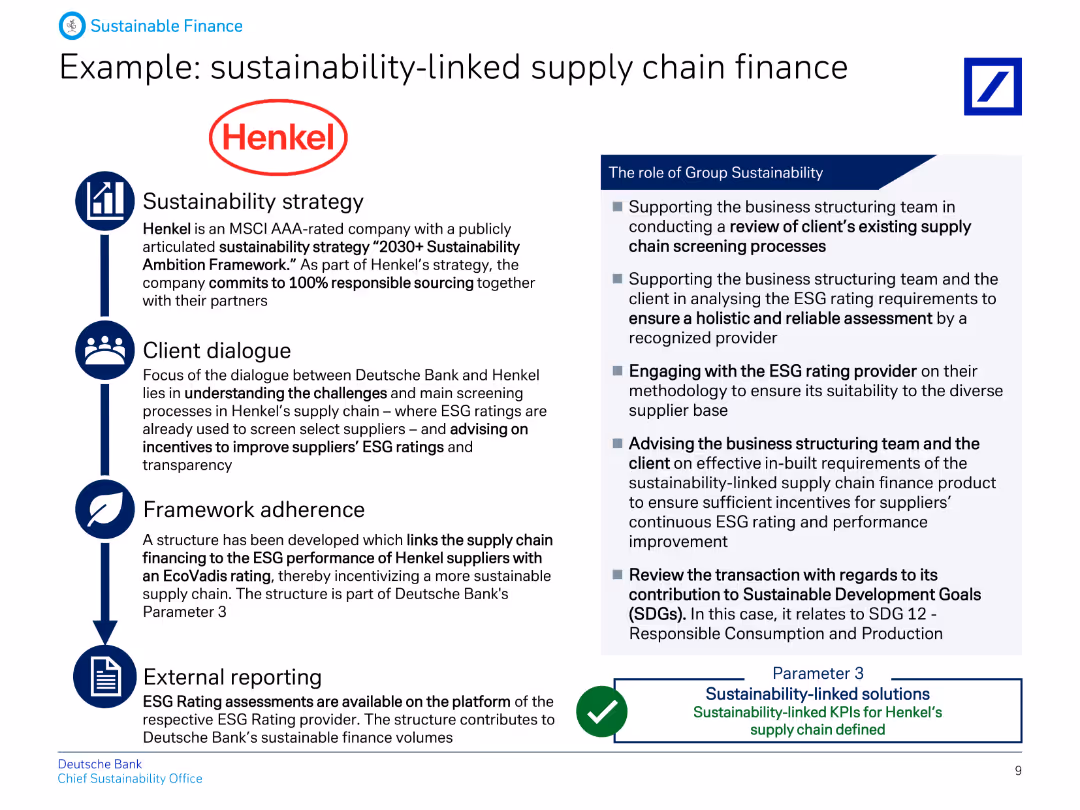
This slide presents a case study with Henkel, detailing their sustainability strategy, client dialogue, framework adherence, and external reporting, with relevant icons.
Client Case Studies
Financial Services
Provides an example of how Deutsche Bank supports Henkel in sustainability-linked supply chain finance, outlining the strategy, client dialogue, framework adherence, and reporting.
Sustainability, supply chain, finance, Henkel, strategy, client, framework, reporting, banking, ESG
Vertical Flow
Deutsche Bank
Saved
Features a detailed process flow diagram of the H₂ value chain, highlighting upstream, midstream, and downstream opportunities for carbon fiber vessels.
Strategic Planning
Industrial & Manufacturing
The slide identifies strategic opportunities for carbon fiber vessels within the H₂ value chain, covering storage, transportation, and end-use markets.
H₂, Carbon Fiber Vessels, Value Chain, Opportunities, Storage
Linear Flow
Roland Berger
Saved
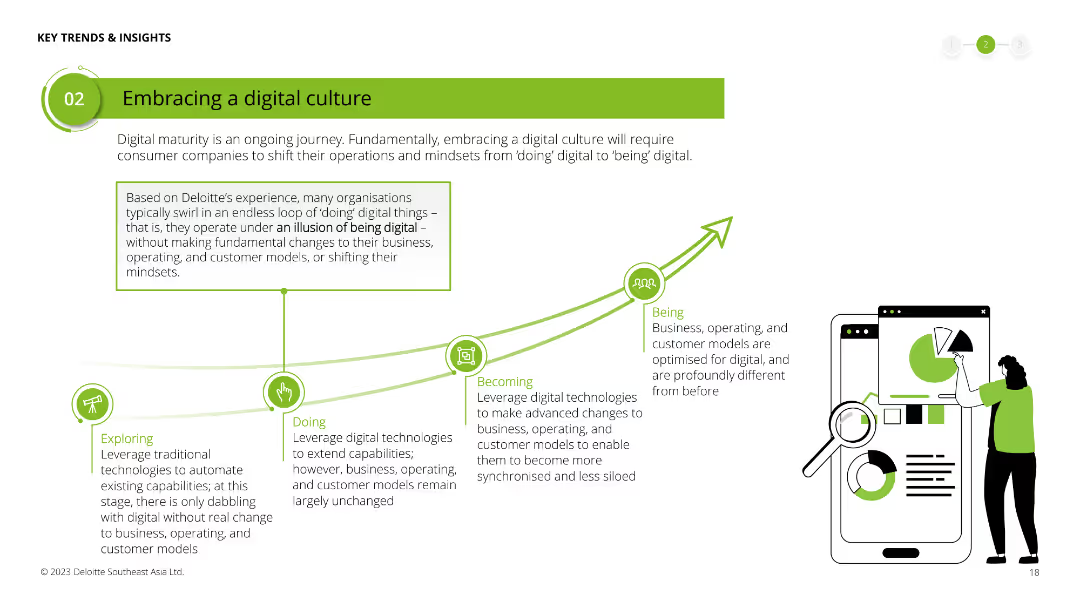
Illustrates a conceptual journey from "Exploring" to "Being" a digital company with a line chart and icons representing different stages. Large text box in the center with a detailed explanation.
Human Resources and Talent Management
Technology & Software
Discusses the stages of digital maturity for organizations, emphasizing the shift from just doing digital tasks to fully being digital in their culture and operations.
digital culture, maturity, organizational change, digital transformation, exploring, doing, becoming, being
Linear Flow
Deloitte
Saved
A minimalist slide with an agenda list on the left and a vibrant image of shipping containers on the right, suggesting a theme related to logistics or global business.
Strategic Planning
Professional Services
Serves to outline the topics of discussion in a business or strategy meeting, with a visual nod to global operations and logistics.
Agenda, Logistics, Global Business, Meeting, Strategy
Agenda
Morgan Stanley
Saved
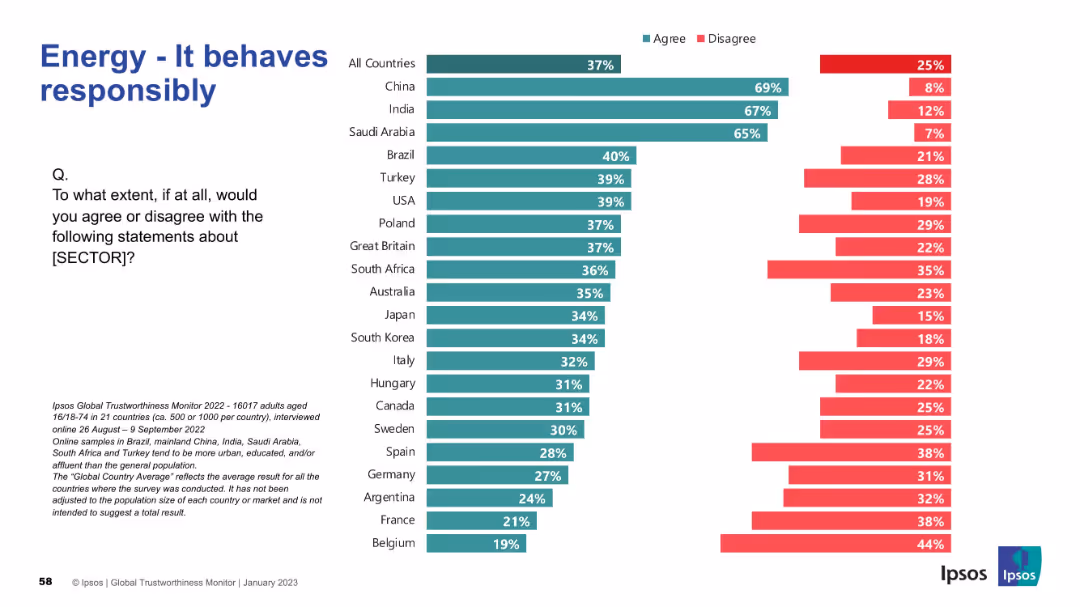
Bar chart with country-wise comparison; clean layout; use of green and red bars
Market Analysis and Trends
Energy & Utilities
This slide captures perceptions of the energy sector's responsibility in its behavior. Top rankings go to China, India, and Saudi Arabia, suggesting high confidence in these regions. Belgium, France, and Argentina show the least trust.
responsibility, trust, behavior, perception, energy, Ipsos, international survey, ethical conduct, reputation
Mixed Chart
IPSOS
Saved
This slide features a dual bar chart comparing consumer priorities over the last twelve months, focusing on product quality, service, and price, among others. The layout is well-organized with labels, percentage values, and a color differentiation for easier comparison. The side panel includes additional insights that contextualize the data presented.
Product and Service Analysis
Professional Services
Analyzing consumer priorities, this slide shows a shift towards product quality over other aspects like service or price. It highlights the changing consumer behavior post-pandemic, with data segmented from a recent survey. Useful for marketing teams to strategize product development and customer service improvements, adapting to consumer trends.
consumer behavior, product quality, service, price, priorities
Mixed Chart
Deloitte
Saved
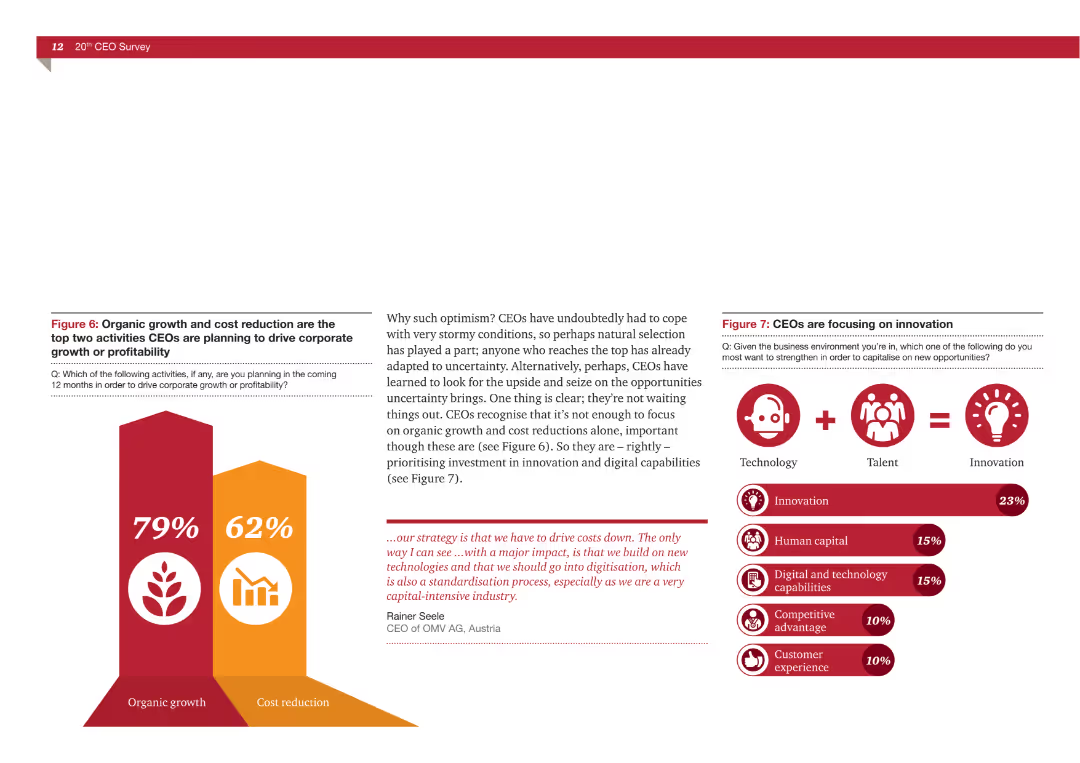
The slide features a column chart comparing organic growth (79%) and cost reduction (62%). It also has icons and small textual descriptions explaining the focus on innovation.
Strategic Planning
Professional Services
This slide compares the top two activities CEOs are planning to drive corporate growth or profitability: organic growth and cost reduction. It highlights that 79% of CEOs focus on organic growth while 62% prioritize cost reduction. The slide emphasizes the need for innovation.
Organic growth, cost reduction, CEOs, corporate growth, profitability, innovation, strategic planning
Multiple Chart
PwC/Strategy&
Saved
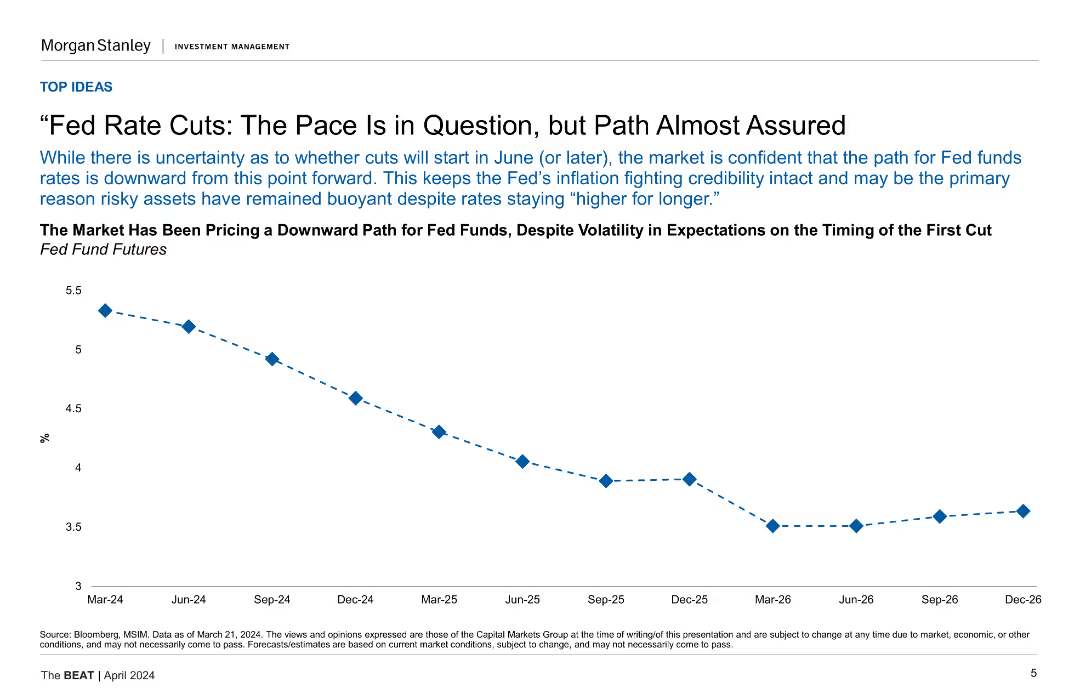
A line chart showing the downward path for Fed fund futures from Mar-24 to Dec-26.
Market Analysis and Trends
Financial Services
This slide discusses the market's expectation of a downward path for Fed funds rates despite volatility, showing projections until December 2026.
Fed Rates, Market Analysis, Futures, Projections, Volatility
Mixed Chart
Morgan Stanley
Saved
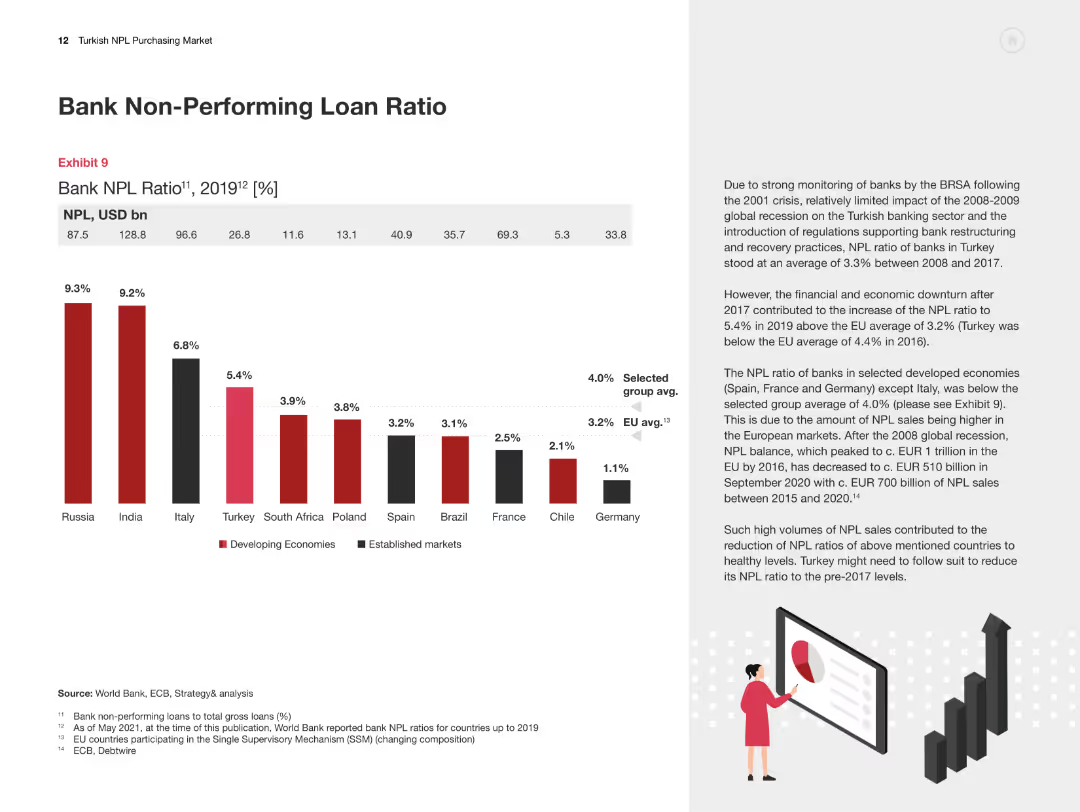
The slide features a column chart comparing the bank NPL ratios across various countries for 2019, with explanatory text on the significance and implications of these ratios.
Risk Assessment and Management
Financial Services
This slide presents a comparative analysis of bank non-performing loan ratios across different countries, emphasizing the significance and implications for the Turkish market.
NPL Ratio, Comparative Analysis, Turkey, International Comparison, Risk Assessment
Mixed Chart
PwC/Strategy&
Saved
The slide uses vertical bar charts to compare the top five concerns deterring EV adoption over three years (2021, 2022, 2023), each with different colors.
Market Analysis and Trends
Transportation & Logistics
This slide identifies the main concerns preventing consumers from buying EVs, such as lack of charging stations, limited range, and high purchase costs, across different years.
EV concerns, charging stations, purchase cost, range anxiety, consumer deterrents
Multiple Chart
EY
Saved
The slide features a diagram showing the biomass-to-energy carbon cycle, detailing the flow of CO2 from biofuel production to consumption, and its subsequent absorption by biomass through photosynthesis.
Technology and Digital Transformation
Energy & Utilities
This slide explains the carbon neutrality of bioenergy through the natural carbon cycle of biomass, illustrating how CO2 emissions from biofuel production and consumption are balanced by biomass absorption.
biomass, bioenergy, carbon cycle, CO2 emissions, carbon neutrality, biofuel production
Linear Flow
Kearney
Saved
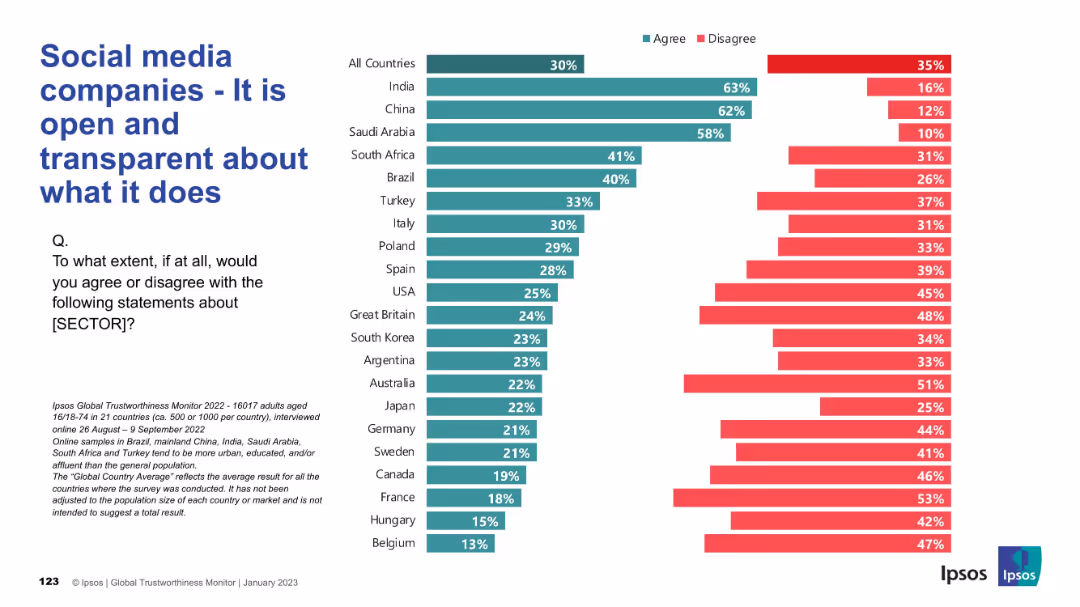
Horizontal bar graph layout with agreement and disagreement rates by country; consistent design language and branding from earlier slides.
Market Analysis and Trends
Technology & Software
This slide reveals perceptions about the transparency of social media companies. While some countries (India, China) express high trust in transparency, most Western countries exhibit skepticism, with agreement percentages frequently under 30%.
transparency, openness, trust, perception, social media, global, Ipsos, agreement
Mixed Chart
IPSOS
Saved
Includes a detailed diagram categorizing H2 production technologies by primary source and conversion technology, along with associated hydrogen categories.
Technology and Digital Transformation
Energy & Utilities
Outlines different hydrogen production technologies, categorized into thermochemical, electrolysis, microbial, and photolytic methods, and their respective applications.
Hydrogen, conversion technologies, thermochemical, electrolysis, production methods
Diagram
Kearney
Saved
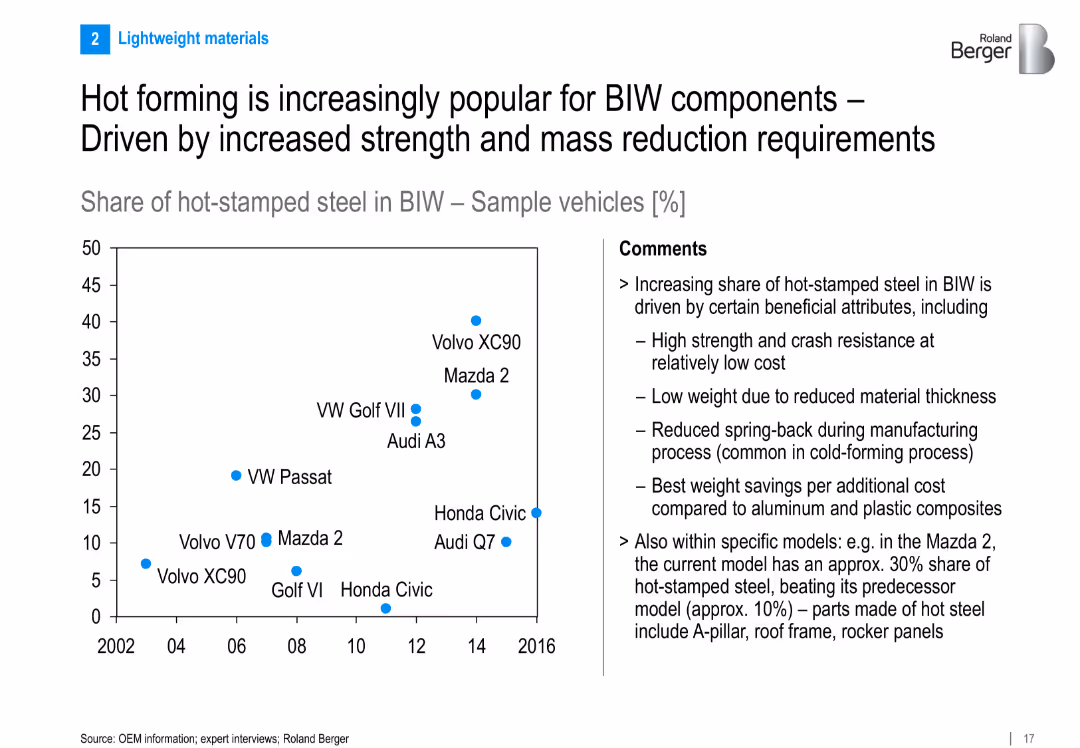
Left side: scatter plot showing hot-stamped steel share in BIW across vehicles and years; right side: comments explaining benefits; clean layout with a focus on data
Market Analysis and Trends
Industrial & Manufacturing
Shows the rising adoption of hot-stamped steel in Body-in-White (BIW) components. Benefits include strength, reduced weight, and low cost. Includes example models like Mazda 2 and Audi Q7 with increasing hot-stamp usage.
hot forming, BIW, hot-stamped steel, vehicle weight, OEMs, trend, body structure, strength, mass reduction
Mixed Chart
Roland Berger
Saved
The slide divides into two halves; one for consumer e-wallet adoption and the other for merchant adoption. It includes bullet points and icons representing consumers and merchants.
Market Analysis and Trends
Financial Services
This slide discusses the growth in e-wallet transactions spurred by consumer and merchant adoption, fostering a 'virtuous cycle'. It can be used to highlight the impact of digital platforms on e-wallet proliferation and market engagement.
e-Wallet, Consumer, Merchant, Adoption, Growth, Digital payments, Market engagement, Incentives
Header Horizontal
Bain
Saved
Contains a series of tables and bar graphs comparing quarterly financial data and sector performance.
Financial Performance
Financial Services
Reviews financial metrics and sector-specific performance of an investment bank in Q4 2023, key for financial analysts and stakeholders.
investment bank, financial analysis, Q4, sector performance, metrics
Mixed Chart
Deutsche Bank
Saved
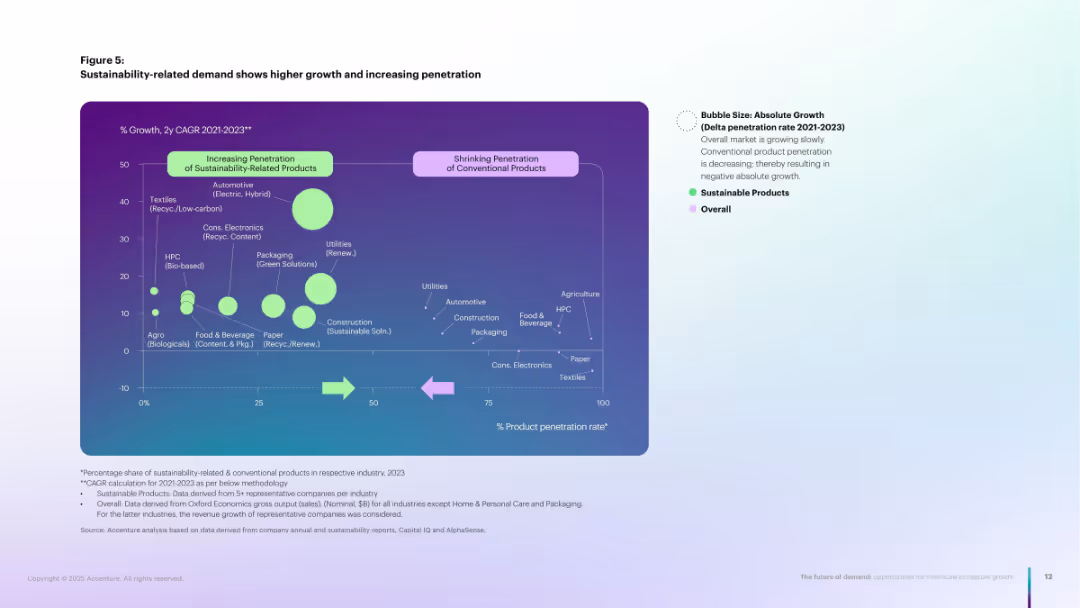
Bubble chart comparing CAGR and product penetration for sustainable vs. conventional products.
Market Analysis and Trends
Environmental Services & Sustainability
Bubble chart illustrating how sustainable products are gaining higher market penetration and faster growth compared to conventional ones. Emphasizes accelerating demand for bio-based, recycled, or renewable offerings.
Sustainable demand, CAGR, penetration, bubble chart, green growth
Single Chart
Accenture
Saved
Features a world map highlighting the GDP PPP growth rates of specific countries and bar charts showing the share of global GDP PPP. Utilizes color differentiation for clear distinction among country groups.
Market Analysis and Trends
Financial Services
The slide presents real GDP PPP growth rates alongside the global share of GDP, useful for discussions on economic influence and forecasting global economic balances.
GDP PPP, economic forecasting, BRICS, global economy, growth rates
Multiple Chart
Roland Berger
Saved
This slide has multiple line graphs titled "Indexed valuation based on pooled return, global buyout-backed holdings". It compares the valuations of different sectors against major indices from Q4 2019 to Q3 2022, with colored lines indicating each sector.
Market Analysis and Trends
Financial Services
Discusses the divergence in valuations between private and public entities over time, shedding light on strategic considerations for valuation and investment approaches within these sectors.
Valuations, Private Companies, Public Companies, Investment, Indexed Valuation, Sectors
Single Chart
Bain
Saved
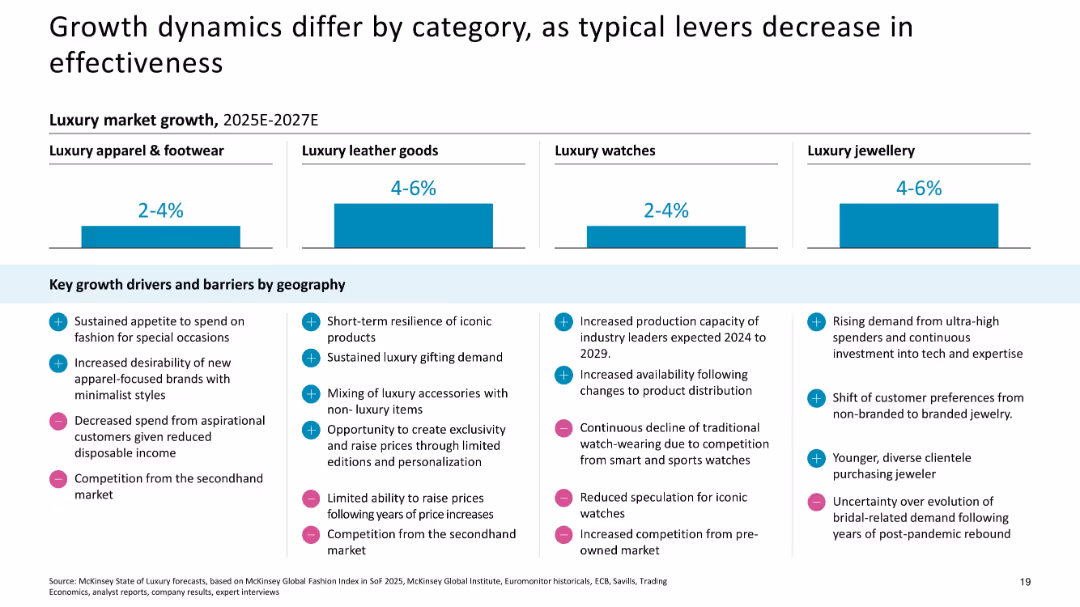
Grid format with segmented bar forecasts and bullet points; categorized by product type
Strategic Planning
Consumer Goods
Forecasts luxury market growth by product category (2025E–2027E) and identifies key growth drivers and barriers by geography and segment (e.g., leather goods, apparel, jewelry, watches).
luxury segments, market growth, product categories, drivers, barriers, 2027 forecast, apparel, leather goods, jewelry, watches
Mixed Chart
McKinsey
Saved
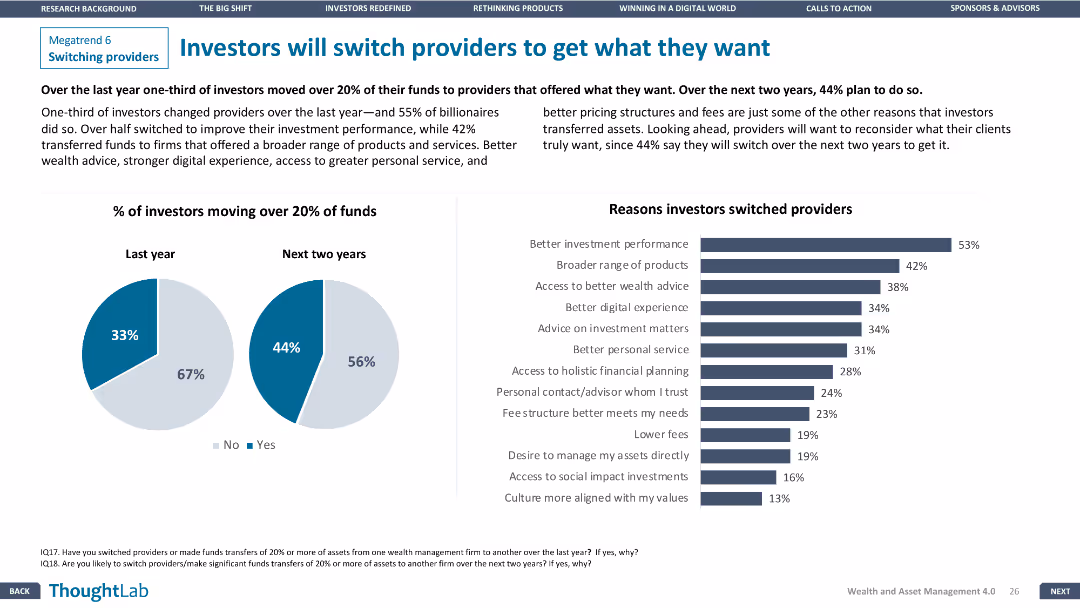
Pie charts and a column chart detailing investor fund movement and reasons for switching providers. Layout is visually clear and informative.
Customer and Market Segmentation
Financial Services
Examines investor behavior regarding switching providers, showing percentages of fund movement and key reasons driving this behavior.
investors, switching, providers, funds, reasons
Multiple Chart
Deloitte
Saved
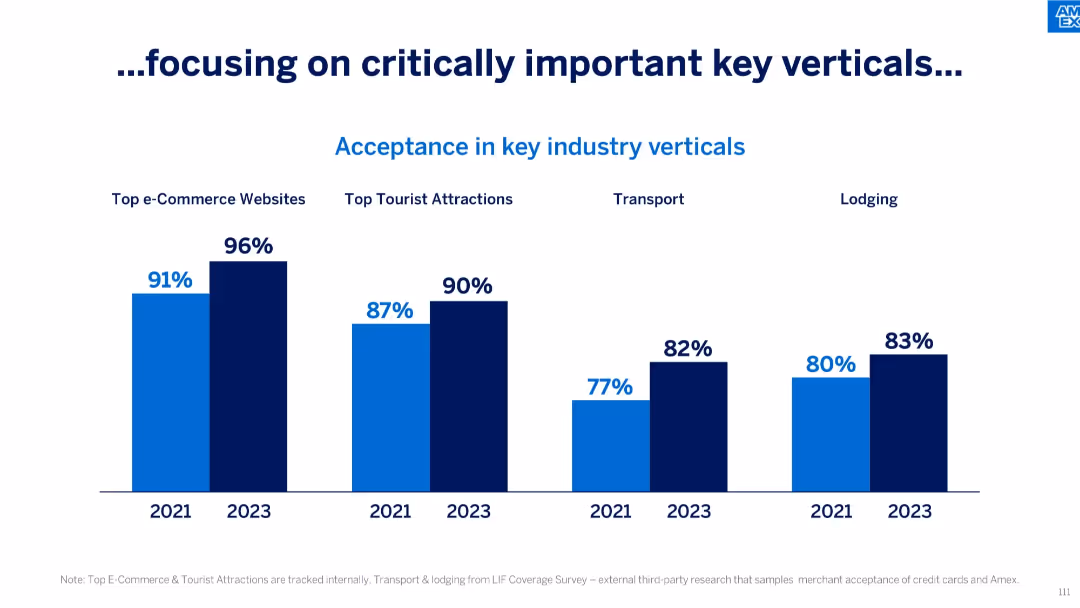
Four grouped bar comparisons between 2021 and 2023 across industry verticals: e-commerce, tourist attractions, transport, and lodging.
Competitive Landscape
Financial Services
This slide presents improvement in Amex acceptance across key verticals, showing growth in top e-commerce sites, tourist attractions, transport, and lodging between 2021 and 2023, reinforcing strategic focus areas.
Key Verticals, Industry Acceptance, E-commerce, Lodging, Tourist Attractions, Transport, Growth
Single Chart
McKinsey
Saved
Previous
Next
If nothing, comes up, please save your slides first
Create a FREE account to continue browsing
Receive Instant Access to 1,000+ slides from companies like McKinsey, Google, and Goldman Sachs
First Name
Last Name
Email
Password
I agree to all
Terms & Privacy Policy
Thank you! Your submission has been received!
Oops! Something went wrong while submitting the form.
Have an account?
Sign in
Column Chart
Heatmap
Chevron
Org Chart
Infographic
Callouts
Timeline
List
Graphic
Picture
Process Flow
Diagram
Paragraph
Map
Table
Framework
Subtitle
Takeaway Box
Icon
Other Chart
Radar Chart
Waterfall Chart
Mekko Chart
Pie Chart
Scatter Plot
Line Chart
Bar chart
Bullet points