My Account
My Slides
Search by Category
Templates
Leave Feedback
Login
Logout
Get Started
Browse all Slides
Browse all Slides
Create a FREE Account
Instant access to 1,000+ real slides from top companies like McKinsey, BCG, Goldman Sachs, Google and many more!
First Name
Last Name
Email
Password
I agree to all
Terms & Privacy Policy
Thank you! Your submission has been received!
Oops! Something went wrong while submitting the form.
Have an account?
Sign in
Saved Slides
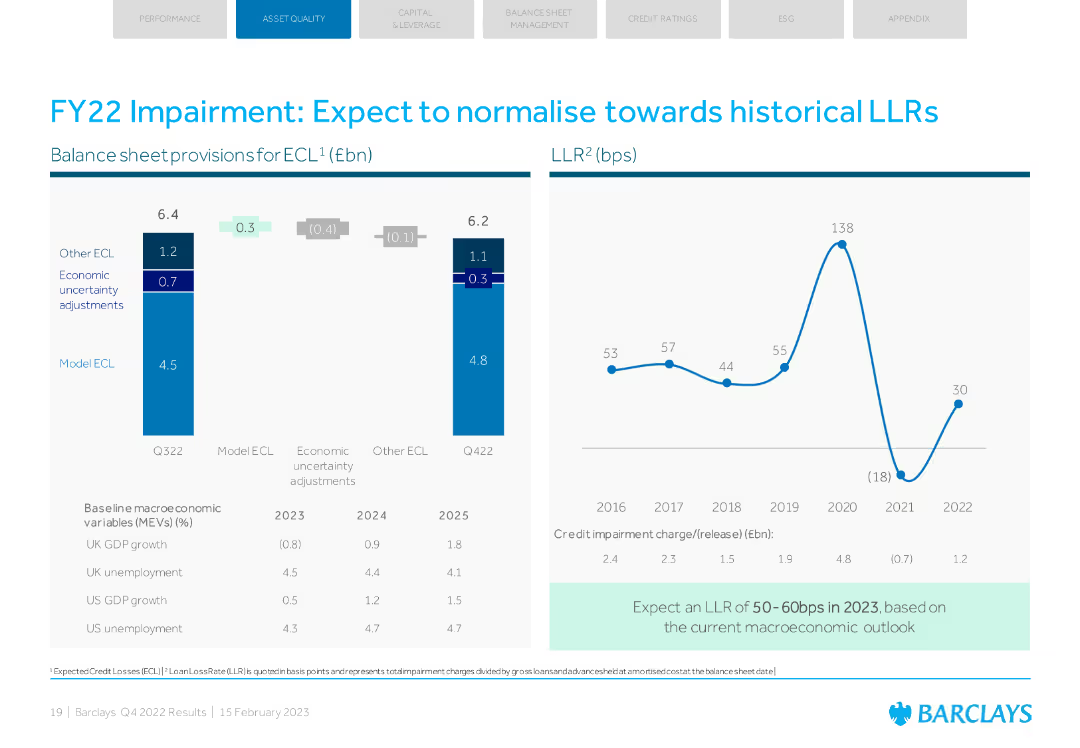
Column charts showing balance sheet provisions for ECL and LLR trends. Economic uncertainty adjustments noted.
Risk Assessment and Management
Financial Services
The slide discusses expected normalization of impairments and loan loss rates, with economic outlook provided.
impairment, LLR, normalization, economic outlook, ECL
Multiple Chart
Barclays
Saved
Includes a column chart listing additional governmental priorities as perceived by the public and a bar graph showing concerns about public debt from 2022 to 2023.
Strategic Planning
Government & Public Sector
Highlights additional public priorities for government commitment beyond existing reforms and tracks public sentiment regarding national debt over two years.
government priorities, public debt, public opinion, fiscal policy, national budget, government commitment, debt concerns, economic strategy, policy development
Multiple Chart
Bain
Saved
Bar chart of liquidity coverage ratio trends and a donut chart of liquidity pool composition, emphasizing high-quality liquid assets and securities.
Financial Performance
Financial Services
Presentation of liquidity coverage ratio and the composition of UBS's liquidity pool, highlighting high-quality liquid assets.
Liquidity, coverage, assets, securities, cash
Multiple Chart
UBS
Saved
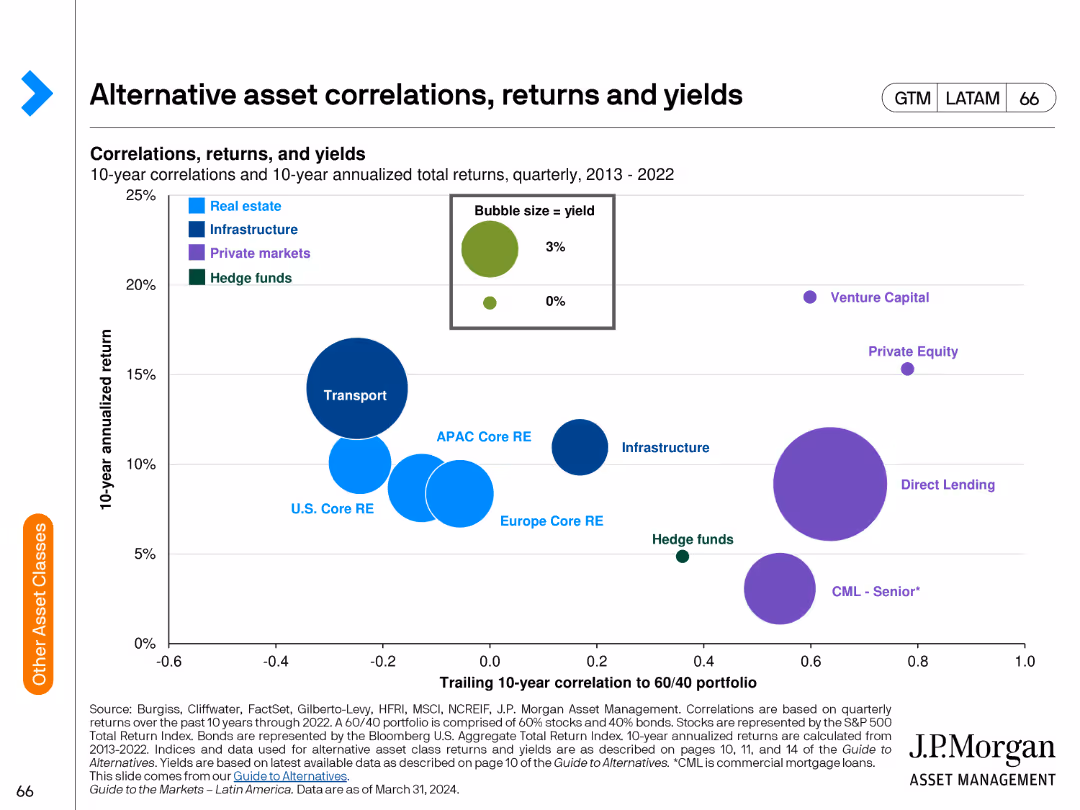
The slide includes a bubble chart showing correlations and returns of alternative assets over a 10-year period. Bubbles are color-coded by asset type.
Investment Analysis
Financial Services
The slide examines the correlations, returns, and yields of various alternative asset classes over a decade, used for evaluating investment strategies.
alternative assets, correlations, returns, yields, investment analysis, financial performance, risk assessment, asset comparison
Single Chart
JP Morgan
Saved
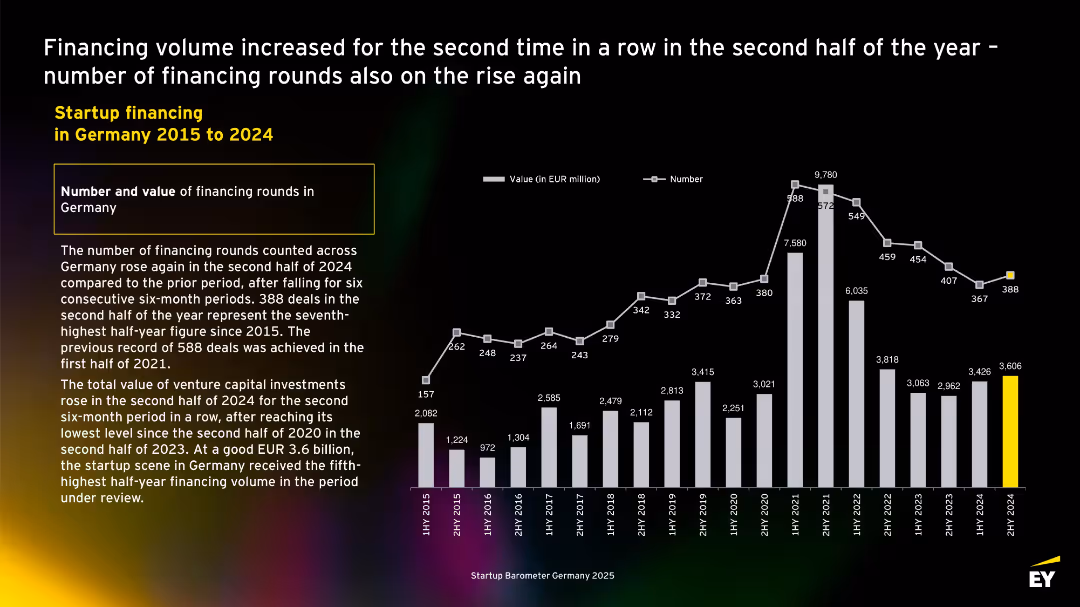
Dual-axis bar and line chart with semiannual VC data (2015–2024); left-aligned summary notes deal recovery and funding volume trends.
Investment Analysis
Financial Services
This slide presents semiannual VC trends in Germany. It highlights a funding recovery in 2H 2024, with €3.6B invested and 388 deals—the seventh-highest since 2015. The data show rebounding investor interest after prior declines.
semiannual trends, VC recovery, German startups, 2024 deals, financing volume, startup investment, historical comparison
Mixed Chart
EY
Saved
Includes a detailed diagram depicting how social responsibility intersects with economic, social, and biosphere aspects, linked to global sustainable development goals.
Regulatory and Compliance
Environmental Services & Sustainability
Explores the broad scope of social responsibility beyond environmental issues, linking to sustainable development goals across multiple sectors.
social responsibility, sustainability, economic impact, global goals, environmental, social development
Diagram
Bain
Saved
Slide includes detailed bar charts showing costs breakdown for FY 2023 and Q4, with annotations explaining key variances and effects.
Financial Performance
Financial Services
Analyzes adjusted costs for FY 2023 and Q4, emphasizing changes in compensation, IT, and professional services.
cost analysis, FY 2023, Q4 2023, financial management, expenses
Multiple Chart
Deutsche Bank
Saved
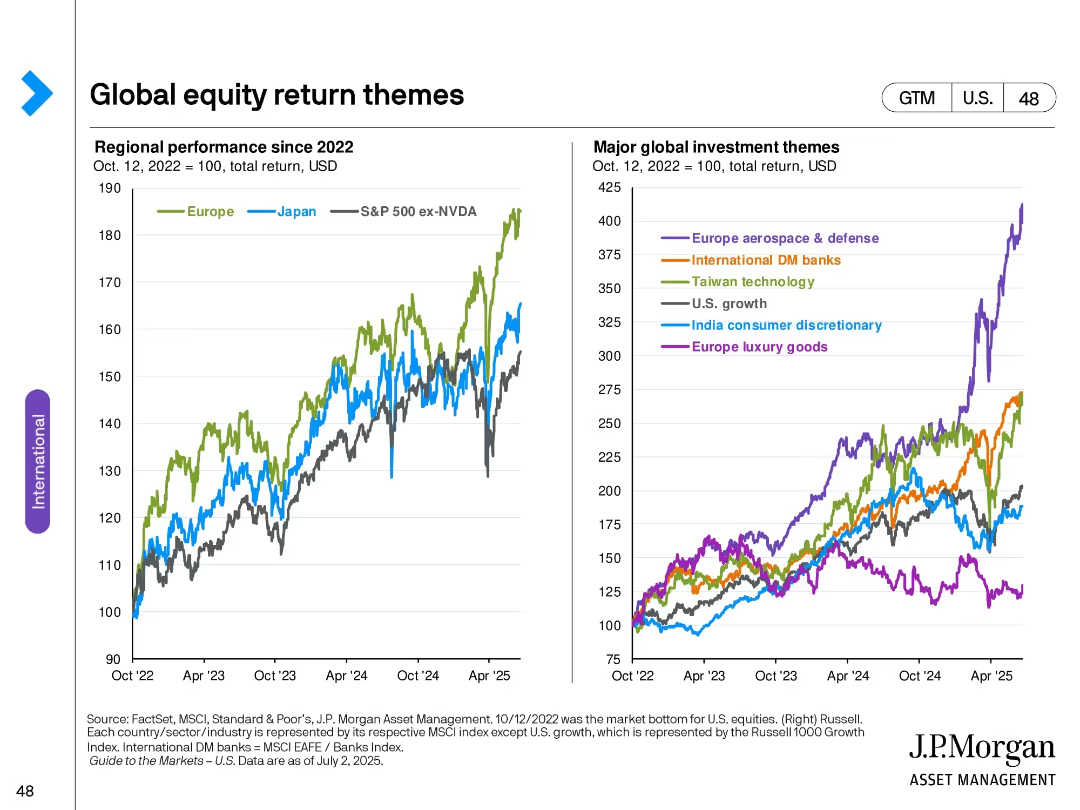
Two line charts: Left shows regional equity performance since 2022; Right shows specific sector/theme performance indexed to 100.
Market Analysis and Trends
Financial Services
Compares regional performance of equities post-2022 and highlights the most prominent global investment themes, including sectors such as aerospace & defense, technology, and luxury goods, with Europe and Japan emphasized.
equity themes, regional performance, sector trends, Europe, Japan, investment strategy, chart analysis, index tracking
Multiple Chart
JP Morgan
Saved
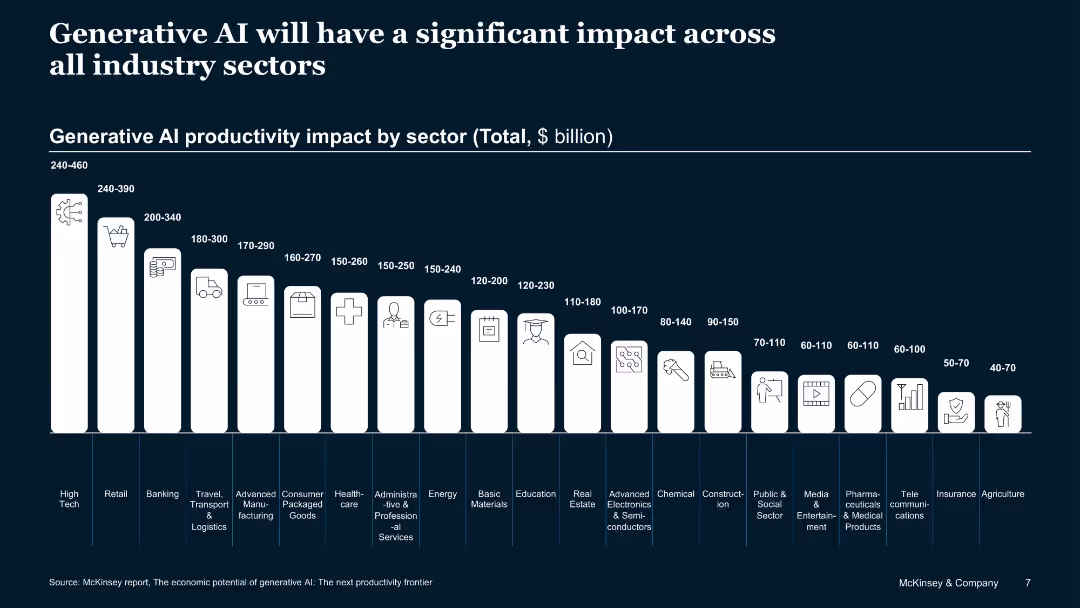
Dark-themed slide with vertical bars indicating productivity impact by industry; icon illustrations for each sector.
Market Analysis and Trends
Artificial Intelligence
This slide quantifies the economic productivity potential of generative AI across sectors such as High Tech, Retail, Banking, and more, predicting impacts ranging from $40B to $460B depending on the sector.
productivity, generative AI, sectors, economic impact, high tech, retail, healthcare
Single Chart
McKinsey
Saved
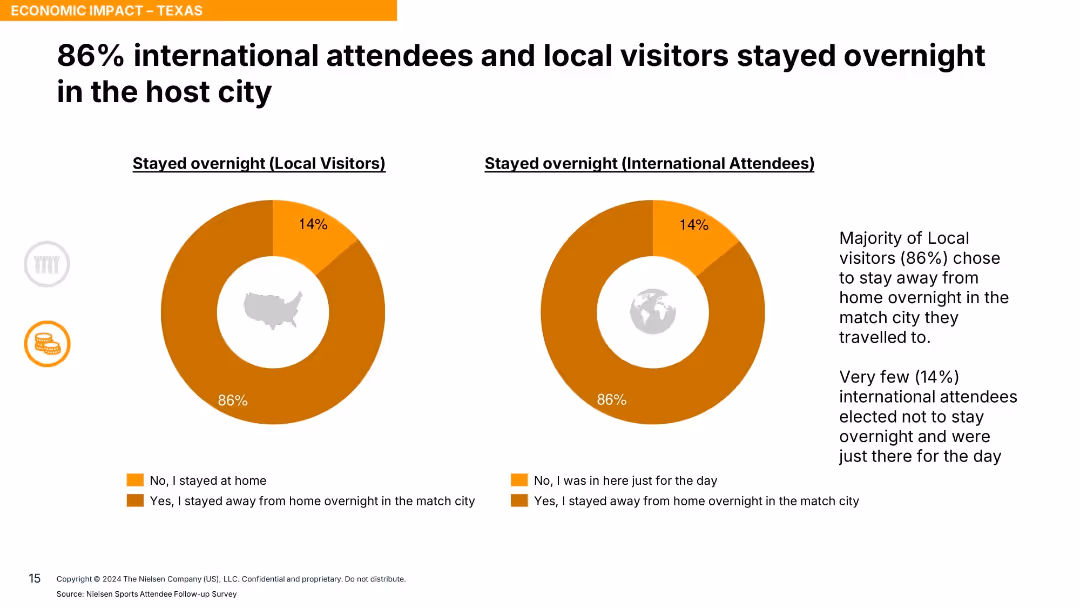
Two donut charts for local and international visitors with orange segments and supporting commentary on the right.
Market Analysis and Trends
Hospitality & Tourism
The slide reveals that 86% of both local and international attendees stayed overnight in the host city, indicating strong engagement and economic contribution through lodging.
overnight stays, lodging, event tourism, visitor behavior, accommodation, Texas, economic impact
Single Chart
Nielsen
Saved
Features column charts detailing reserve releases and underlying reserve volatility for casualty insurance.
Risk Assessment and Management
Financial Services
Details the volatility in reserve releases for casualty at Lloyd's, highlighting specific lines such as General Liability and Directors & Officers insurance, with a focus on significant reserve changes.
Casualty, Reserves, Insurance, Volatility, Changes
Multiple Chart
PwC/Strategy&
Saved
Bar charts detail investor attitudes towards company debt, focusing on leverage and interest coverage, including annotations for recent changes in investor focus.
Risk Assessment and Management
Financial Services
Provides insights into investor strategies regarding company debt, emphasizing the increasing importance of rollover risk and interest coverage, applicable in risk management strategies.
company debt, risk management, interest coverage, investor attitudes, leverage
Single Chart
BCG
Saved
The slide features a column chart showing compliance commitments closed over time and text describing engagement with regulators, key regulatory programs, and the strategic office.
Regulatory and Compliance
Financial Services
This slide outlines the roadmap to meet regulatory commitments, highlighting transparency, compliance progress, and oversight improvements with a visual representation of achievements.
regulatory, compliance, roadmap, transparency, oversight
Mixed Chart
Credit Suisse
Saved
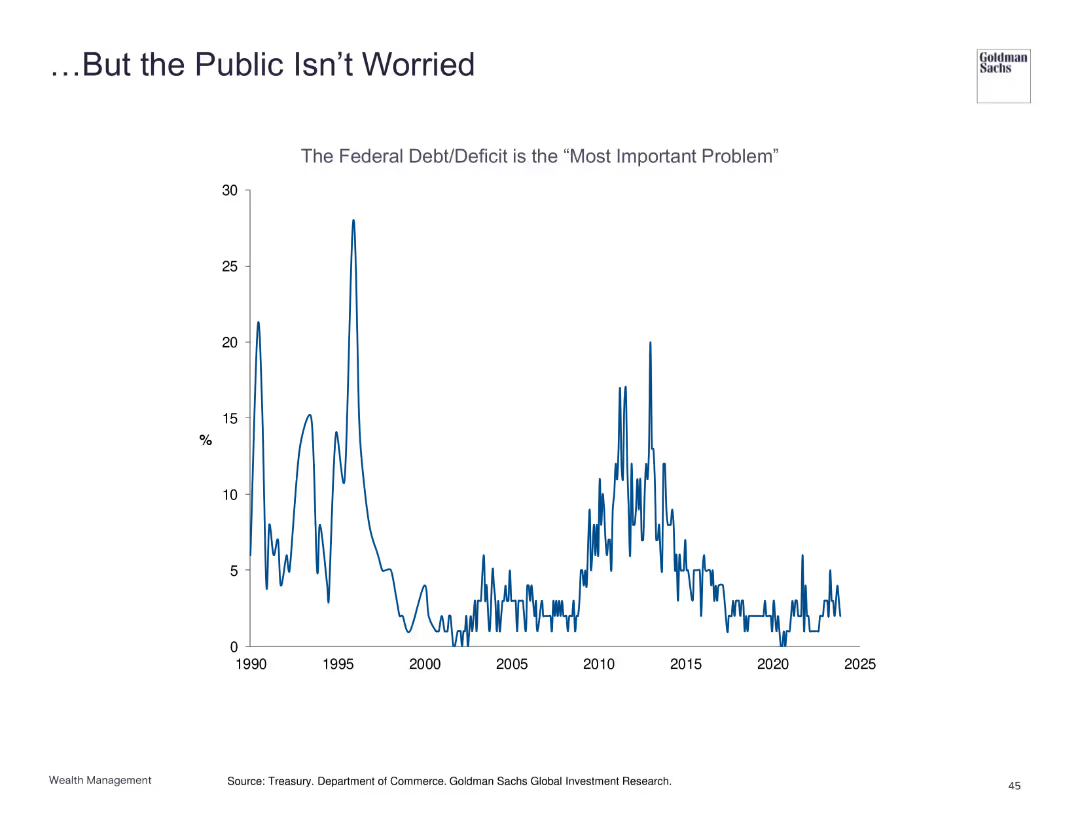
Line chart illustrating the public perception of federal debt/deficit as the "most important problem."
Market Analysis and Trends
Financial Services
Highlights the discrepancy between rising debt concerns and public worry levels, indicating low current public concern despite potential risks.
public perception, debt, deficit, concern
Single Chart
Goldman Sachs
Saved
Contains bar charts showing disparities between gender in workplace satisfaction and promotion rates.
Human Resources and Talent Management
Professional Services
Examines gender disparities in workplace outcomes, crucial for developing diversity and inclusion policies.
Gender Disparity, Workplace Equality, HR Practices, Diversity Policies, Inclusion Strategies
Single Chart
PwC/Strategy&
Saved
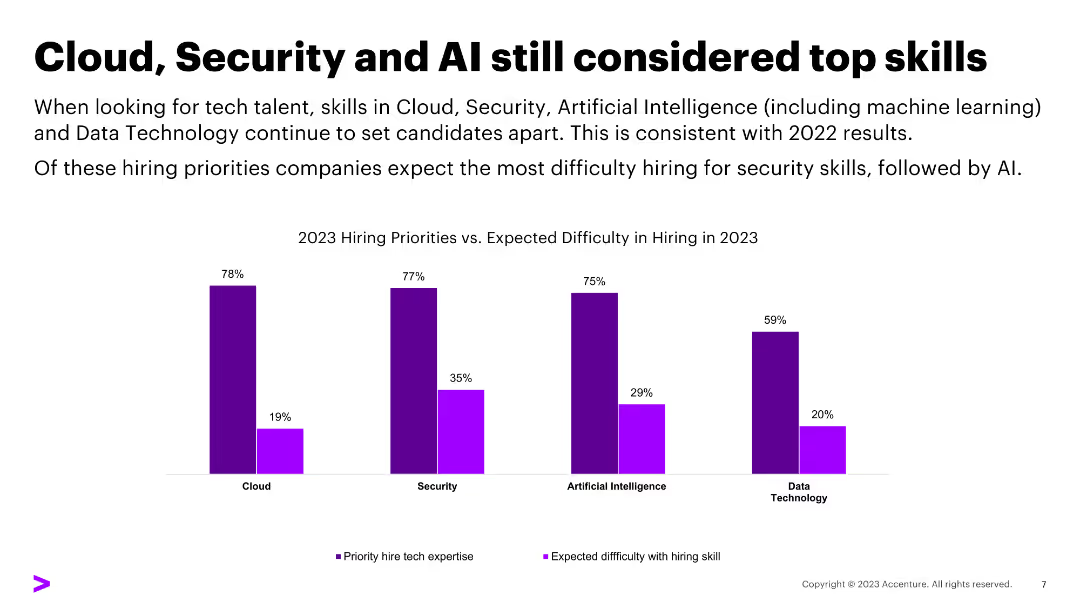
White background with purple text boxes listing factors for considering a platform strategy
Strategic Planning
Technology & Software
The slide provides a list of factors companies should consider when evaluating a platform strategy
Platform Strategy, Considerations, Industry Dynamics, Technology Capabilities, Ecosystem
Single Chart
Accenture
Saved
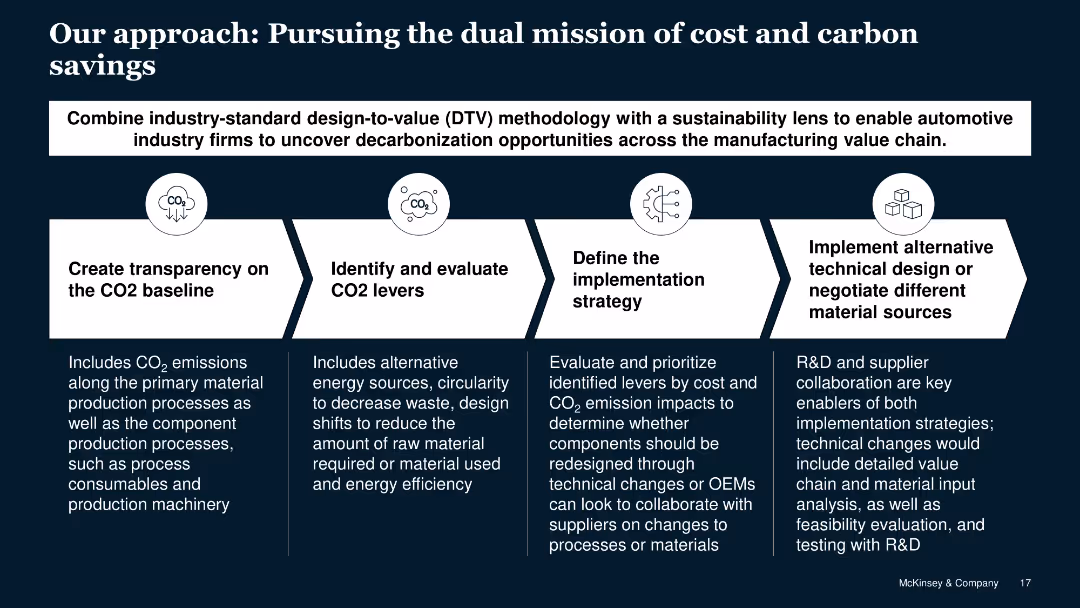
The slide has a dark blue background with white text and icons. It includes four sections with titles and descriptions, each illustrated with a simple icon representing CO2-related actions.
Strategic Planning
Industrial & Manufacturing
The slide outlines a four-step approach to decarbonization for automotive manufacturing. It emphasizes transparency, evaluating levers, implementation strategy, and alternative designs.
decarbonization, CO2, automotive, strategy, evaluation, implementation, transparency, design, manufacturing, cost savings
Linear Flow
McKinsey
Saved
This slide displays a combination of text blocks and data visualizations, including a growth multiplier and key investment areas. It's color-coded to distinguish between different technology focus areas.
Operational Efficiency
Technology & Software
It emphasizes the importance of leveraging technology for innovation, considering both existing and upcoming technological developments. This could aid in technology investment strategies.
Innovation, Technology, Investments, Digital Transformation, Deep Tech, Market Trends, Business Model, Development
Header Vertical
BCG
Saved
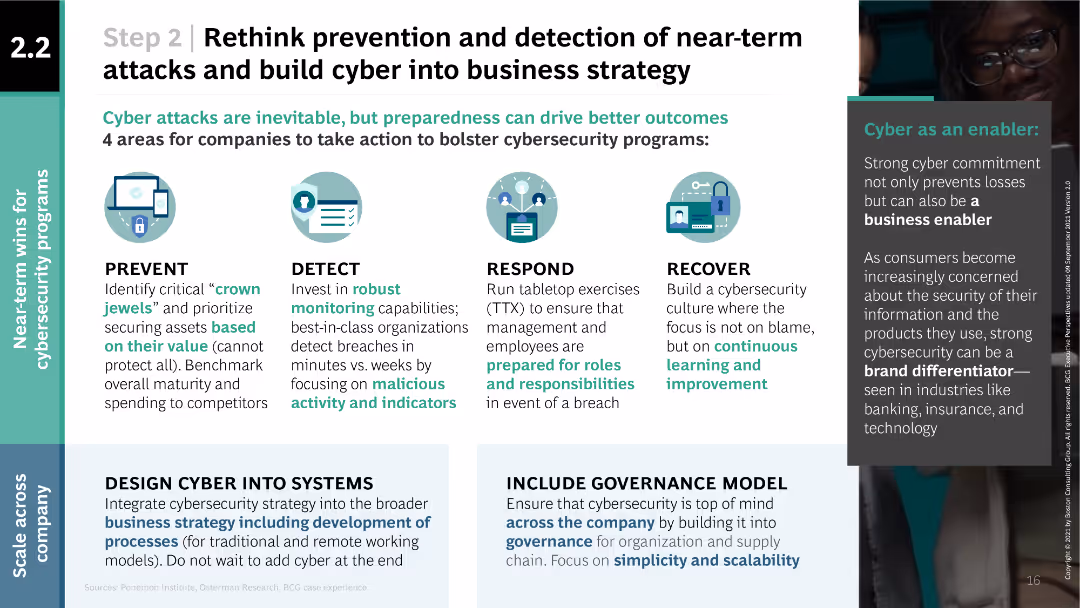
The slide uses a combination of text and icons in a multi-column layout. It features four main areas with icons representing prevent, detect, respond, and recover, with supporting text in each section. There is also a sidebar discussing the importance of cybersecurity.
Risk Assessment and Management
Technology & Software
The slide emphasizes the importance of integrating cybersecurity into business strategy by focusing on prevention, detection, response, and recovery. It highlights the steps companies should take to bolster their cybersecurity programs, mentioning specific actions and benefits.
cybersecurity, prevention, detection, response, recover
Linear Flow
BCG
Saved
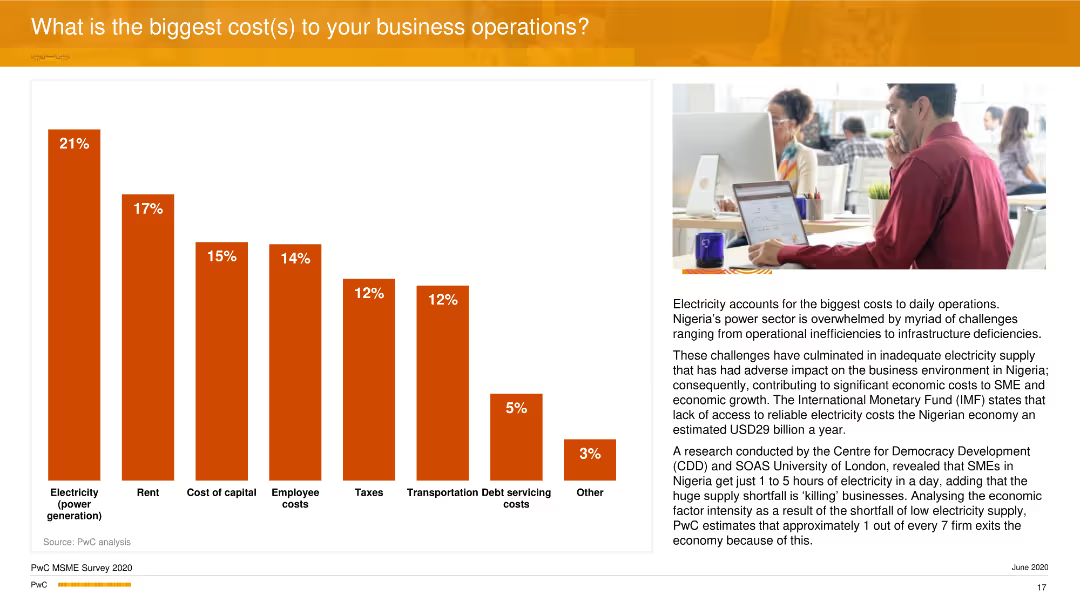
A vertical column chart shows different cost factors impacting business operations, with electricity being the highest. An image of a man working at a desk is on the right side.
Operational Efficiency
Financial Services
The slide outlines the major cost contributors to business operations, highlighting electricity, rent, and cost of capital as primary concerns. It emphasizes the economic impact of these costs on business efficiency in Nigeria.
Costs, Operations, Electricity, Business, PwC
Mixed Chart
PwC/Strategy&
Saved
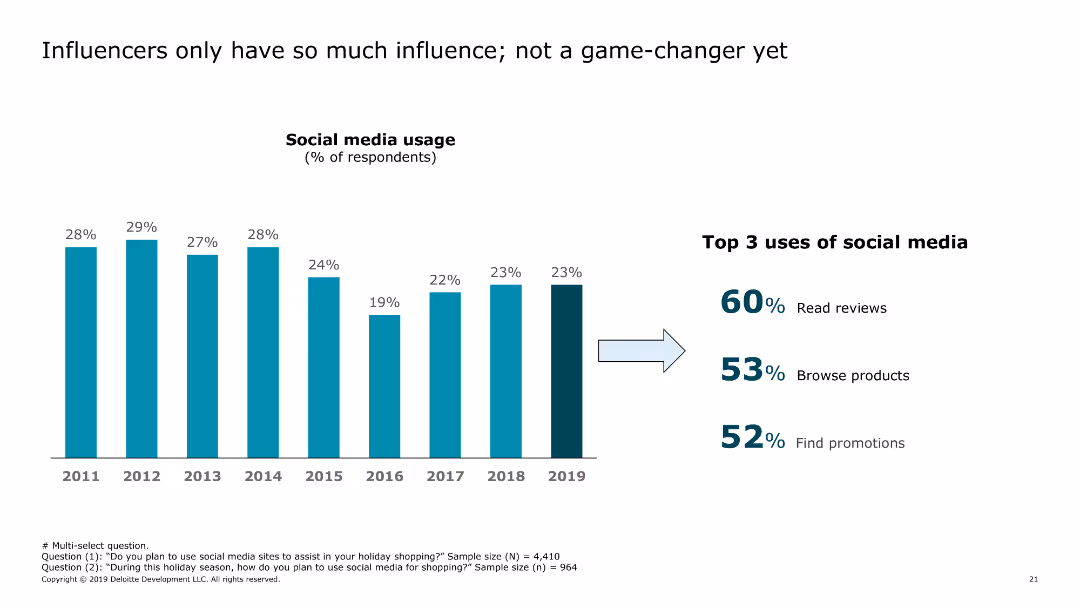
The slide includes a bar chart showing the percentage of respondents using social media for holiday shopping, with top uses listed beside the chart.
Market Analysis and Trends
Retail & E-commerce
The slide examines how consumers use social media during holiday shopping, focusing on reading reviews, browsing products, and finding promotions.
social media, holiday shopping, consumer behavior, retail, e-commerce, trends, 2019, social media usage, promotions, reviews
Single Chart
Deloitte
Saved
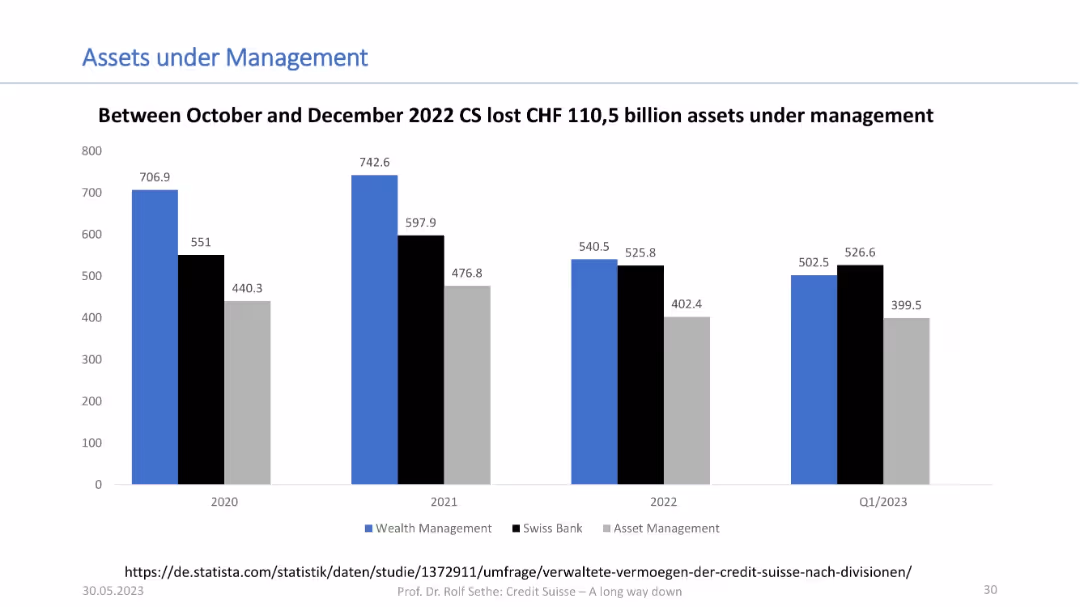
Bar chart comparing Wealth Management, Swiss Bank, and Asset Management from 2020 to Q1 2023; uses blue, black, and grey color scheme.
Financial Performance
Financial Services
This slide shows how Credit Suisse’s assets under management declined significantly between 2022 and Q1 2023, highlighting a CHF 110.5 billion drop following the October–December 2022 period. Values are broken down by business unit.
asset management, financial decline, Credit Suisse, portfolio, AUM
Single Chart
Credit Suisse
Saved
The slide includes a column chart depicting different sources of crypto asset advertising in 2022 and 2023, with percentages and age group breakdowns.
Market Analysis and Trends
Media & Entertainment
It analyzes where people see crypto advertisements, such as social media, online ads, and traditional media, noting a significant decrease in overall awareness from 2022 to 2023.
Crypto ads, advertising sources, 2023, 2022, social media, online ads, traditional media, awareness, age groups
Multiple Chart
IPSOS
Saved
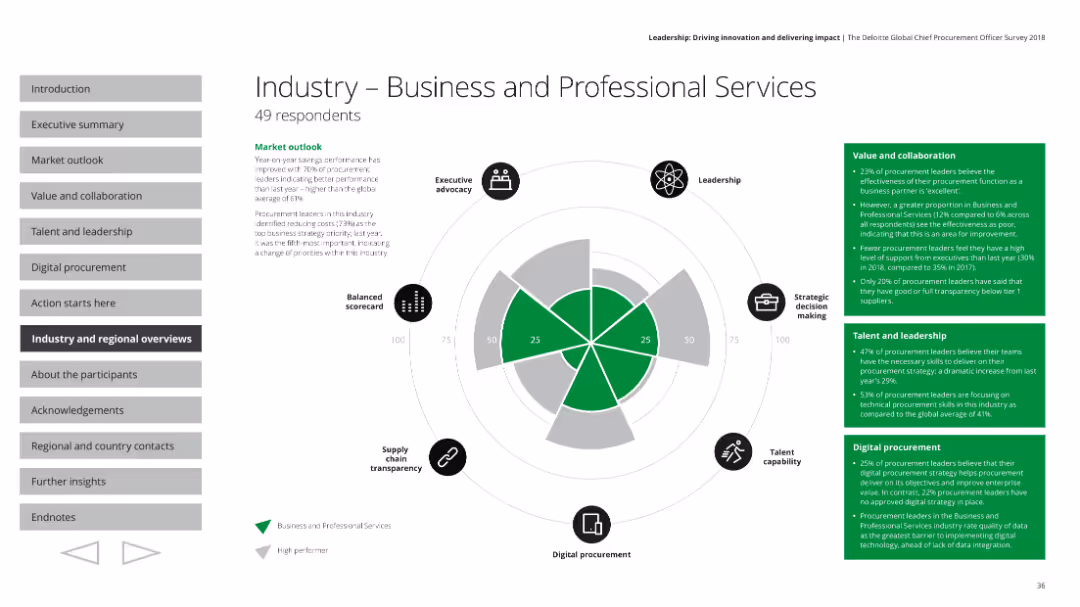
Includes a radar chart and text blocks summarizing key performance areas like market outlook, value and collaboration, and leadership in the industry.
Industry Overview
Professional Services
Provides an overview of the business and professional services industry, detailing performance metrics, strategic priorities, and leadership challenges.
Industry overview, performance, strategy, leadership
Mixed Chart
Deloitte
Saved
The slide features text and a column chart showing the most frequently returned product categories, including womenswear, shoes, menswear, and children/kids.
Market Analysis and Trends
Retail & E-commerce
Delivers insights from a survey on returns behavior, showing which product categories are most frequently returned, with a focus on demographic differences.
Survey findings, Returns, Product categories, Womenswear, Shoes
Mixed Chart
Roland Berger
Saved
Previous
Next
If nothing, comes up, please save your slides first
Create a FREE account to continue browsing
Receive Instant Access to 1,000+ slides from companies like McKinsey, Google, and Goldman Sachs
First Name
Last Name
Email
Password
I agree to all
Terms & Privacy Policy
Thank you! Your submission has been received!
Oops! Something went wrong while submitting the form.
Have an account?
Sign in
Column Chart
Heatmap
Chevron
Org Chart
Infographic
Callouts
Timeline
List
Graphic
Picture
Process Flow
Diagram
Paragraph
Map
Table
Framework
Subtitle
Takeaway Box
Icon
Other Chart
Radar Chart
Waterfall Chart
Mekko Chart
Pie Chart
Scatter Plot
Line Chart
Bar chart
Bullet points