My Account
My Slides
Search by Category
Templates
Leave Feedback
Login
Logout
Get Started
Browse all Slides
Browse all Slides
Create a FREE Account
Instant access to 1,000+ real slides from top companies like McKinsey, BCG, Goldman Sachs, Google and many more!
First Name
Last Name
Email
Password
I agree to all
Terms & Privacy Policy
Thank you! Your submission has been received!
Oops! Something went wrong while submitting the form.
Have an account?
Sign in
Saved Slides
The slide includes three sections comparing road transport, coastal shipping, and domestic port costs, with bullet points summarizing key findings for each.
Market Analysis and Trends
Transportation & Logistics
It compares the costs of road freight, coastal shipping, and port services in Australia, highlighting road freight as a supply chain priority.
Road freight, coastal shipping, port, costs, benchmarking, transport, supply chain, Australia, comparators
Pillar
LEK
Saved
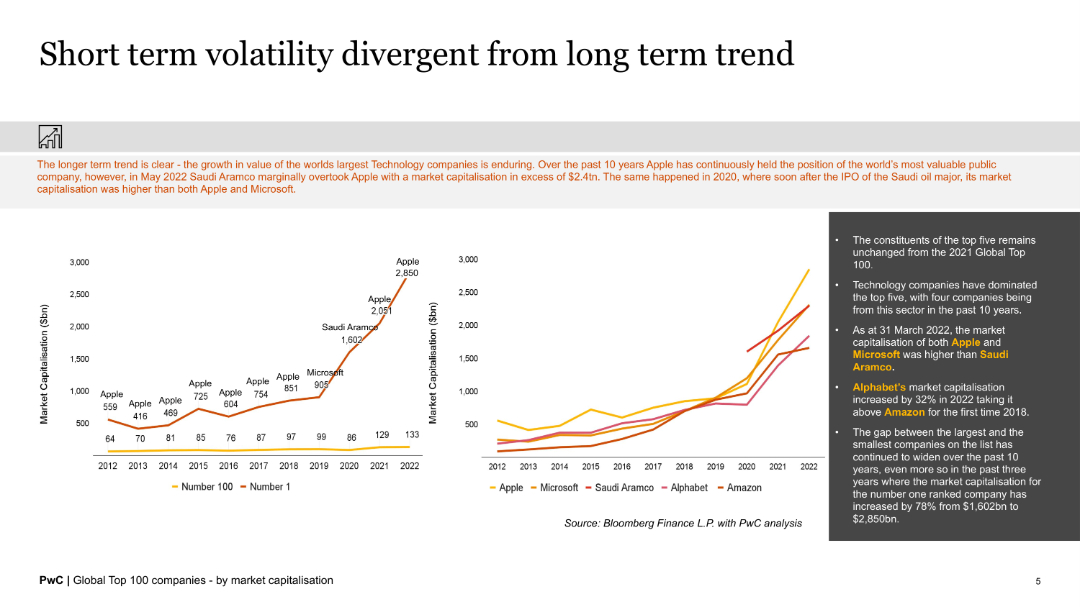
The slide includes line charts and text, showing market capitalization trends of top technology companies and volatility over time.
Market Analysis and Trends
Financial Services
The slide analyzes the market capitalization trends of the largest technology companies, highlighting short-term volatility against long-term growth trends.
market capitalization, technology companies, volatility, trends, analysis, growth
Multiple Chart
PwC/Strategy&
Saved
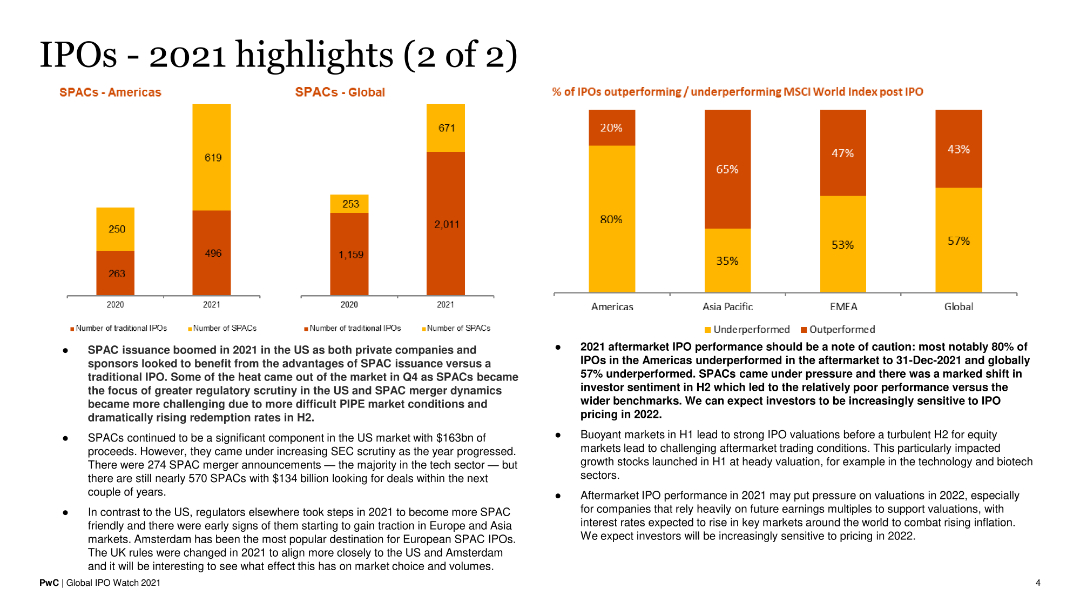
Features bar charts comparing SPAC and traditional IPOs in the Americas and globally. Also includes a bar chart for IPO performance post-IPO. The design is data-heavy.
Financial Performance
Financial Services
This slide focuses on SPAC issuance trends and IPO performance in 2021, discussing underperformance and investor sentiment shifts in the latter half of the year.
SPAC Issuance, IPO Performance, Investor Sentiment, 2021 Trends, Financial Analysis
Multiple Chart
PwC/Strategy&
Saved
Includes bar charts showing investor sentiment and economic optimism by region.
Market Analysis and Trends
Financial Services
Presents findings from the UBS Investor Sentiment Survey, showing a drop in short-term optimism but long-term positivity.
investor sentiment, economic optimism, survey, long-term positivity, short-term drop
Multiple Chart
UBS
Saved
The slide includes two column charts showing total average loan balance and total average deposits over three quarters, along with text highlights on balance sheet management.
Financial Performance
Financial Services
The slide provides an overview of the balance sheet, focusing on effective management of loans and deposits, highlighting the trends in average balances and deposit growth.
Balance, Sheet, Loans, Deposits, Management, Growth
Multiple Chart
Barclays
Saved
Moderate visual complexity, the slide displays a matrix linking key industry sectors with specific automation applications that address the megatrends discussed earlier. It includes icons and a clear layout to illustrate these connections.
Technology and Digital Transformation
Industrial & Manufacturing
The slide delves into how new process automation applications are being deployed across various industry sectors in response to overarching megatrends. It explores specific examples within sectors, providing insights into the operational applications of these technologies.
Industry applications, Process automation, Sector-specific, Deployment
Table
LEK
Saved
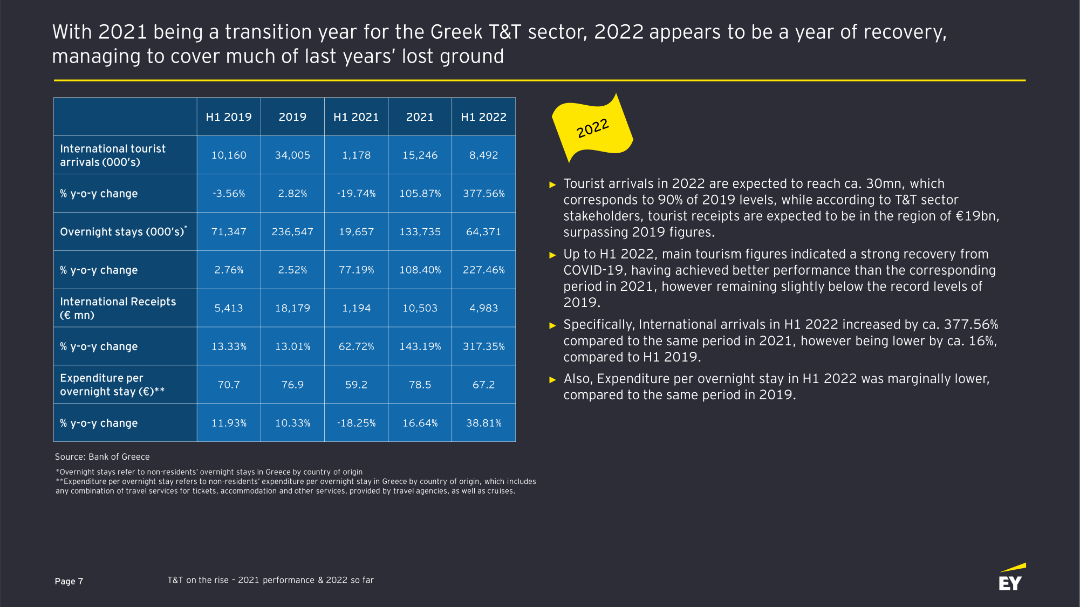
The slide includes a table comparing various metrics for international tourist arrivals, overnight stays, and receipts from 2019 to H1 2022. On the right, key highlights are listed in bullet points.
Financial Performance
Hospitality & Tourism
This slide provides a detailed comparison of the Greek tourism sector's performance metrics across different periods, highlighting recovery and trends.
Greek tourism, performance metrics, financial performance, sector analysis, tourism recovery
Table
EY
Saved
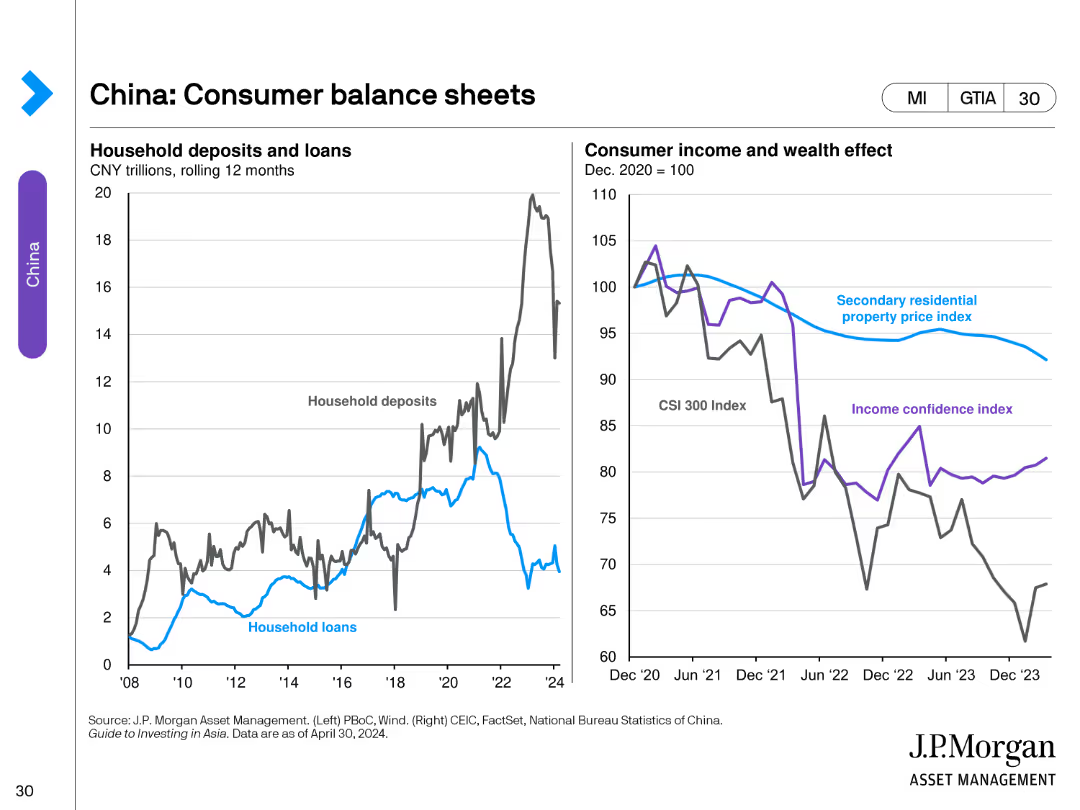
The slide features two line charts. The left chart depicts household deposits and loans in trillions of CNY. The right chart shows consumer income and wealth effect, including indexes like secondary property price and income confidence.
Financial Performance
Financial Services
This slide reviews the financial status of Chinese consumers, showing trends in household deposits and loans and examining the effect on consumer income and wealth.
Financial, Deposits, Loans, Wealth, Income
Multiple Chart
JP Morgan
Saved
Features multiple column charts comparing the percentage of companies undertaking various eco-friendly marketing actions over three years.
Market Analysis and Trends
Environmental Services & Sustainability
Discusses trends in companies' eco-friendly marketing practices over time, highlighting a decrease in environmentally focused actions.
environmental impact, marketing trends, sustainability, business strategy, ecological concerns
Single Chart
Deloitte
Saved
The slide presents two sections with distinct visual elements. On the left, three line graphs compare long-term trends in 'Energy vs. alternative energy,' depicted with various colors to signify each index. On the right, a column chart shows 'Immediate income to buy on a dip' with implied volatility values for different market themes including 'Greening the World' and 'Digitization.' The design is clear and uses a muted color palette to differentiate between the different datasets.
Market Analysis and Trends
Energy & Utilities
This slide reflects on the volatility of long-term economic trends, particularly in energy, as they underwent mean reversion in 2021. It examines the relative performance of traditional and alternative energy indices, then switches focus to the cost of options for securing immediate income during market dips across several domains, suggesting investment opportunities during periods of volatility. The juxtaposition of energy trends and option pricing provides a narrative on the impact of economic forces and market sentiment.
economic trends, mean reversion, energy, alternative energy, implied volatility, market dips, investment opportunities
Multiple Chart
Citigroup
Saved
The slide shows a column chart comparing the share of climate tech funding events over $50M in various countries. It features text on the left discussing the challenges Canadian startups face in securing later-stage funding.
Investment Analysis
Financial Services
Examines Canada’s challenges in securing late-stage funding for climate tech startups, comparing funding events in other countries and discussing the implications for Canadian startups.
Funding, Climate tech, Canada, Investment, Chart
Mixed Chart
BCG
Saved
Several bar charts divided by employee number, revenue, and sector, displaying current and future AI utilization percentages.
Technology and Digital Transformation
Technology & Software
Details AI utilization across different company sizes and sectors, predicting significant increases in usage within the next three years.
AI, industry sectors, automation, future trends, machine learning
Multiple Chart
Deloitte
Saved
This visually appealing slide features an image of three individuals using a tablet, symbolizing the collaborative and innovative approach required in the telecommunications industry. The caption underscores the urgency of adopting advanced technologies to remain competitive.
Technology and Digital Transformation
Telecommunications
The slide conveys the critical nature of technological adoption in the telecommunications sector. It highlights how continuous innovation and collaborative efforts are vital for adapting to market changes and improving business targets such as revenue growth and operational efficiency. This presentation is ideal for discussions on the strategic importance of technology in sustaining industry competitiveness.
telecommunications, technology adoption, innovation, competitive, collaboration, market adaptation
Mixed Chart
Accenture
Saved
This slide shows a combination of icons, text, and colored sections to illustrate risk management principles and the 'three lines of defence' model.
Risk Assessment and Management
Financial Services
It depicts Macquarie's risk management strategy, emphasizing accountability and the consistent application of core principles and frameworks, relevant for corporate governance and risk management education.
risk management, accountability, principles, three lines of defence, corporate governance
Header Horizontal
Goldman Sachs
Saved
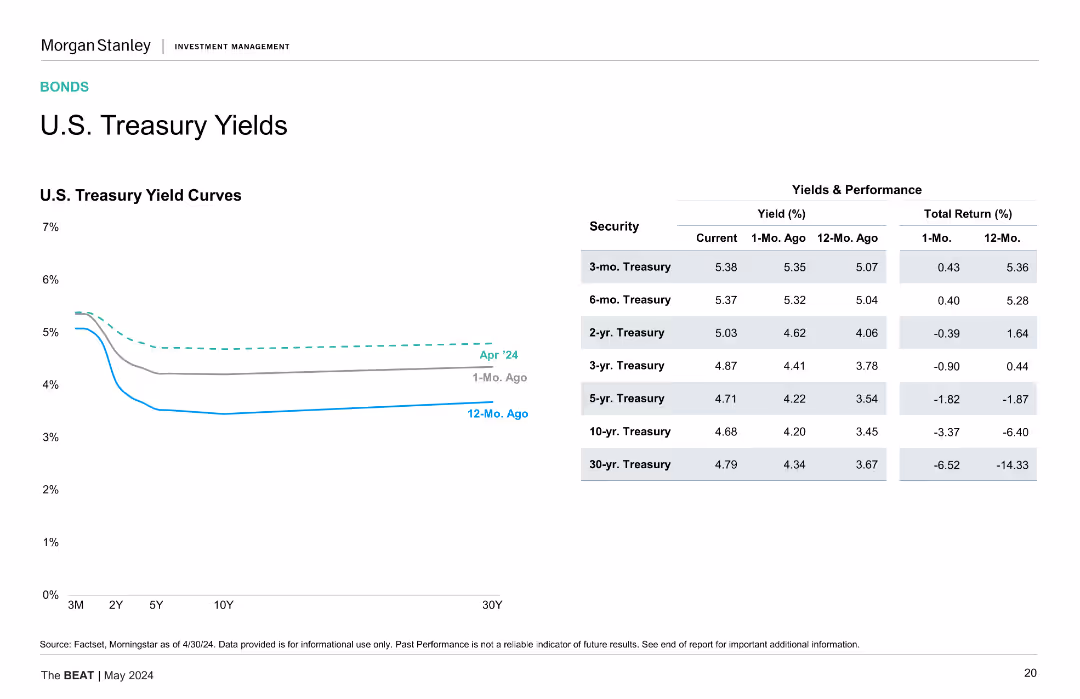
Contains a line chart on the left showing the U.S. Treasury yield curves for April 2024, one month ago, and twelve months ago, and a table on the right comparing yields and total returns for various Treasury securities over the same periods.
Market Analysis and Trends
Financial Services
The slide analyzes the changes in U.S. Treasury yields over the past year, providing insights into yield curves and total returns for different Treasury maturities.
U.S. Treasury, Yields, Yield Curve, Total Return, Financial Analysis, Treasury Securities
Mixed Chart
Morgan Stanley
Saved
A column chart comparing 2021 and 2022 survey results on emissions measurement practices. Shows percentages of companies performing partial and comprehensive measurements of internal and external emissions.
Risk Assessment and Management
Environmental Services & Sustainability
Discusses the challenges and slow progress in improving emissions measurement accuracy and comprehensiveness. Highlights the need for better measurement practices to enhance emissions management.
emissions measurement, challenges, survey comparison, partial, comprehensive
Mixed Chart
BCG
Saved
Light background with green accents, multiple bar charts comparing cyber maturity levels and their impact on business, with explanatory text in columns.
Strategic Planning
Technology & Software
The slide explains how different levels of cyber maturity affect business outcomes, with examples of cyber planning strategies and activities from high-maturity organizations.
Cyber maturity, business impact, planning strategies, survey, bar charts
Mixed Chart
Gartner
Saved
The slide is divided into two sections: one with text bullet points and the other with a graphical representation of metrics, using a cohesive blue and white theme.
Financial Performance
Financial Services
Provides an analysis of the investment banking sector, with metrics such as wallet share, client footprint, and market rankings. It measures the company's progress and success in investment banking.
investment banking, wallet share, client footprint, market ranking, metrics
Text Only
Goldman Sachs
Saved
The slide includes a line graph tracking investor sentiment over time. It contrasts views on the stock market and the economy, with textual annotations explaining key trends and dates.
Market Analysis and Trends
Financial Services
Analyzes investor sentiment shifts regarding the stock market and economy, noting particularly low bullishness. Useful for market trend analysis and investment strategy planning.
Investor Sentiment, Bearish Trends, Bullish Sentiment, Stock Market, Economy, Market Analysis, Investment Strategy, Trend Tracking, Economic Outlook, Sentiment Change
Single Chart
BCG
Saved
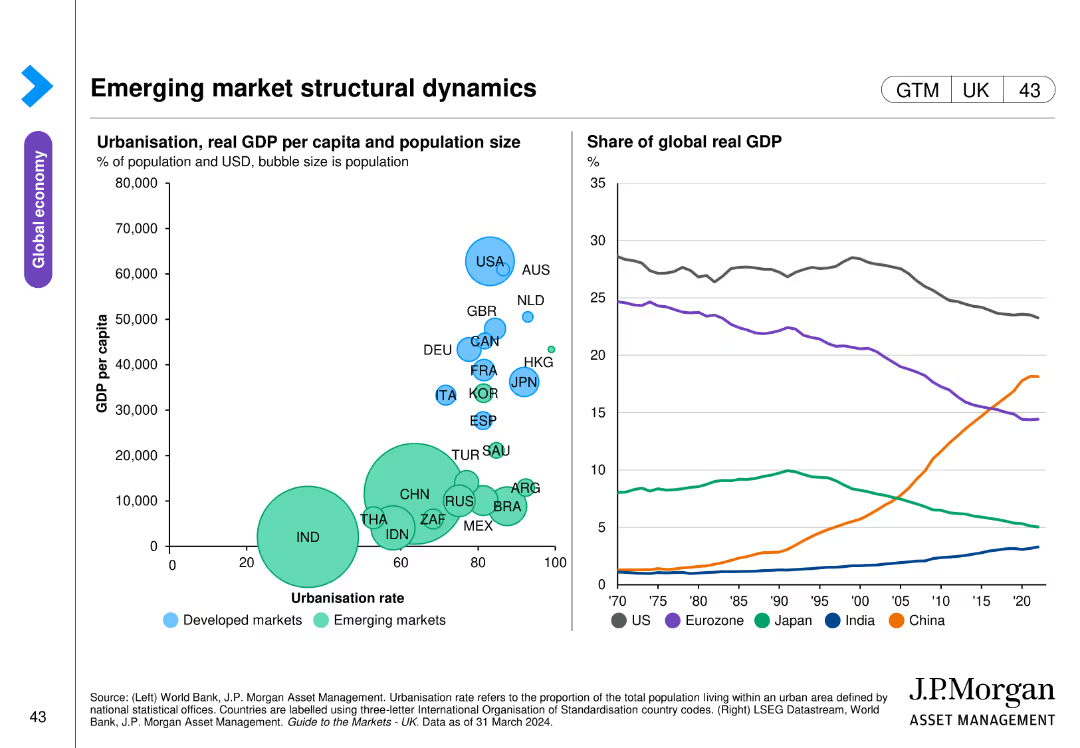
Two charts: a bubble chart comparing urbanization rate with GDP per capita across countries, and a line chart showing the share of global real GDP over time by region.
Market Analysis and Trends
Financial Services
This slide explores the structural dynamics of emerging markets, with a focus on urbanization, GDP per capita, and regional contributions to global GDP. Used for economic analysis and strategic planning in emerging markets.
Emerging markets, GDP, urbanization, global
Multiple Chart
JP Morgan
Saved
Four-column layout describing possible future applications of AI by 2030, 2035, 2040, and 2050 in areas like healthcare, trust and governance, sustainable business, and service innovation.
Technology and Digital Transformation
Technology & Software
The slide explores the transformative potential of AI across various sectors, outlining future applications from 2030 to 2050. It discusses the impact of AI on healthcare, trust and governance, sustainable business practices, and service innovation, emphasizing how AI could fundamentally change these areas.
AI, Future Applications, Healthcare, Governance
Linear Flow
Roland Berger
Saved
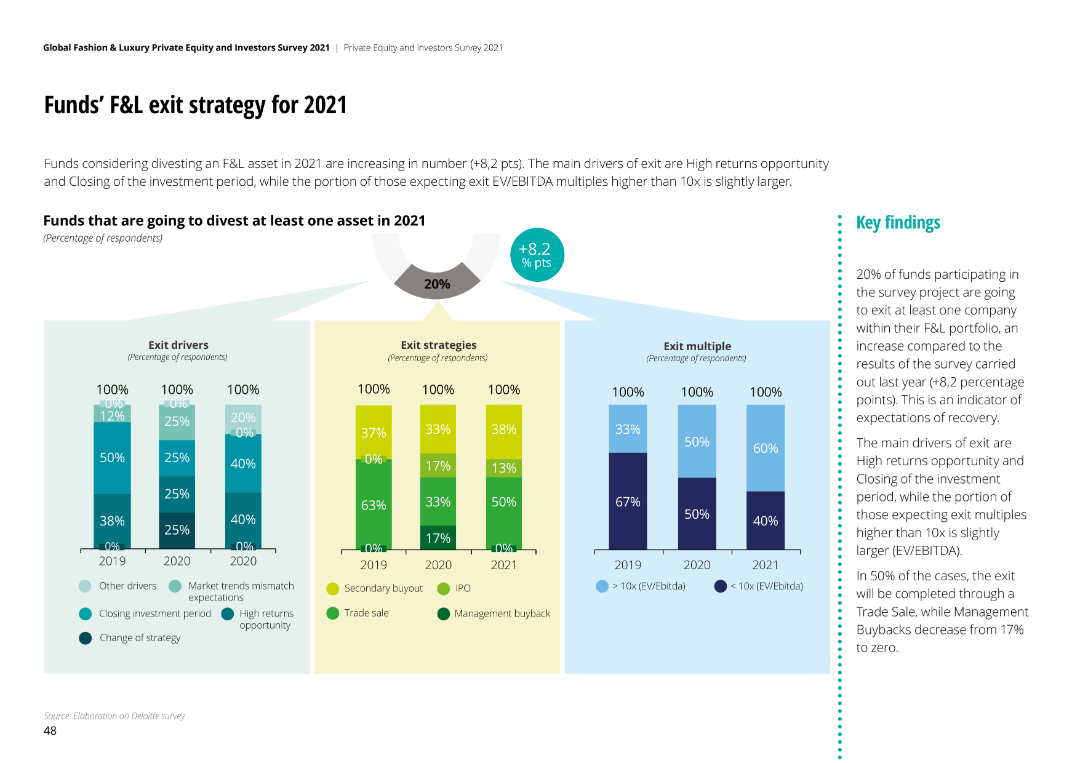
The slide contains multiple column charts showing exit drivers, strategies, and multiples for funds divesting F&L assets. Key findings are presented.
Mergers and Acquisitions
Financial Services
The slide provides insights into exit strategies for funds in F&L for 2021, covering drivers, strategies, and expected multiples.
exit strategy, F&L, funds, divestment, analysis
Multiple Chart
Deloitte
Saved
Features a pie chart depicting the C&I portfolio by industry and a line chart comparing the C&I net charge-off rate against the industry average, along with commentary on market conditions.
Risk Assessment and Management
Financial Services
Evaluates the C&I loan portfolio's risk discipline, focusing on diversified industry spread and underwriting quality, paired with market trend observations and net charge-off rates.
C&I, loan portfolio, risk management, JPMC, industry diversification, charge-off rates, market trends, underwriting quality
Multiple Chart
JP Morgan
Saved
Mixed layout with text, bullet points, and bar charts, highlighting recent achievements and sustainable finance volumes.
Regulatory and Compliance
Environmental Services & Sustainability
Summarizes recent achievements in sustainability initiatives, including policies, commitments, and reported volumes in sustainable finance.
sustainability, finance, achievements, policies, commitments, volumes
Mixed Chart
Deutsche Bank
Saved
Features a central circular graphic, with color coding to differentiate segments. The design is clear and emphasizes market share growth and key metrics, with distinct sections for clarity.
Strategic Planning
Financial Services
The slide illustrates Goldman Sachs’ market share growth and key growth initiatives within their client franchise. It is useful for strategic presentations or investor relations, showcasing performance and outlining strategic goals.
client franchise, market share, growth, Goldman Sachs, investment banking, global markets
Framework
Goldman Sachs
Saved
Previous
Next
If nothing, comes up, please save your slides first
Create a FREE account to continue browsing
Receive Instant Access to 1,000+ slides from companies like McKinsey, Google, and Goldman Sachs
First Name
Last Name
Email
Password
I agree to all
Terms & Privacy Policy
Thank you! Your submission has been received!
Oops! Something went wrong while submitting the form.
Have an account?
Sign in
Column Chart
Heatmap
Chevron
Org Chart
Infographic
Callouts
Timeline
List
Graphic
Picture
Process Flow
Diagram
Paragraph
Map
Table
Framework
Subtitle
Takeaway Box
Icon
Other Chart
Radar Chart
Waterfall Chart
Mekko Chart
Pie Chart
Scatter Plot
Line Chart
Bar chart
Bullet points