My Account
My Slides
Search by Category
Templates
Leave Feedback
Login
Logout
Get Started
Browse all Slides
Browse all Slides
Create a FREE Account
Instant access to 1,000+ real slides from top companies like McKinsey, BCG, Goldman Sachs, Google and many more!
First Name
Last Name
Email
Password
I agree to all
Terms & Privacy Policy
Thank you! Your submission has been received!
Oops! Something went wrong while submitting the form.
Have an account?
Sign in
Saved Slides
This slide features a column chart showing NPL sales volume from 2010 to 2023 with historical and projected values. It uses different colors to represent various growth scenarios.
Market Analysis and Trends
Financial Services
This slide projects the expected growth in NPL sales volumes in Turkey from 2010 to 2023, highlighting historical growth rates and various future scenarios based on economic conditions.
NPL, growth, Turkey, projections, economic scenarios
Mixed Chart
PwC/Strategy&
Saved
This slide displays line graphs comparing consumer confidence indexes in the U.S. and EU. The design is straightforward with clear, easy-to-read graphs and a consistent color scheme.
Market Analysis and Trends
Financial Services
Examines consumer confidence trends in the U.S. and EU, providing insights into consumer sentiment and potential economic implications. Useful for market analysis and predicting consumer spending behaviors.
Consumer Confidence, US, EU, Economic Analysis, Sentiment
Multiple Chart
Deutsche Bank
Saved
The slide contains a column chart highlighting the importance of various factors in investment decisions, such as economic context, legal certainty, and social climate, with rankings from 2019 to 2021.
Market Analysis and Trends
Media & Entertainment
This slide presents the key factors influencing investment decisions in France, with economic context and legal certainty being top priorities.
Investment criteria, Economic context, Legal certainty, Social climate, Workforce
Single Chart
Bain
Saved
Includes two bar charts detailing the share of podcast advertising revenue by placement (pre-roll, mid-roll, post-roll) from 2019 to 2020.
Market Analysis and Trends
Media & Entertainment
Discusses revenue distribution by ad placement in podcasts, with mid-roll placements remaining predominant.
podcast advertising, ad placements, mid-roll, revenue share, 2019-2020
Single Chart
PwC/Strategy&
Saved
This slide combines a summary of loan portfolio characteristics with a line chart depicting net charge-off performance trends, focusing on commercial real estate. It's structured for easy interpretation of data and text.
Risk Assessment and Management
Financial Services
Discusses risk management strategies and performance within JPMorgan's commercial real estate lending, emphasizing stability and quality in lending practices.
risk management, CRE, loan security, real estate, market analysis, non-bank competition, investment quality
Mixed Chart
JP Morgan
Saved
This slide is populated with financial tables, bullet points, and column charts detailing the fiscal performance of legacy franchises. The layout is clean, focusing on presenting data in a comprehensible manner, with particular attention to year-over-year changes.
Financial Performance
Financial Services
The slide covers the financial outcomes of legacy franchises, showcasing revenues, expenses, and net income, among other metrics. It's tailored for financial analysis, investor reporting, and strategic planning, giving insights into the profitability and operational status of traditional business segments.
Legacy Franchises, Financial Outcomes, Revenue, Expenses, Net Income
Mixed Chart
Citigroup
Saved
A bar chart comparing Millennials and Gen Z on financial responsibility, with various metrics such as budgeting, knowledge level, and financial goals.
Financial Performance
Financial Services
The slide highlights the financial responsibility of Millennials and Gen Z, comparing their budgeting habits, knowledge, and financial goal setting.
Financial responsibility, Millennials, Gen Z, budgeting, financial knowledge, financial goals, comparison, financial habits
Mixed Chart
Deloitte
Saved
The slide has a detailed text on the left discussing CFO responsibilities and a vertical column chart on the right showing actions taken to streamline finance operations.
Human Resources and Talent Management
Professional Services
This slide outlines the steps CFOs have taken to improve finance operations, focusing on digital transformation, ERP implementation, and process improvements to better manage workforce changes and innovations.
talent, leadership, workforce, innovation, CFO, digital transformation, ERP, process improvement, finance operations
Mixed Chart
Deloitte
Saved
A comparative slide with a table layout, categorizing consumers into six groups by age and spending. It uses various shades of blue and gray for highlighting data points.
Customer and Market Segmentation
Consumer Goods
The slide categorizes consumers into six segments based on age and spending, highlighting their proportions and spending growth for 2020.
Consumer Segments, Age Groups, Spending Patterns, Growth, Segmentation
Table
BCG
Saved
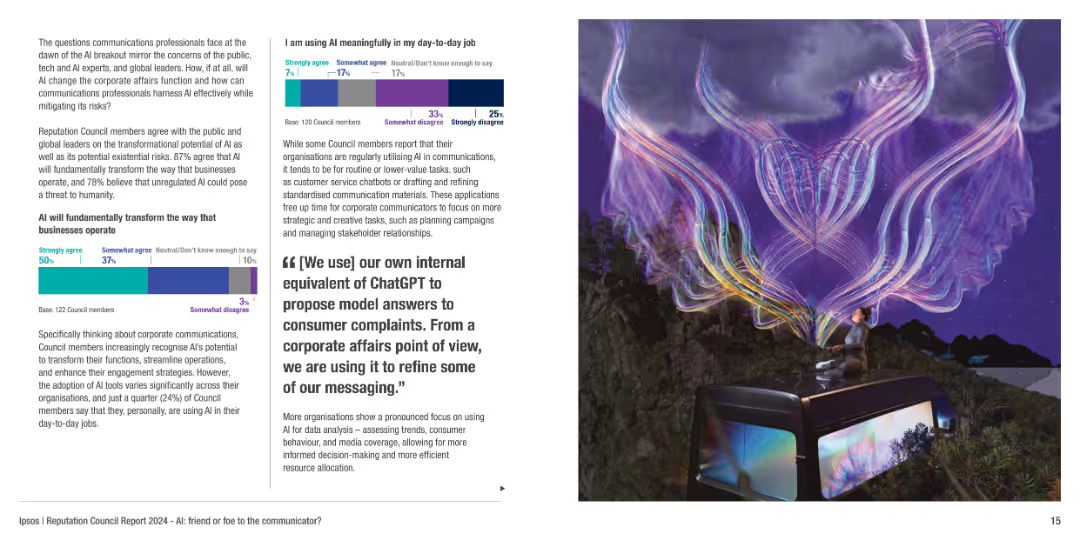
The slide includes a mixture of text, column charts, and a visually striking image depicting AI's impact on communication.
Technology and Digital Transformation
Technology & Software
Discusses the transformative potential of AI in corporate communications, its risks, and how organizations are adapting AI tools for efficiency and engagement.
AI, communication, technology impact, digital transformation, risks
Multiple Chart
IPSOS
Saved
Column chart showing potential layoffs percentages due to COVID-19, with varying probabilities. The slide uses a soft blue floral background, adding a visual contrast to the stark data presented.
Human Resources and Talent Management
Professional Services
Discusses the uncertainty and potential for layoffs due to COVID-19, making it relevant for discussions in HR and strategic business planning sessions.
COVID-19, layoffs, business impact, uncertainty
Single Chart
McKinsey
Saved
Line chart showing projected value generation for digital champions versus laggards, with bullet points listing key areas where tech and digital can increase business value.
Strategic Planning
Technology & Software
The slide projects a significant value gap by 2025 between companies that leverage tech and digital innovation and those that do not, identifying key investment areas.
tech, digital, business growth, value generation, investment
Mixed Chart
BCG
Saved
The slide includes a bar chart showing the levelized cost of CO2 capture for various sectors.
Financial Performance
Energy & Utilities
This slide compares the levelized cost of CO2 capture across different industries and the concentration of CO2.
CO2 capture, cost, sectors, concentration, comparison
Single Chart
Kearney
Saved
Slide includes two pie charts showing cash flow sources and revenue composition from customers, along with a timeline comparing guidance versus actual EPS.
Risk Assessment and Management
Energy & Utilities
Assesses the low-risk profile of Enbridge's business model, focusing on financial stability and predictable returns, beneficial for risk management and financial planning.
Risk Management, Financial Stability, Predictable Returns, Business Model
Multiple Chart
Barclays
Saved
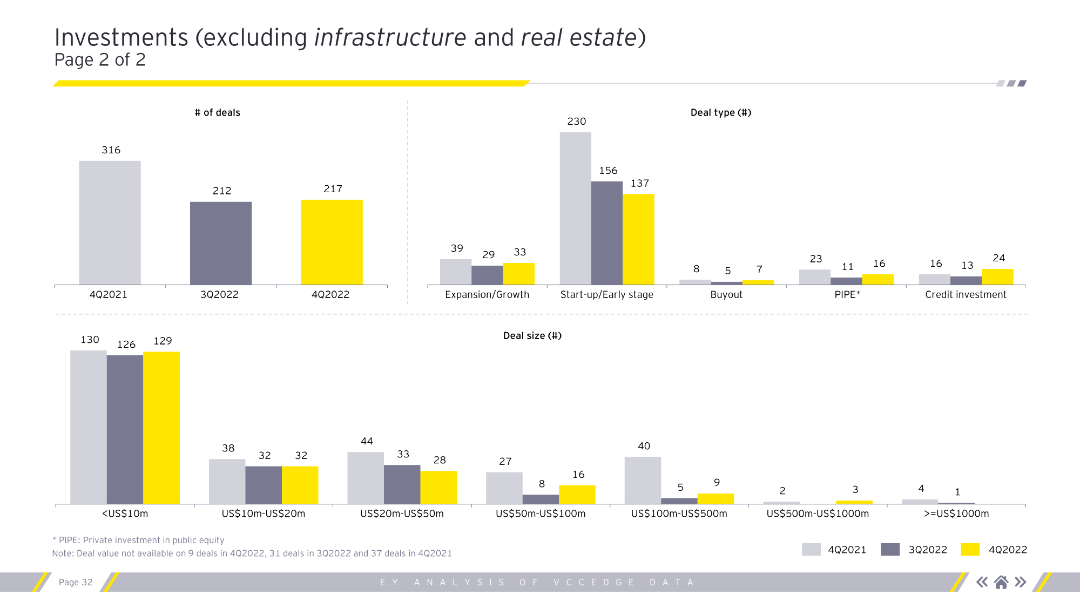
The slide includes column charts depicting the number of deals, deal types, and deal sizes for different quarters. Different colors represent distinct quarters, enhancing comparative analysis.
Market Analysis and Trends
Financial Services
This slide continues the analysis of investments excluding infrastructure and real estate, emphasizing the number of deals and their distribution across deal types and sizes.
Deal types, number of deals, deal sizes, investments
Multiple Chart
EY
Saved
The slide is divided into three columns comparing benefits of ESG in various categories, levels of ESG integration, and why companies are in the ESG game. It uses bar charts and percentages to compare different categories and their benefits.
Market Analysis and Trends
Environmental Services & Sustainability
The slide discusses the long-term value created by ESG initiatives, highlighting benefits like increased revenue, cost savings, and brand credibility. It also examines the integration levels of ESG in companies and the reasons behind their ESG initiatives.
ESG, value, benefits, integration, credibility
Multiple Chart
Kearney
Saved
The slide features a series of icons representing different communication channels, each accompanied by a percentage showing adoption or changes. This visual layout allows for a quick assessment of how COVID-19 has influenced channel strategies.
Technology and Digital Transformation
Professional Services
Discusses the transformation in marketing channels due to COVID-19, focusing on the shift towards more digital and direct-to-consumer approaches. It provides insights into how companies are adapting their communication and sales strategies in response to the pandemic, which is valuable for planning future marketing and sales initiatives.
COVID-19, Channel Strategy, Digital Transformation, Marketing, Sales
Pillar
Deloitte
Saved
The slide features a three-part comparative layout with check marks and bullet points. It is moderately dense with textual information across three distinct sections, comparing company priorities with achieved progress. The text is organized in blue and black, with green checks indicating progress.
Operational Efficiency
Financial Services
This slide outlines JPMorgan Chase & Co.'s significant progress against set priorities such as acquisition and deepening, engagement, and expenses and simplification. It uses bullet points and check marks to indicate achievements like increased deposit balances and improved digital activity rates. The slide is likely used in presentations to stakeholders to demonstrate company growth and operational achievements.
Progress, Priorities, Banking, Deposits, Engagement, Digital, Expenses, Simplification, Achievements, Growth
Table
JP Morgan
Saved
The slide features a line chart comparing expected returns and volatility across different leverage levels and asset allocations.
Investment Analysis
Financial Services
This slide assesses how prudent use of leverage can potentially enhance returns more effectively than adding high-risk assets, given various loan costs.
leverage, risk assets, expected returns, volatility, investment strategy
Multiple Chart
UBS
Saved
A column chart displays percentages of respondents' views on AI's impact on job numbers in their companies in France, indicating a predominant expectation of minor or no impact.
Market Analysis and Trends
Technology & Software
Analyzes expectations regarding AI's impact on employment within American companies in France, suggesting a limited effect on job numbers despite the technology's growing influence.
AI, employment impact, France, technology, expectations
Single Chart
Bain
Saved
Shows a column chart depicting the growth in assets under management for thematic equity funds, alongside a list of fund offerings and key differentiators.
Product and Service Analysis
Financial Services
The slide presents the launch and growth of a thematic equity fund family, emphasizing fund performance and the strategic approach to equity selection.
Thematic Equity, Fund Family, Assets Under Management, Equity Funds, Performance
Mixed Chart
Credit Suisse
Saved
Slide is a straightforward table layout listing acronyms used in the presentation. Each row has the acronym and its full meaning.
Market Analysis and Trends
Education & Training
Serves as a reference material providing definitions for various acronyms related to green economy and investments used throughout the presentation, facilitating better understanding for the audience.
acronyms, glossary, green economy
Text Only
Bain
Saved
An agenda slide with bullet points detailing the main topics: Distribution industry dynamics, Drivers of profitability, and an overview of EY-Parthenon.
Strategic Planning
Financial Services
This agenda slide outlines the key presentation topics, providing a structured overview for the audience.
agenda, distribution industry, profitability drivers, EY-Parthenon, presentation overview
Agenda
EY
Saved
Slide includes column charts comparing preparedness across industries and regions.
Risk Assessment and Management
Financial Services
Evaluates the preparedness of executives in various industries for market shocks in 2024, highlighting significant improvements, especially in Asia.
market shocks, preparedness, industry, regional
Multiple Chart
BCG
Saved
Slide includes bullet points, and tables detailing recovery trends and financial strategies.
Strategic Planning
Transportation & Logistics
Provides an update on global and regional recovery trends post-COVID-19, emphasizing financial adaptations.
COVID-19, recovery trends, financial strategy, global impact, market analysis
Header Vertical
Deutsche Bank
Saved
Previous
Next
If nothing, comes up, please save your slides first
Create a FREE account to continue browsing
Receive Instant Access to 1,000+ slides from companies like McKinsey, Google, and Goldman Sachs
First Name
Last Name
Email
Password
I agree to all
Terms & Privacy Policy
Thank you! Your submission has been received!
Oops! Something went wrong while submitting the form.
Have an account?
Sign in
Column Chart
Heatmap
Chevron
Org Chart
Infographic
Callouts
Timeline
List
Graphic
Picture
Process Flow
Diagram
Paragraph
Map
Table
Framework
Subtitle
Takeaway Box
Icon
Other Chart
Radar Chart
Waterfall Chart
Mekko Chart
Pie Chart
Scatter Plot
Line Chart
Bar chart
Bullet points


![Exhibit 22 NPL Sales Total Volume Expected Growth [TRY bn, 2010-23]](https://cdn.prod.website-files.com/654e70fb59937215cac87b19/6877e212f9a180cbc7298040_L52_Oa3wTN6SGsqWKzp8NZrmC8r3tL5qZ_X5VbS8Ai0.jpeg)