My Account
My Slides
Search by Category
Templates
View All Templates
Download Template Slides
Leave Feedback
Login
Logout
Get Started
Browse all Slides
Browse all Slides
Create a FREE Account
Instant access to 1,000+ real slides from top companies like McKinsey, BCG, Goldman Sachs, Google and many more!
First Name
Last Name
Email
Password
I agree to all
Terms & Privacy Policy
Thank you! Your submission has been received!
Oops! Something went wrong while submitting the form.
Have an account?
Sign in
Spark Your Next Big Idea with New Presentation Templates
VIEW ALL Templates
Welcome,
Welcome
PRO
Show Featured Only
Checkbox 8
Companies
Mckinsey
Bain
BCG
EY
Deloitte
Accenture
PwC/Strategy&
JP Morgan
Goldman Sachs
Morgan Stanley
Citigroup
Deutsche Bank
Barclays
LEK
KPMG
Kearney
Oliver Wyman
Booz Allen Hamilton
Gartner
IPSOS
Nielsen
Slide type
Text Only
Linear Flow
Vertical Flow
Single Chart
Header Horizontal
Mixed Chart
Header Vertical
Pillar
Multiple Chart
Graphic
Agenda
Title
Table
Framework
Industry
Technology & Software
Artificial Intelligence
Financial Services
Retail & E-commerce
Consumer Goods
Industrial & Manufacturing
Transportation & Logistics
Telecommunications
Real Estate & Construction
Hospitality & Tourism
Professional Services
Education & Training
Media & Entertainment
Agriculture & Food Production
Healthcare & Pharmaceuticals
Environmental Services & Sustainability
Government & Public Sector
Use Case
Mergers and Acquisitions
Performance Metrics and KPIs
Client Case Studies
Competitive Landscape
Corporate Finance and Valuation
Product and Service Analysis
Customer and Market Segmentation
Organizational Structure and Change
Industry Overview
Regulatory and Compliance
Risk Assessment and Management
Investment Analysis
Organizational Structure and Change
Human Resources and Talent Management
Financial Performance
Market Analysis and Trends
Sales and Business Development
Human Resources and Talent Management
Clear all
Thank you! Your submission has been received!
Oops! Something went wrong while submitting the form.
Tag
View slide
Visual tile layout with six horizontally aligned section covers. Bright visuals with purple accents on white background.
Industry Overview
Artificial Intelligence
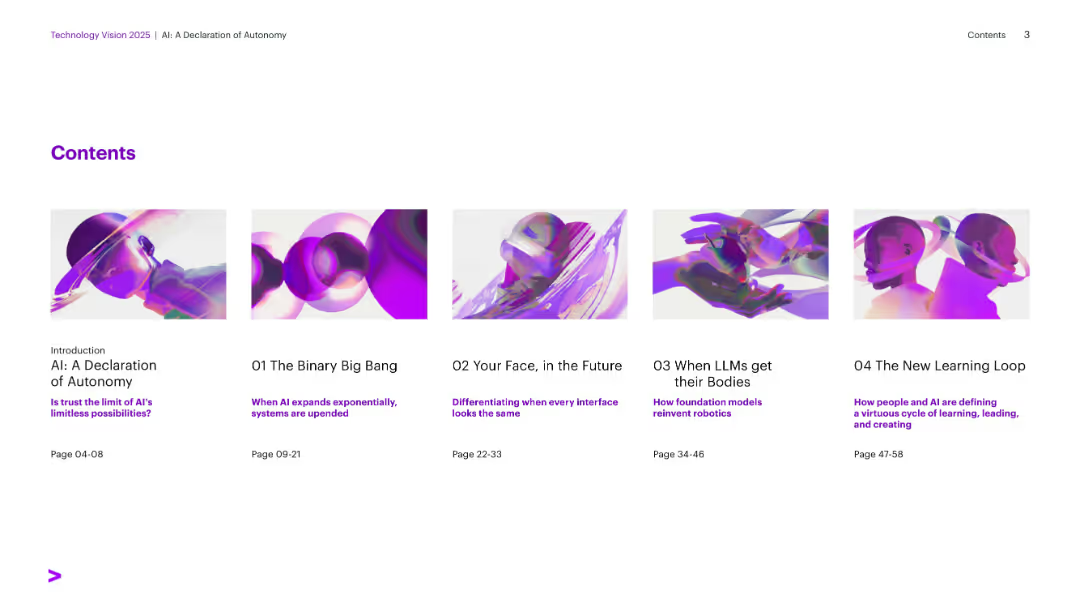
Table of contents for a report on AI autonomy, outlining sections such as The Binary Big Bang, Generative UI, and Learning Loops. Each section includes page numbers and subtitles indicating the theme.
AI Trends, Contents, Autonomy, Technology Vision, Learning, Robotics, Interfaces
false
Industry Overview
Artificial Intelligence artificial-intelligence
Agenda
Accenture
View slide
A concise visual slide outlining various AI use cases, relevant technologies, functions, and industries, paired with benefits highlighted in a box.
Technology and Digital Transformation
Technology & Software
Providing a brief overview of practical AI use cases in different industries and their respective benefits, emphasizing the transformative power of AI.
AI Use Cases, Business Transformation, ML, NLP, Computer Vision, Strategic Planning
false
Technology and Digital Transformation
Technology & Software technology-and-software
Header Vertical
McKinsey
View slide
A continuation from the previous slide, with pie charts and bar graphs illustrating potential financial value from AI and its correlation with financial performance.
Financial Performance
Technology & Software
This slide continues to highlight the financial importance of AI, showing potential value in various business functions and the correlation between AI maturity and financial performance.
AI Value, Financial Forecast, Market Analysis, AI Maturity, Business Impact, Investment Returns
false
Financial Performance
Technology & Software technology-and-software
Multiple Chart
McKinsey
View slide
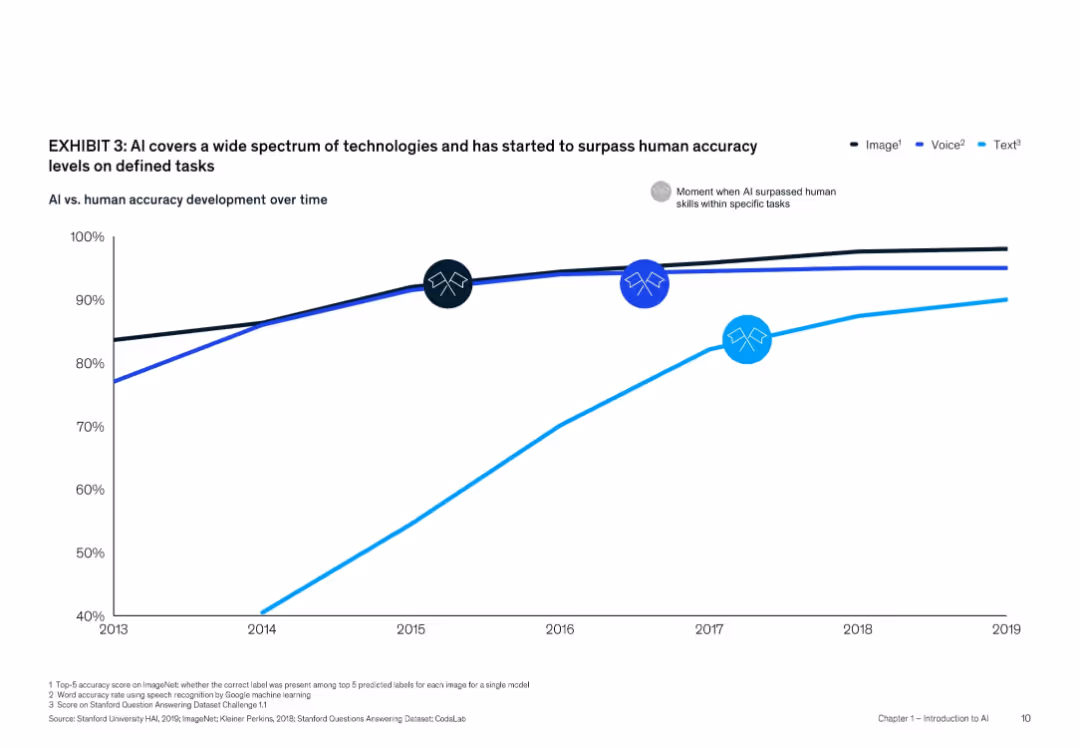
Line graph showing AI vs. human accuracy in Image, Voice, and Text domains from 2013–2019, with markers indicating points AI surpassed humans
Technology and Digital Transformation
Artificial Intelligence
AI accuracy has steadily improved, overtaking human performance in vision, speech, and language tasks by 2016–2017. The chart shows technology maturity across domains and the inflection points of AI advancement.
AI accuracy, image recognition, speech, NLP, human parity, deep learning, benchmarks
false
Technology and Digital Transformation
Artificial Intelligence artificial-intelligence
Single Chart
McKinsey
View slide
The slide uses a scatter plot to display the distribution of organizations based on their AI capabilities. Different colors indicate various categories of AI proficiency.
Performance Metrics and KPIs
Technology & Software
It identifies different levels of AI adoption among organizations, categorizing them into Achievers, Builders, Innovators, and Experimenters based on their AI capabilities and performance.
AI achievers, capabilities, scatter plot, performance, categorization
false
Performance Metrics and KPIs
Technology & Software technology-and-software
Mixed Chart
Accenture
View slide
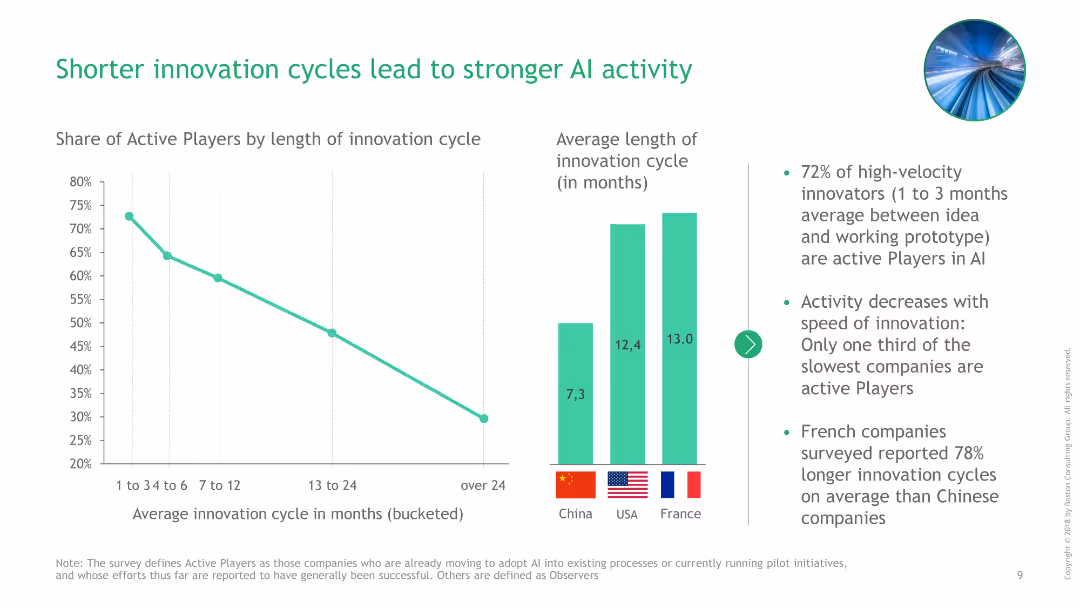
Line chart showing the relationship between innovation cycle length and AI activity levels, with additional bar charts comparing average cycle lengths across countries.
Technology and Digital Transformation
Technology & Software
This slide demonstrates how shorter innovation cycles contribute to stronger AI activity, supported by data comparing innovation cycles in China, USA, and France.
AI activity, innovation cycles, China, USA, France, technology, digital transformation, line chart, bar charts, comparison, data presentation
false
Technology and Digital Transformation
Technology & Software technology-and-software
Multiple Chart
BCG
View slide
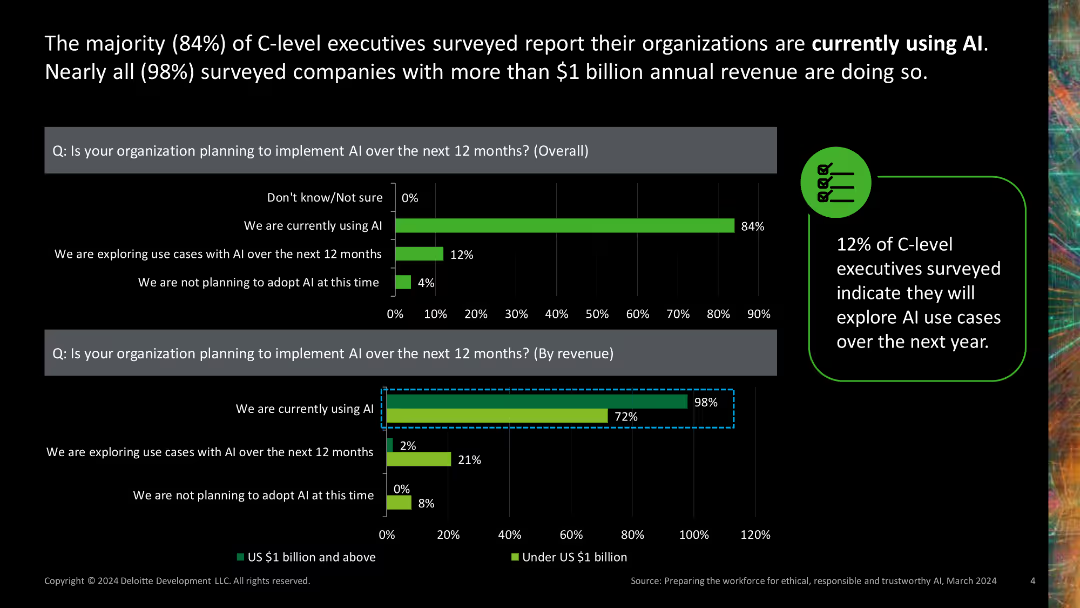
Two column charts showing AI adoption rates by overall and by revenue. Green bars with percentage values.
Market Analysis and Trends
Technology & Software
Presents data on the high rate of AI adoption among C-level executives and companies with significant annual revenue, indicating a trend towards widespread AI implementation.
AI adoption, C-level executives, revenue, market trends, technology
false
Market Analysis and Trends
Technology & Software technology-and-software
Multiple Chart
Deloitte
View slide
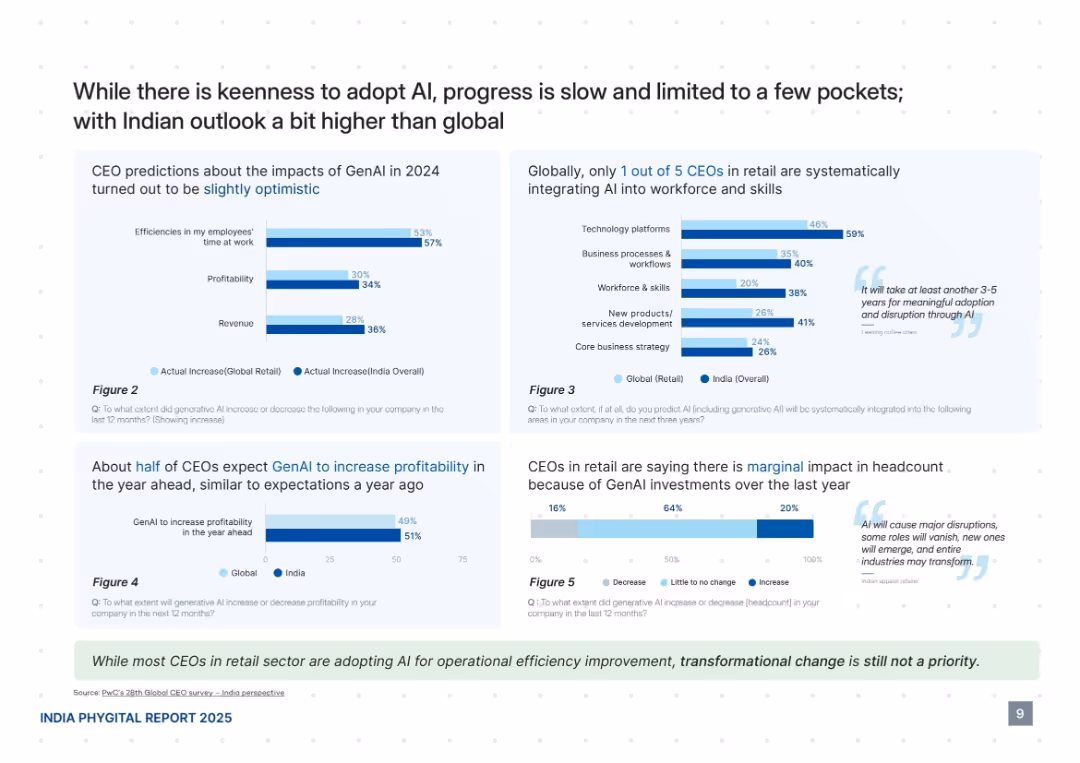
Multi-chart slide with side-by-side horizontal bar charts and supporting quotes. Blue and white color scheme, with light box highlights and callouts.
Strategic Planning
Retail & E-commerce
The slide compares Indian and global retail CEO perspectives on AI adoption, revealing higher optimism and expectations in India. Charts show GenAI's impact on efficiency, revenue, and profitability. It also notes marginal headcount changes and limited AI workforce integration, highlighting early-stage adoption and varied strategic focus across companies.
AI adoption, GenAI, retail CEOs, India vs global, profitability, workforce, technology integration, headcount impact
false
Strategic Planning
Retail & E-commerce retail-and-e-commerce
Multiple Chart
PwC/Strategy&
View slide
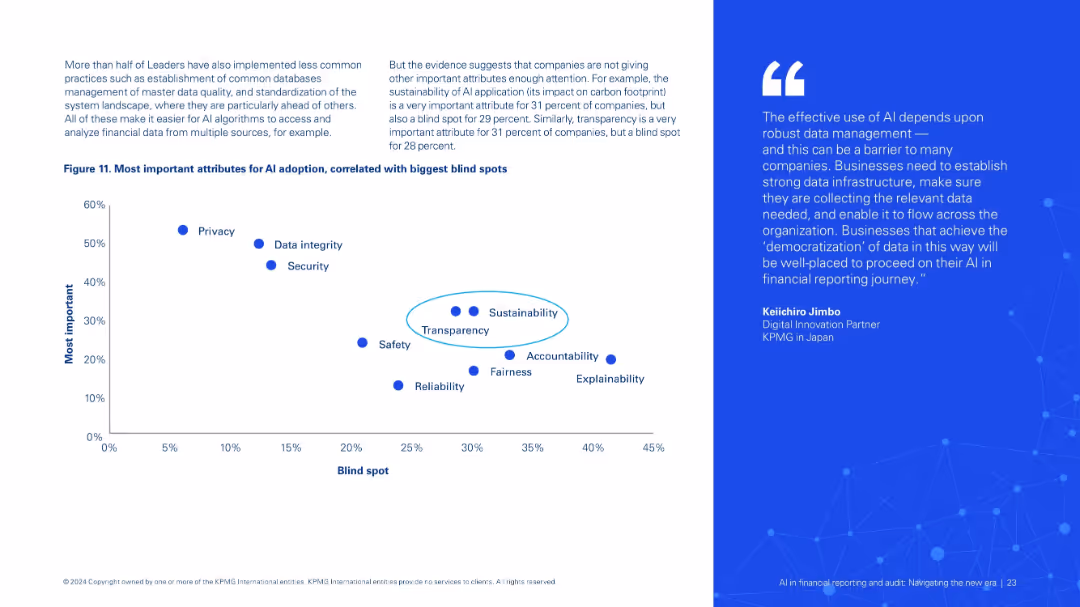
Left side provides context; right side features a scatterplot (Figure 11) mapping importance vs neglect of AI attributes. Blue dots and clean chart design.
Regulatory and Compliance
Financial Services
Analyzes the gap between perceived importance and actual attention given to AI-related attributes such as privacy, transparency, and explainability. Highlights critical blind spots in AI governance practices.
AI adoption, blind spots, privacy, transparency, compliance, explainability
false
Regulatory and Compliance
Financial Services financial-services
Mixed Chart
KPMG
View slide
The slide presents various graphical representations, including pie charts, bar graphs, and an illustrative side panel with an image of an industrial scenario. It utilizes green, black, and white color scheme with clean lines and a structured layout.
Technology and Digital Transformation
Technology & Software
Focuses on integrating AI into business processes, highlighting the importance of collaboration between tech teams and business units for effective AI adoption. Stresses on both the financial and transformational impacts of AI with real-world business examples.
AI adoption, business transformation, collaboration, technology integration, industry case study
false
Technology and Digital Transformation
Technology & Software technology-and-software
Mixed Chart
BCG
View slide
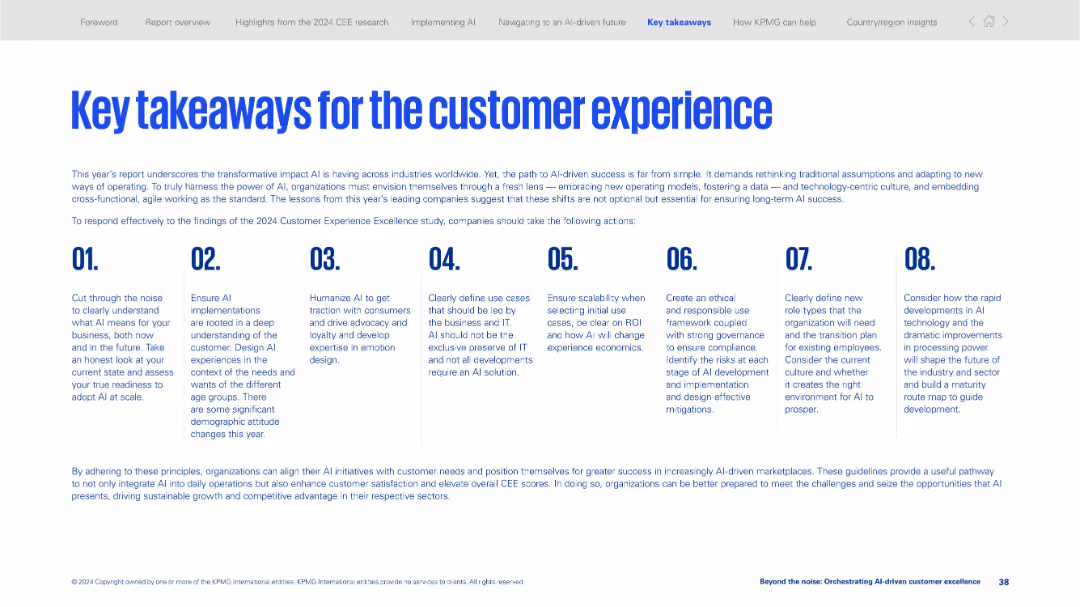
Numbered column layout (01–08) summarizing main recommendations for AI adoption and customer experience.
Strategic Planning
Professional Services
Offers eight key principles to guide organizations in adopting AI for customer experience improvements. Covers readiness assessment, ethical frameworks, clear use cases, role definitions, and scalability.
AI adoption, customer experience, strategy, takeaways, ethics, readiness, scalability, roles, organizational change
false
Strategic Planning
Professional Services professional-services
Linear Flow
KPMG
View slide
This slide features a complex chart displaying the adoption levels of generative AI across various business functions. The chart utilizes various sized circles in a gradient from light to dark teal to represent the increasing expertise levels from 'Little expertise' to 'Very high expertise'. The slide background is white with a decorative green bubble design on the left. Each function is listed vertically on the left with corresponding circles across five columns indicating the percentage of expertise.
Market Analysis and Trends
Technology & Software
The slide presents data on generative AI adoption across different business functions like IT/cybersecurity, marketing, and more. The data is categorized by levels of expertise, ranging from 'Little' to 'Very high'. The largest circles indicate the highest adoption and expertise levels. This could be used in presentations to highlight areas of focus for AI skills development or to showcase industry benchmarks in AI expertise. The data is from a survey conducted in Q4 2023, with 2,835 responses, indicating a strong inclination towards higher expertise in IT and product development.
AI adoption, expertise levels, business functions, generative AI, benchmarking, skill development, IT/cybersecurity, marketing, product development
false
Market Analysis and Trends
Technology & Software technology-and-software
Single Chart
Deloitte
View slide
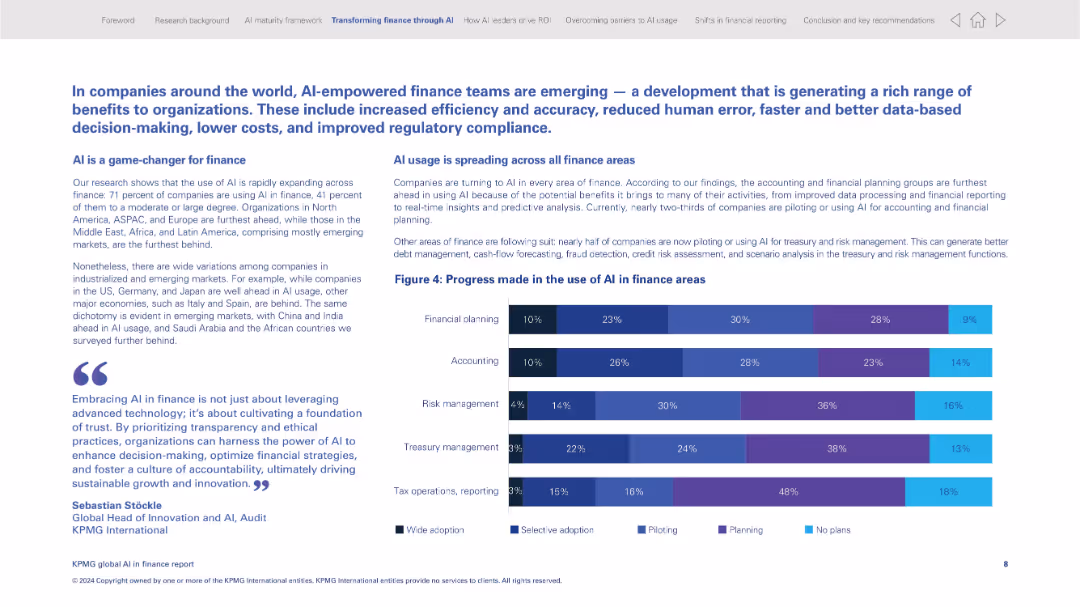
Two-column layout with text and a horizontal bar chart; strong use of KPMG blue; emphasis on AI adoption by function
Technology and Digital Transformation
Financial Services
The slide outlines how AI is being adopted across various finance functions, including planning, accounting, and risk management. It shows a bar chart visualizing the extent of AI adoption across areas, highlighting how AI is becoming a game-changer. The text provides regional insights and quotes an executive emphasizing trust and transparency.
AI adoption, financial planning, accounting, risk management, predictive analytics, KPMG, transformation, trust, compliance, efficiency
false
Technology and Digital Transformation
Financial Services financial-services
Mixed Chart
KPMG
View slide
Contains three circular graphs illustrating financial benefits of AI in banking, showing improvements in productivity, revenue growth, and return on equity.
Financial Performance
Financial Services
Details projected financial benefits for banks adopting AI, emphasizing significant gains in productivity, revenue growth, and return on equity, suitable for financial strategy discussions.
AI adoption, financial projections, banking, productivity, revenue growth
false
Financial Performance
Financial Services financial-services
Pillar
Accenture
View slide
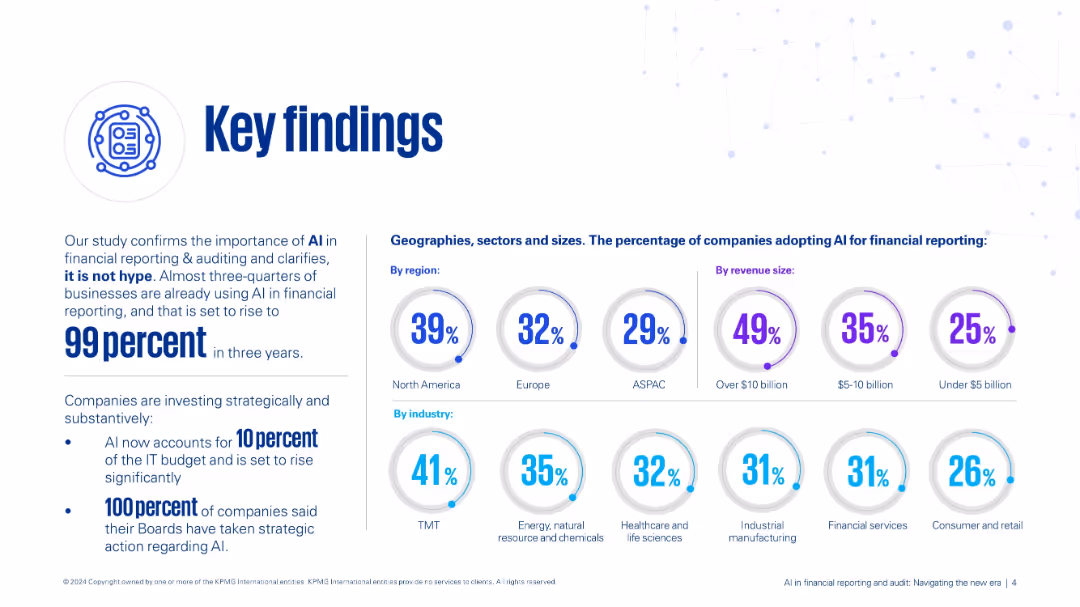
Clean layout with bold infographic icons and segmented stats by region, revenue, and industry. Blue and purple theme.
Financial Performance
Financial Services
Presents key findings on AI adoption in financial reporting, showing high current and projected adoption rates. Highlights geographic and industry-specific adoption stats and the strategic role of AI in IT budgets and board decisions.
AI adoption, financial reporting, IT budget, regional stats, industry trends, board action
false
Financial Performance
Financial Services financial-services
Mixed Chart
KPMG
View slide
Slide includes textual content with adjacent column chart comparing attitudes by age and location
Technology and Digital Transformation
Financial Services
Highlights variations in AI adoption attitudes across different generations and geographical locations.
AI adoption, generational differences, geographical differences, financial services
false
Technology and Digital Transformation
Financial Services financial-services
Mixed Chart
Deloitte
View slide
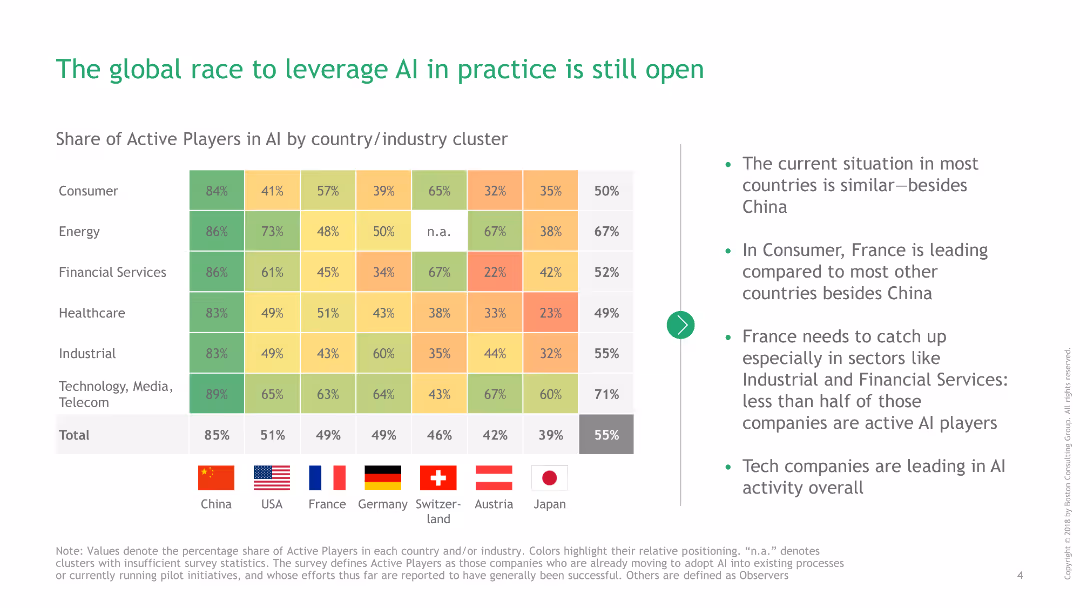
The slide includes a heatmap chart showing AI adoption by industry and country, accompanied by a text summary.
Market Analysis and Trends
Technology & Software
Examines the global state of AI adoption across various industries and countries, noting areas where France needs to improve.
AI adoption, global race, industries, technology, France
false
Market Analysis and Trends
Technology & Software technology-and-software
Table
BCG
View slide
Contains text blocks and icons, describing four key areas critical for AI adoption in risk management.
Technology and Digital Transformation
Technology & Software
Discusses the necessary enablers for adopting AI within organizations, emphasizing governance and skills.
AI adoption, governance, skills, risk management
false
Technology and Digital Transformation
Technology & Software technology-and-software
Pillar
PwC/Strategy&
View slide
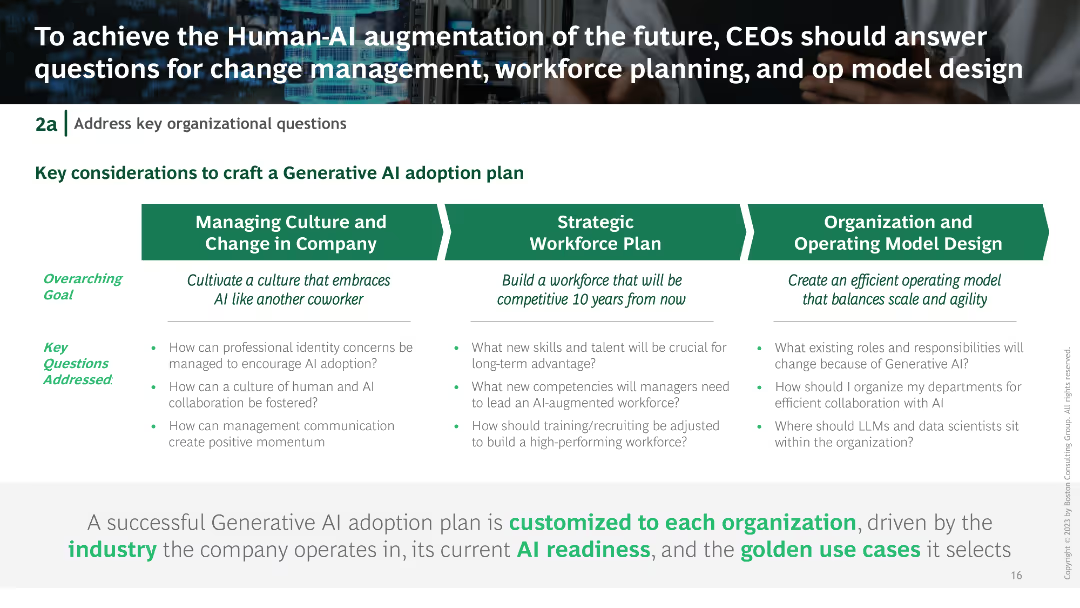
Text is organized in three columns with key considerations for crafting a generative AI adoption plan. Visual elements include icons and text boxes highlighting managing culture, workforce planning, and model design.
Organizational Structure and Change
Technology & Software
Discusses key organizational questions for generative AI adoption, including managing culture, strategic workforce planning, and operational model design.
AI adoption, organizational change, workforce planning, operational model, generative AI
false
Organizational Structure and Change
Technology & Software technology-and-software
Table
BCG
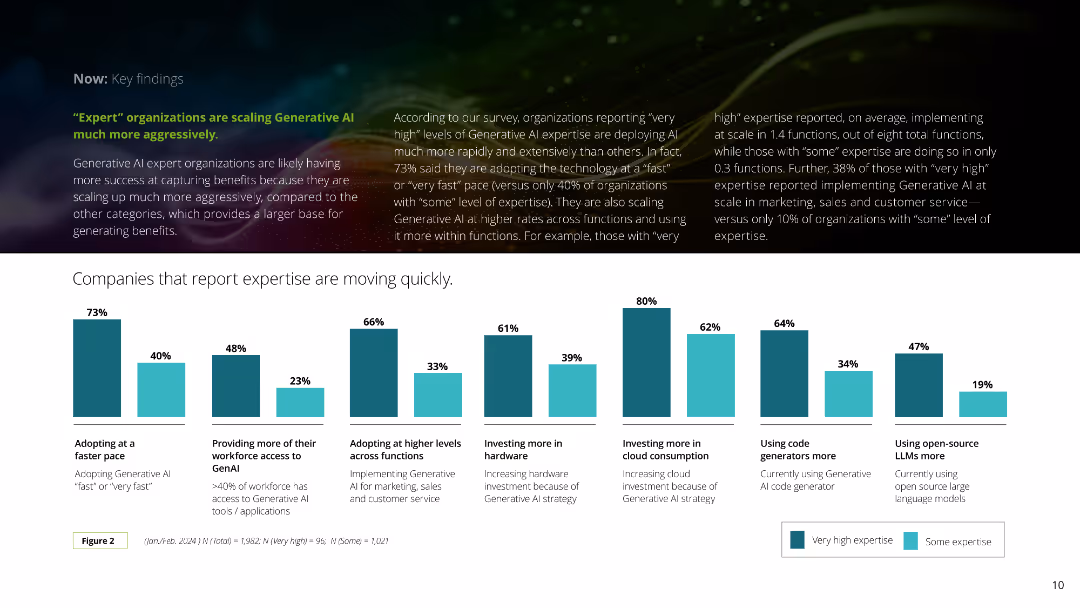
View slide
The slide displays a series of vertical bar charts comparing the pace of Generative AI adoption and the scope of its application across various business functions. The bars are in shades of blue and green for clarity.
Technology and Digital Transformation
Technology & Software
It highlights that organizations with high expertise in Generative AI are adopting and scaling the technology more rapidly and extensively, investing in various areas like hardware, cloud, and code generators.
AI adoption, scaling, expertise, investment, chart
false
Technology and Digital Transformation
Technology & Software technology-and-software
Mixed Chart
Deloitte
View slide
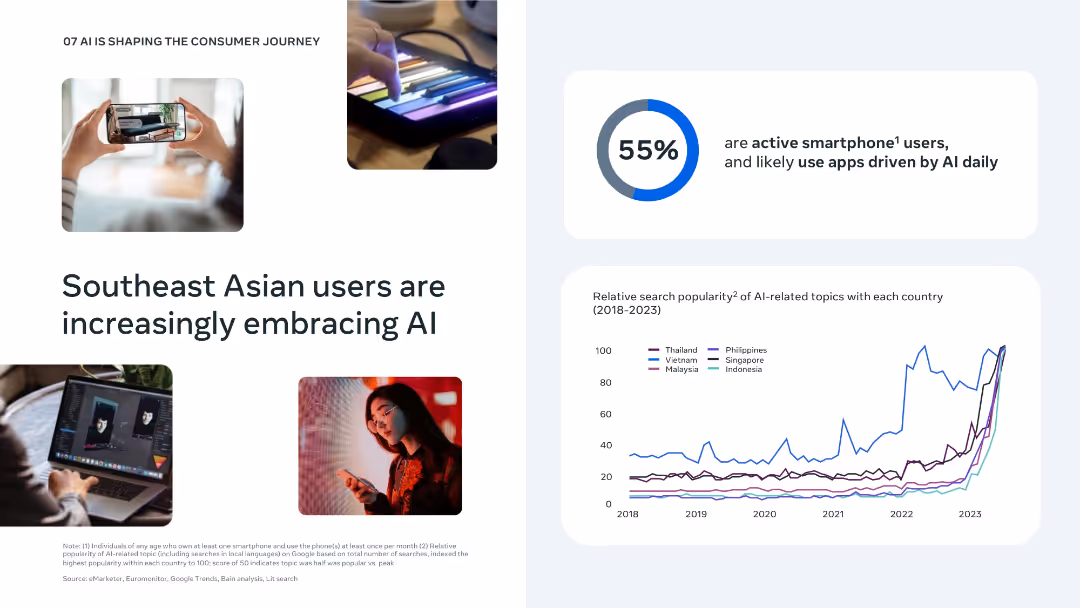
Split layout with photos, bold statistics, and a line chart showing AI search trend growth across countries; clean, data-rich design.
Market Analysis and Trends
Artificial Intelligence
Demonstrates increasing engagement with AI among Southeast Asian users, especially through smartphone use. Search trend data confirms a steady rise in interest in AI topics across countries, highlighting a fertile environment for AI adoption in consumer and business applications.
AI adoption, smartphone use, search trends, Southeast Asia, technology
false
Market Analysis and Trends
Artificial Intelligence artificial-intelligence
Multiple Chart
Bain
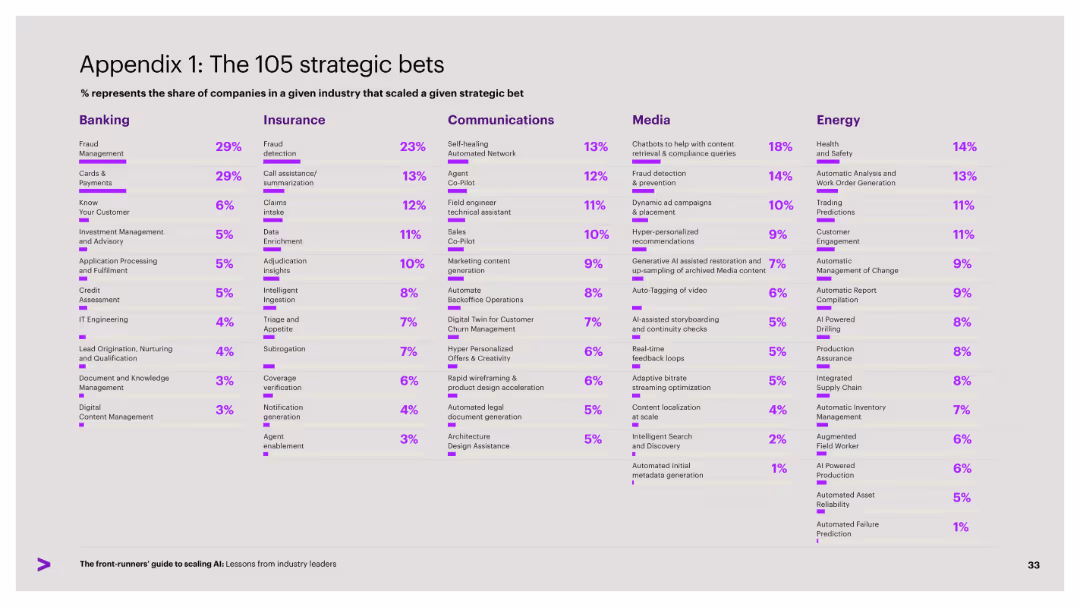
View slide
Dense grid layout with five industry columns, each listing AI-related strategic initiatives by adoption rate. Purple accent bars and text for % indicators.
Strategic Planning
Artificial Intelligence
This slide outlines the top AI-related strategic bets scaled by companies across various industries, ranked by the percentage of firms adopting each. It highlights the leading AI initiatives by sector, from fraud detection to agent enablement.
AI adoption, strategic bets, industry comparison, scaling, technology
false
Strategic Planning
Artificial Intelligence artificial-intelligence
Single Chart
Accenture
View slide
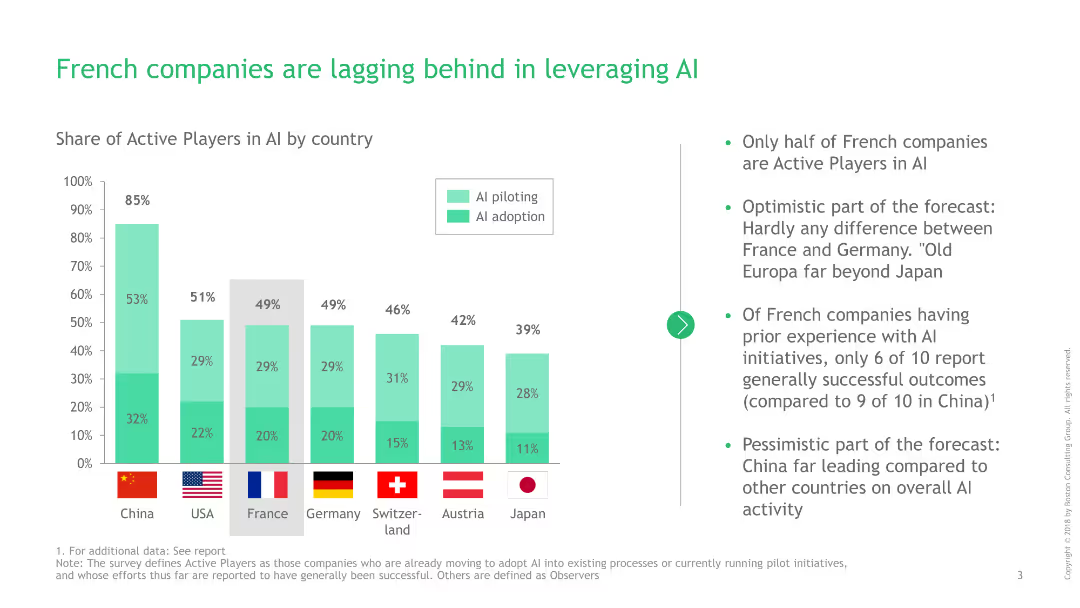
Contains a column chart showing the share of active AI players by country, with additional text highlighting France's position.
Technology and Digital Transformation
Technology & Software
Discusses the slower adoption and piloting rates of AI among French companies compared to other countries.
AI adoption, technology, France, global comparison, active players
false
Technology and Digital Transformation
Technology & Software technology-and-software
Mixed Chart
BCG
View slide
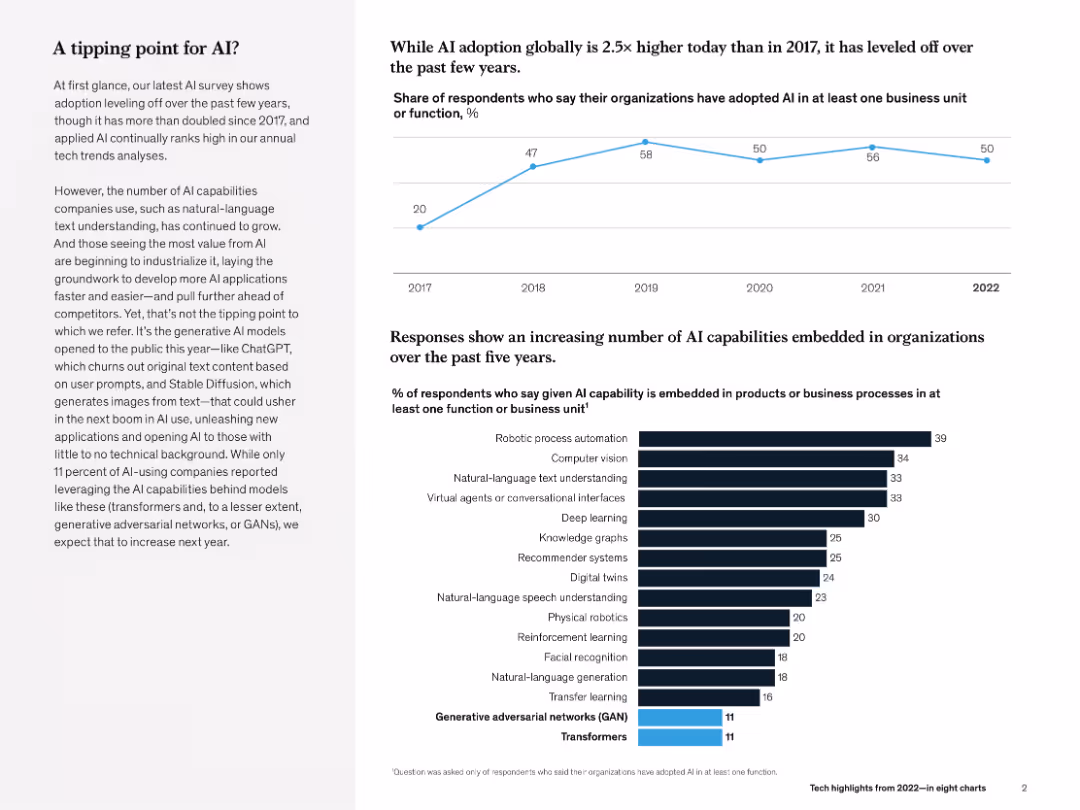
Line chart (top) and bar chart (bottom). Left-aligned text explains key insight. Minimalist black-and-blue theme.
Technology and Digital Transformation
Artificial Intelligence
The slide evaluates AI adoption trends (flatlining at ~50% post-2018) and shows growing diversity in AI use cases (e.g., robotic process automation, NLP). Emphasis is placed on emerging generative AI models like GANs and transformers.
AI adoption, transformers, GANs, NLP, robotic automation, McKinsey, business unit, survey
false
Technology and Digital Transformation
Artificial Intelligence artificial-intelligence
Multiple Chart
McKinsey
View slide
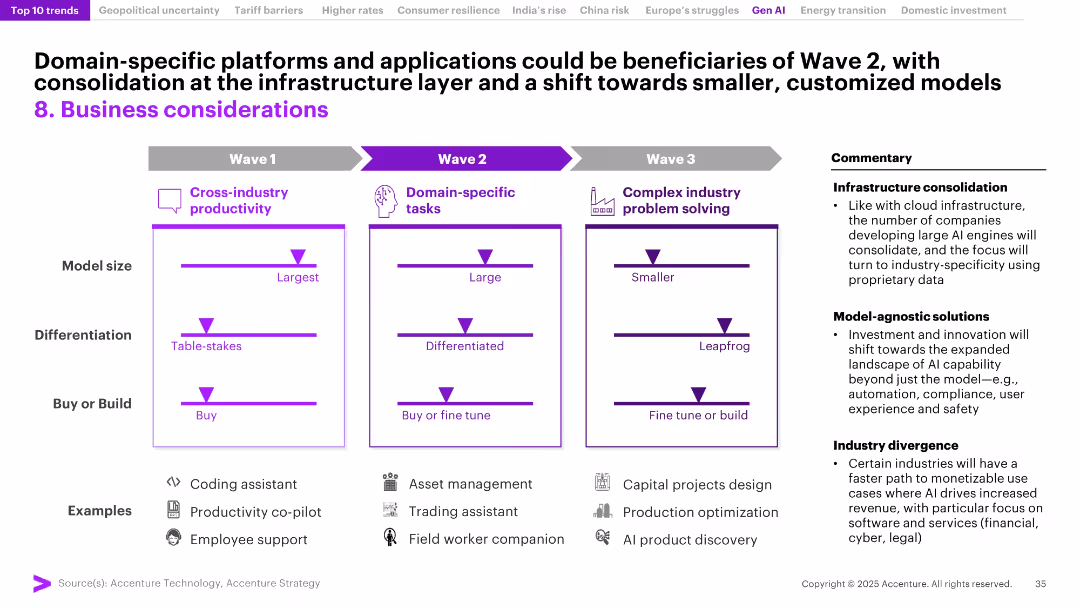
Three-column framework titled Waves 1–3 showing AI model evolution (from cross-industry to domain-specific and problem-solving); commentary on right.
Product and Service Analysis
Artificial Intelligence
The slide lays out a roadmap for AI adoption: from general productivity tools to specialized and complex use cases. It emphasizes trends like infrastructure consolidation and industry divergence, indicating a shift toward tailored, high-impact AI applications in sectors such as legal, financial, and industrial operations.
AI adoption, wave strategy, domain-specific AI, infrastructure consolidation, product evolution, industry divergence, AI models, customization
false
Product and Service Analysis
Artificial Intelligence artificial-intelligence
Mixed Chart
Accenture
View slide
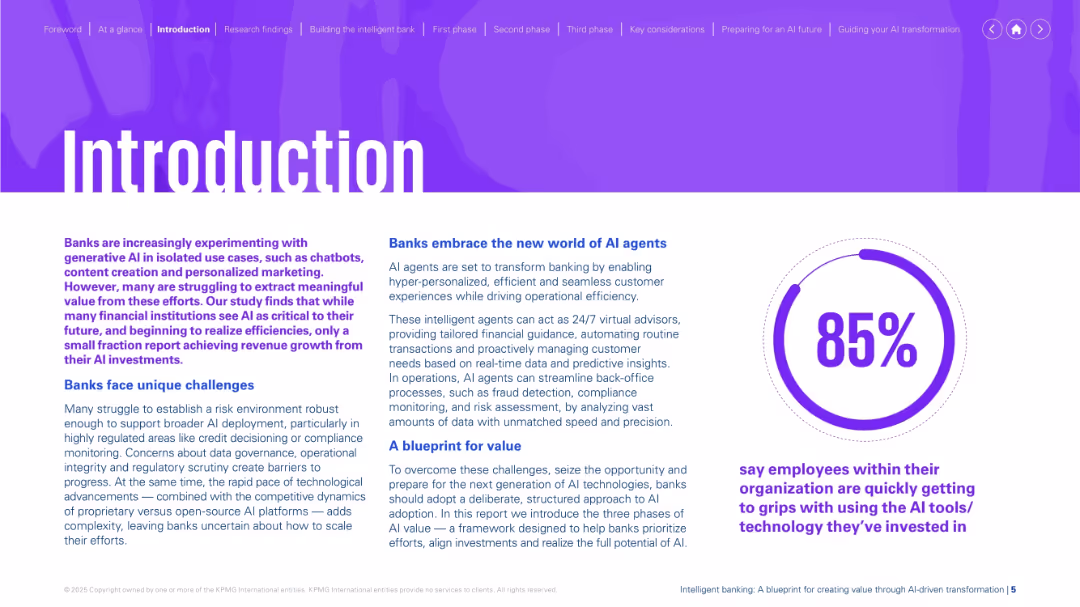
Bold purple background with split columns of explanatory text and a large circular stat.
Technology and Digital Transformation
Financial Services
Introduces the report’s purpose, highlighting banks’ experimentation with AI agents and challenges in scaling. Emphasizes opportunity to realize efficiencies and sets up a structured framework for adopting AI tools.
AI agents, banking, generative AI, personalization, challenges, transformation, adoption framework
false
Technology and Digital Transformation
Financial Services financial-services
Mixed Chart
KPMG
View slide
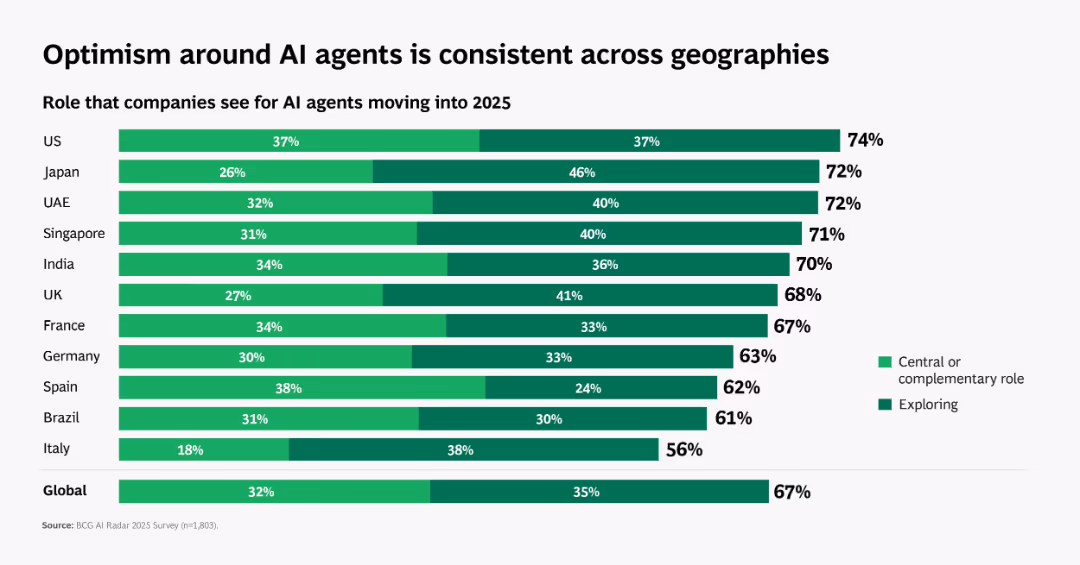
Horizontal bar chart with country-wise data split into two segments: "Central or complementary role" (light green) and "Exploring" (dark green).
Market Analysis and Trends
Artificial Intelligence
This slide highlights global perspectives on the role of AI agents in 2025. Countries like the US, Japan, and UAE show high percentages of companies viewing AI agents as having a central or exploratory role. A global average of 67% indicates strong optimism around AI deployment.
AI agents, global trends, adoption, regional analysis, business outlook
false
Market Analysis and Trends
Artificial Intelligence artificial-intelligence
Single Chart
BCG
View slide
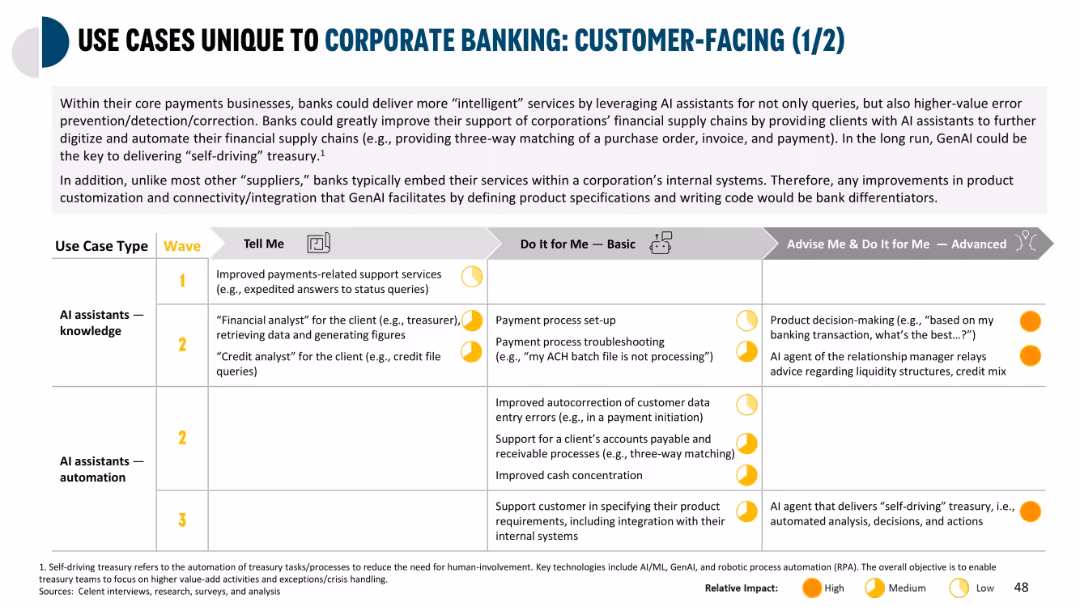
Structured matrix with three AI capability columns; icons for service categories; color-coded impact circles
Customer and Market Segmentation
Financial Services
Highlights AI assistant capabilities for corporate banking clients across knowledge and automation use cases. It describes functions such as payment help, financial advice, product setup, and integration support.
AI assistant, customer support, payment setup, digital transformation, corporate clients
false
Customer and Market Segmentation
Financial Services financial-services
Mixed Chart
Oliver Wyman
View slide
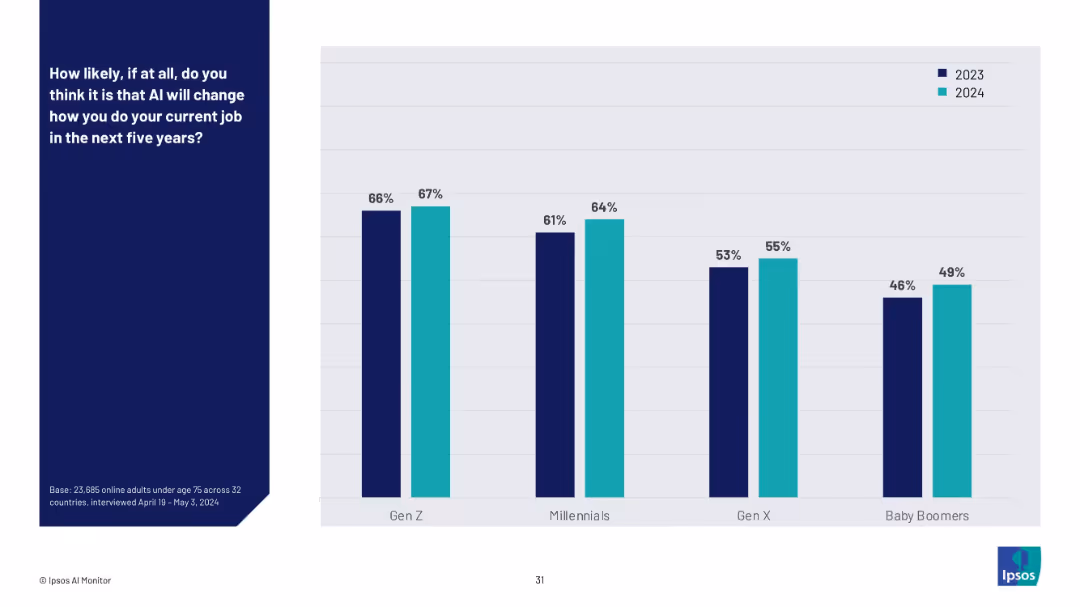
Clustered vertical bar chart comparing generational responses (Gen Z to Baby Boomers) for 2023 and 2024.
Technology and Digital Transformation
Artificial Intelligence
This slide compares generational expectations for job change due to AI from 2023 to 2024. Younger generations (Gen Z, Millennials) continue to show higher belief that AI will impact their work, with slight increases across all age groups year-over-year.
AI at work, generational trends, year-over-year comparison, work transformation, future readiness, survey, technology shift, 2023–2024
false
Technology and Digital Transformation
Artificial Intelligence artificial-intelligence
Mixed Chart
IPSOS
View slide
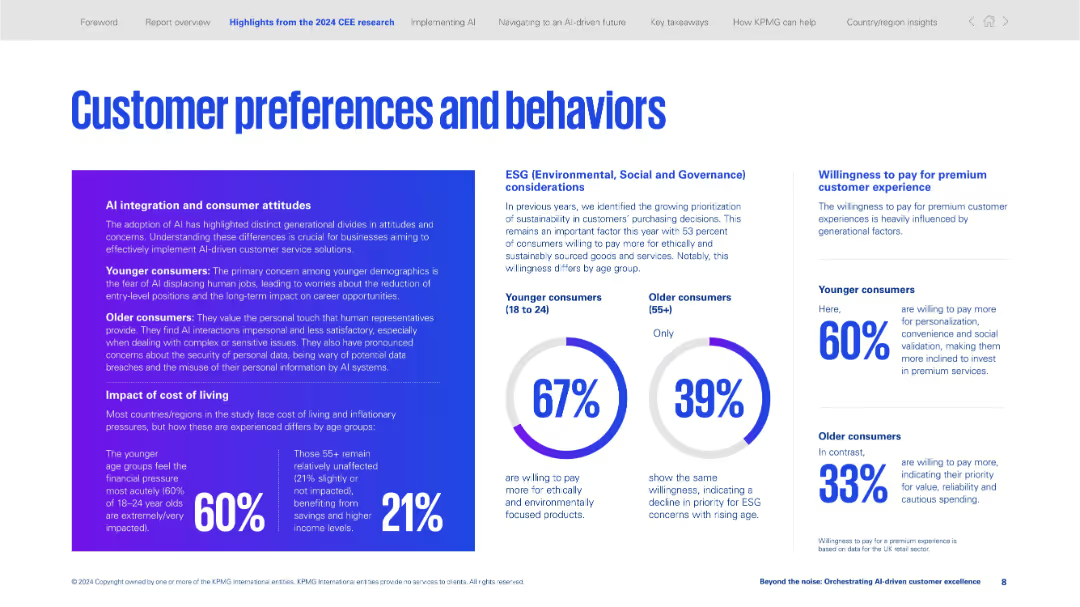
Three-column layout with infographics, text boxes, and circular data visualizations on ESG and cost-of-living impact.
Customer and Market Segmentation
Professional Services
Examines generational attitudes toward AI, cost-of-living sensitivity, and ESG preferences. Younger consumers are more impacted and more willing to pay for personalization and sustainability.
AI attitudes, ESG, generational segmentation, personalization, premium experience, cost of living, consumer behavior, sustainability
false
Customer and Market Segmentation
Professional Services professional-services
Mixed Chart
KPMG
Previous
Loading...
Hold On!
We are searching in our database
If nothing, comes up, please try different filters!
Column Chart
Heatmap
Chevron
Org Chart
Infographic
Callouts
Timeline
List
Graphic
Picture
Process Flow
Diagram
Paragraph
Map
Table
Framework
Subtitle
Takeaway Box
Icon
Other Chart
Radar Chart
Waterfall Chart
Mekko Chart
Pie Chart
Scatter Plot
Line Chart
Bar chart
Bullet points
Create a FREE account to continue browsing
Receive Instant Access to 1,000+ slides from companies like McKinsey, Google, and Goldman Sachs
First Name
Last Name
Email
Password
I agree to all
Terms & Privacy Policy
Thank you! Your submission has been received!
Oops! Something went wrong while submitting the form.
Have an account?
Sign in
Upgrade to PRO to Save slides
Advanced Search and Filters
Access to 15,000+ slides
Access to Category Pages
Save/Bookmark Slides
PowerPoint Template Library
Pick a Plan
MONTHLY
$12/month
Billed every month, Cancel anytime.
YEARLY
$9/year
Billed $108 annually, Cancel anytime.
Checkout for $12/month
Checkout for $108/yr
Secured by Stripe | AES-256 bit encryption