My Account
My Slides
Leave Feedback
Login
Logout
Get Started
Browse all Slides
Browse Slides Pro
Create a FREE Account
Instant access to 1,000+ real slides from top companies like McKinsey, BCG, Goldman Sachs, Google and many more!
First Name
Last Name
Email
Password
I agree to all
Terms & Privacy Policy
Thank you! Your submission has been received!
Oops! Something went wrong while submitting the form.
Have an account?
Sign in
Welcome,
Welcome
PRO
Show Featured Only
Checkbox 8
Companies
Mckinsey
Bain
BCG
EY
Deloitte
Accenture
PwC/Strategy&
JP Morgan
Goldman Sachs
Morgan Stanley
Citigroup
Deutsche Bank
Barclays
LEK
Kearney
Oliver Wyman
Booz Allen Hamilton
Gartner
IPSOS
Nielsen
Slide type
Text Only
Linear Flow
Vertical Flow
Single Chart
Header Horizontal
Mixed Chart
Header Vertical
Pillar
Multiple Chart
Graphic
Agenda
Title
Table
Framework
Industry
Technology & Software
Financial Services
Retail & E-commerce
Consumer Goods
Industrial & Manufacturing
Transportation & Logistics
Telecommunications
Real Estate & Construction
Hospitality & Tourism
Professional Services
Education & Training
Media & Entertainment
Agriculture & Food Production
Healthcare & Pharmaceuticals
Environmental Services & Sustainability
Government & Public Sector
Use Case
Mergers and Acquisitions
Performance Metrics and KPIs
Client Case Studies
Competitive Landscape
Corporate Finance and Valuation
Product and Service Analysis
Customer and Market Segmentation
Organizational Structure and Change
Industry Overview
Regulatory and Compliance
Risk Assessment and Management
Investment Analysis
Organizational Structure and Change
Human Resources and Talent Management
Financial Performance
Market Analysis and Trends
Sales and Business Development
Human Resources and Talent Management
Clear all
Thank you! Your submission has been received!
Oops! Something went wrong while submitting the form.
Tag
View slide
The slide includes four sections with textual and visual content discussing wealth and regulation, digital transformation, risk and reputation, and strategy.
Market Analysis and Trends
Financial Services
The slide examines key concerns for family offices in the APAC region, highlighting trends in regulation, digital transformation, risk management, and strategy.
APAC, family offices, regulation, digital transformation, risk management
false
Market Analysis and Trends
Financial Services financial-services
Multiple Chart
EY
View slide
Bar chart showing percentages of APAC family offices' regulatory concerns, accompanied by text explanation.
Regulatory and Compliance
Financial Services
Discusses the concerns of APAC family offices about various regulatory issues, highlighting significant concern percentages.
APAC, family offices, regulatory issues, transparency, compliance
false
Regulatory and Compliance
Financial Services financial-services
Mixed Chart
EY
View slide
The slide includes multiple column charts showing the adoption of fundamental systems like EMR, billing, patient administration, and ancillary systems in hospitals across different APAC markets.
Technology and Digital Transformation
Healthcare & Pharmaceuticals
The slide details the penetration of back-end IT systems in hospitals across the APAC region, highlighting the adoption rates of electronic medical records, billing, patient administration, and ancillary systems, with Japan leading in EMR adoption.
APAC, hospitals, IT systems, EMR, billing
false
Technology and Digital Transformation
Healthcare & Pharmaceuticals healthcare-and-pharmaceuticals
Multiple Chart
LEK
View slide
The slide includes two column charts depicting revenue and asset growth in CHF bn, with notable CAGR and net new assets figures. Bullet points detail the record growth and strategic initiatives driving organic expansion in the APAC region.
Market Analysis and Trends
Financial Services
The slide showcases the strong organic growth in APAC wealth management, highlighting significant revenue and asset increases. It discusses the strategic initiatives and market conditions that have contributed to this record growth, emphasizing the region's potential.
APAC, organic growth, wealth management, revenue, assets
false
Market Analysis and Trends
Financial Services financial-services
Multiple Chart
Credit Suisse
View slide
The slide features column charts that present the adoption rates of patient-facing digital solutions in hospitals across various APAC markets, including patient information systems and remote patient monitoring.
Technology and Digital Transformation
Healthcare & Pharmaceuticals
The slide illustrates the usage of patient-facing digital solutions in hospitals across APAC, focusing on systems like patient information and booking, in-room patient systems, specialty care consultations, and remote patient monitoring.
APAC, patient-facing, digital solutions, hospitals, adoption
false
Technology and Digital Transformation
Healthcare & Pharmaceuticals healthcare-and-pharmaceuticals
Multiple Chart
LEK
View slide
The slide shows column charts representing the adoption rates of physician support systems, such as medication management systems and clinical decision support tools, in hospitals across different APAC regions.
Technology and Digital Transformation
Healthcare & Pharmaceuticals
The slide focuses on the adoption of physician support systems like medication management systems, clinical workflow management systems, and clinical decision support tools across hospitals in APAC, noting lower adoption rates in Japan.
APAC, physician support, hospitals, adoption, digital tools
false
Technology and Digital Transformation
Healthcare & Pharmaceuticals healthcare-and-pharmaceuticals
Multiple Chart
LEK
View slide
Column chart showing the percentage of organizations currently using API management solutions, those planning to use, and those with no plans. The majority currently use API management solutions.
Operational Efficiency
Technology & Software
The slide presents statistics on the adoption of API management solutions by organizations, indicating that over two-thirds currently use these solutions, with a smaller percentage planning to adopt them in the future.
API management, adoption, organizations, statistics
false
Operational Efficiency
Technology & Software technology-and-software
Single Chart
Gartner
View slide
Column chart showing the demand projection for various API-related roles over the next 12 months, including Software Developer, DevOps Engineer, and API Engineer, with a breakdown of current roles and future plans.
Human Resources and Talent Management
Technology & Software
The slide analyzes the demand for different API-related roles in software development, indicating which roles are likely to see increased hiring and which ones will remain stable or decrease.
API roles, demand, software development, projections
false
Human Resources and Talent Management
Technology & Software technology-and-software
Single Chart
Gartner
View slide
Column chart detailing the usage plans for different types of APIs, including Internal APIs, APIs by third parties, Private APIs, and Public APIs. The chart segments into categories: No plans, Plan to use, and Currently use.
Operational Efficiency
Technology & Software
The slide presents a survey result showing the adoption rates and future plans for various types of APIs, highlighting the predominance of internal APIs and public/external APIs.
APIs, survey, internal, external, adoption
false
Operational Efficiency
Technology & Software technology-and-software
Multiple Chart
Gartner
View slide
Three-column layout comparing AR/VR impact over time, with isometric graphics of AR and VR, and a maturity level bar.
Market Analysis and Trends
Technology & Software
Discusses AR and VR trends with a timeline from near to long-term impact, focusing on the transition from enterprise to consumer use and enhanced interaction in the real world.
AR, VR, trends, enterprise, consumer, interaction, timeline
false
Market Analysis and Trends
Technology & Software technology-and-software
Header Vertical
McKinsey
View slide
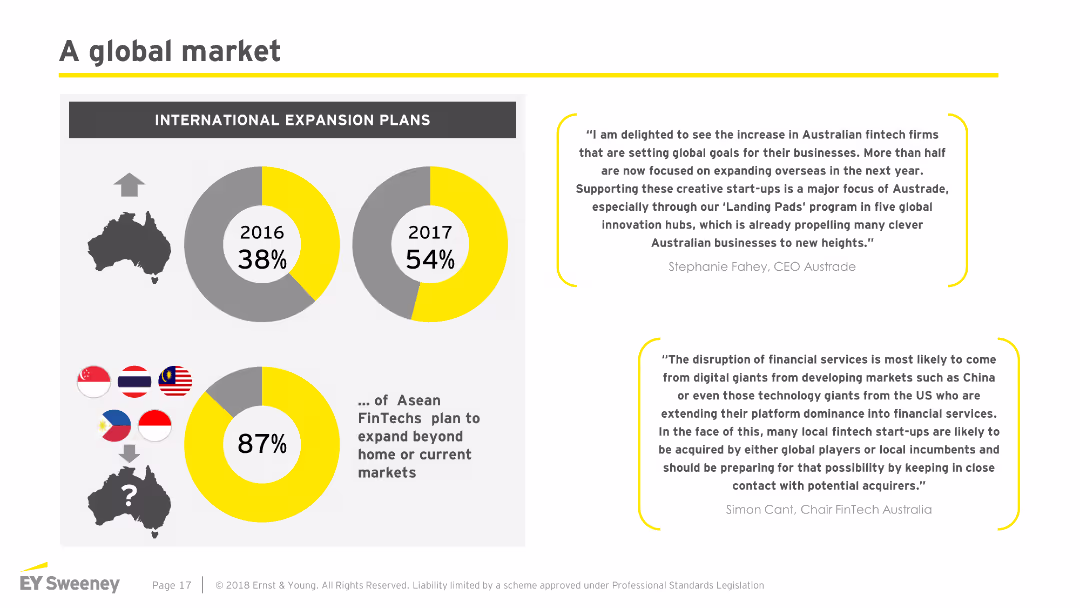
The slide features three circular graphs showing percentages of international expansion plans for ASEAN FinTechs, and two quotes.
Market Analysis and Trends
Financial Services
The slide discusses the increase in international expansion plans among ASEAN FinTech firms, highlighting statistics for 2016 and 2017, and includes expert quotes.
ASEAN, FinTech, expansion, global, market analysis, trends, international, quotes, statistics, 2017
false
Market Analysis and Trends
Financial Services financial-services
Multiple Chart
EY
View slide
Three large interconnected circles with statistics and an ASEAN logo in the center against a bold red background.
Market Analysis and Trends
Financial Services
This slide projects ASEAN's economic growth, demographic details, and future outlook, with a focus on the young working population and literacy rates. It's suitable for illustrating ASEAN's potential as a growing economic power and discussing investment opportunities.
ASEAN, economic growth, demographics, young population, literacy, investment opportunities, outlook, economic power
false
Market Analysis and Trends
Financial Services financial-services
Boxed
Kearney
View slide
A vibrant, illustrative cover with bold lettering and a detailed isometric graphic depicting various business scenes.
Organizational Structure and Change
Professional Services
This cover slide introduces a playbook on talent management within the ASEAN region, emphasizing growth and scalability. It's designed to grab attention with its striking visual elements, setting the stage for a discussion on human resources and talent retention strategies.
ASEAN, talent management, growth, scale, playbook, human resources, retention, cover slide, illustration
false
Organizational Structure and Change
Professional Services professional-services
Title
Kearney
View slide
This slide contains four column charts and a set of small data tables. The charts are used to compare different types of capital requirements and their respective buffers at a given point in time, alongside future projections for capital in graphical and tabular formats.
Risk Assessment and Management
Financial Services
The slide discusses the management of AT1 and T2 capital needs across the total capital structure, emphasizing the strategic approach to maintaining buffer levels to manage financial risks and requirements effectively.
AT1, T2, capital management, buffer, projections
false
Risk Assessment and Management
Financial Services financial-services
Multiple Chart
Barclays
View slide
This slide is visually dense with column charts comparing different financial metrics from 2014 and 2019. It employs color coding to distinguish between the years.
Operational Efficiency
Financial Services
It analyzes the impact of secular trends on various financial services and how a company can navigate through them. It’s meant for discussing strategies in overcoming industry challenges.
AUM, commission rates, trading volume, net revenue
false
Operational Efficiency
Financial Services financial-services
Multiple Chart
JP Morgan
View slide
Column chart with labeled segments showing changes in Assets Under Management (AUM) over time.
Financial Performance
Financial Services
The slide shows the AUM movement within Macquarie Asset Management, detailing the effects of various business activities and market conditions. This visual aids in the analysis of asset growth and investment strategies, suitable for investor updates and strategic planning discussions.
AUM, investment, growth, assets, management
false
Financial Performance
Financial Services financial-services
Single Chart
Morgan Stanley
View slide
Features two column charts: Left chart shows firmwide AUS in trillions from 2019 to Q1 2022. Right chart illustrates firmwide management and other fees in billions from 2019 to 2024 targets. An arrow indicates a CAGR of +12%.
Financial Performance
Financial Services
This slide analyzes the growth in assets under supervision (AUS) and associated fees over time, projecting a continuous upward trend. It presents past performance and future targets, positioning the firm's growth within the financial services industry.
AUS growth, fee analysis, financial performance, CAGR, projections, column chart
false
Financial Performance
Financial Services financial-services
Multiple Chart
Goldman Sachs
View slide
A bar chart showing potential reach of the TV screen by source for different age groups, with a focus on AVOD reach and its incremental gain.
Market Analysis and Trends
Media & Entertainment
The slide highlights that AVOD content has the greatest reach potential among younger viewers, showing significant incremental gains in audience reach.
AVOD, reach, potential, younger viewers, incremental gain
false
Market Analysis and Trends
Media & Entertainment media-and-entertainment
Multiple Chart
Nielsen
View slide
This slide has multiple column charts displaying revenue, income, and assets, with key financial metrics highlighted on the right.
Financial Performance
Financial Services
Demonstrates consistent growth in Asset Wealth Management, represented by yearly performance data and growth trends in bar graphs, intending to convey JPMorgan's financial stability and success over a decade.
AWM, financial performance, growth, JPMorgan, bar graphs
false
Financial Performance
Financial Services financial-services
Multiple Chart
JP Morgan
View slide
The slide includes a quote, a bar chart, and a conclusion section. The background features an abstract visual with a burst of colors.
Mergers and Acquisitions
Financial Services
The slide discusses the role of communication teams in acquisitions, emphasizing their importance throughout the transaction lifecycle.
Acquisitions, communication, stakeholder, HR, IR, integration, synergies, corporate, lifecycle, challenges
false
Mergers and Acquisitions
Financial Services financial-services
Mixed Chart
IPSOS
View slide
The slide features text with a survey bar chart and an image illustrating the importance of communication in acquisitions and stakeholder management.
Mergers and Acquisitions
Professional Services
Analyzes the role of corporate communications in successful acquisitions, emphasizing the need for stakeholder management and communication strategies.
Acquisitions, stakeholder communication, survey, mergers, corporate strategy
false
Mergers and Acquisitions
Professional Services professional-services
Mixed Chart
IPSOS
View slide
Combines text blocks and icons to outline strategies for boosting sales effectiveness and enabling multi-platform sales in the advertising industry.
Strategic Planning
Media & Entertainment
Discusses methods to enhance the effectiveness of ad sales and enable sales across multiple platforms, emphasizing automation and audience engagement.
Ad Sales, Effectiveness, Multi-platform, Automation, Audience Engagement, Advertising, Strategy, Sales Optimization
false
Strategic Planning
Media & Entertainment media-and-entertainment
Header Horizontal
Accenture
View slide
The slide is divided into textual content and infographic elements with percentage figures and pictograms related to agility and talent. Green and grey color highlights are used for emphasis.
Organizational Structure and Change
Professional Services
Discusses the Adaptable Organization (AO) as a shift in management philosophy to increase agility through empowered networks of teams. It points out the current state of digital disruption, organizational agility, leadership, and the need for new talent within professional services.
Adaptable Organization, management, agility, talent, disruption, teams
false
Organizational Structure and Change
Professional Services professional-services
Linear Flow
Deloitte
View slide
Bar chart listing additional services consumers plan to acquire with their next vehicle, including insurance and roadside assistance. Simple and clean presentation.
Product and Service Analysis
Transportation & Logistics
This slide outlines the most common additional services that vehicle consumers intend to purchase or subscribe to, highlighting the high demand for vehicle insurance and roadside assistance.
Additional services, consumer planning, vehicle insurance, roadside assistance
false
Product and Service Analysis
Transportation & Logistics transportation-and-logistics
Single Chart
Deloitte
View slide
The slide uses funnel diagrams to represent market size and opportunities across banking sectors, complemented by ROE accretion information. The visual elements are clear and informative, using contrasting colors for different sectors.
Market Analysis and Trends
Financial Services
This slide assesses potential market opportunities and the expected return on equity (ROE) in various financial sectors. It implies a focus on understanding market size and shares to drive strategic growth and profitability within transaction banking, wealth management, and consumer sectors.
Addressable market, Market size, ROE, Financial sectors, Profitability
false
Market Analysis and Trends
Financial Services financial-services
Table
Goldman Sachs
View slide
The slide includes a table and bar charts showing different levers in administration and overhead with corresponding activity levels and trends.
Operational Efficiency
Professional Services
Discusses the lesser relevance of administration and overhead levers, focusing on corporate structures, back-office services, and staffing costs.
Administration, Overhead, Corporate Structures, Trends
false
Operational Efficiency
Professional Services professional-services
Single Chart
Roland Berger
View slide
This slide is dominated by a blue and turquoise bar graph comparing merchant intentions for digital financial services usage. The title and a brief introductory text are placed at the top, and a source citation is at the bottom. The graph is detailed with percentages, making it dense in information.
Market Analysis and Trends
Financial Services
The slide details the expectations of digital merchants towards the adoption of digital financial services over the next couple of years. It specifically quantifies the percentage of merchants likely to increase or maintain their usage of services like digital payments, remittance, insurance, and lending. The purpose of the slide is to convey future usage trends among digital merchants, which is crucial for forecasting and strategic planning in the financial services industry.
Adoption, Digital Merchants, Financial Services, Trends, Payments, Remittance, Insurance, Lending, Growth, Statistics
false
Market Analysis and Trends
Financial Services financial-services
Single Chart
Bain
View slide
Simple, clean design with a complex network graphic, representing interconnectedness and the concept of advanced connectivity.
Industry Overview
Technology & Software
Dedicated to the theme of advanced connectivity, it signals the beginning of a deep dive into this specific tech trend.
Advanced Connectivity, Technology, Trends, Network, Interconnection, Outlook
false
Industry Overview
Technology & Software technology-and-software
Title
McKinsey
View slide
Contains a line chart showing historical shifts between digital and traditional advertising spends. Detailed annotations explain shifts in spending and digital growth.
Strategic Planning
Media & Entertainment
Discusses historical and future trends in advertising spend, emphasizing the transition from traditional to digital platforms and strategies to future-proof ad sales.
Advertising, Digital, Traditional, Spending Trends, Strategic Planning, Future-proof, Media, Transition
false
Strategic Planning
Media & Entertainment media-and-entertainment
Single Chart
Accenture
View slide
Slide features two line charts comparing changes in advertising spending and GDP over time. Text blocks provide contextual information and a global perspective on economic impacts on advertising.
Strategic Planning
Media & Entertainment
Analyzes the disproportionate impact of economic shocks on advertising spend compared to GDP, highlighting historical trends and predicting future behaviors in the advertising market.
Advertising, GDP, Economic Shock, Impact, Historical Trends, Future Prediction, Media, Global Perspective
false
Strategic Planning
Media & Entertainment media-and-entertainment
Single Chart
Accenture
Previous
Loading...
Hold On!
We are searching in our database
If nothing, comes up, please try different filters!
Column Chart
Heatmap
Chevron
Org Chart
Infographic
Callouts
Timeline
List
Graphic
Picture
Process Flow
Diagram
Paragraph
Map
Table
Framework
Subtitle
Takeaway Box
Icon
Other Chart
Radar Chart
Waterfall Chart
Mekko Chart
Pie Chart
Scatter Plot
Line Chart
Bar chart
Bullet points
Create a FREE account to continue browsing
Receive Instant Access to 8,000+ of the internet's best slides
First Name
Last Name
Email
Password
I agree to all
Terms & Privacy Policy
Thank you! Your submission has been received!
Oops! Something went wrong while submitting the form.
Have an account?
Sign in
Upgrade to PRO to Save slides
Advanced Search and Filters
Access to 8,000+ slides
Access to Category Pages
Save/Bookmark Slides
PowerPoint Template Library
(Coming Soon)
Pick a Plan
MONTHLY
$12/month
Billed every month, Cancel anytime.
YEARLY
$9/year
Billed $108 annually, Cancel anytime.
Checkout for $12/month
Checkout for $108/yr
Secured by Stripe | AES-256 bit encryption