My Account
My Slides
Leave Feedback
Login
Logout
Get Started
Browse all Slides
Browse Slides Pro
Create a FREE Account
Instant access to 1,000+ real slides from top companies like McKinsey, BCG, Goldman Sachs, Google and many more!
First Name
Last Name
Email
Password
I agree to all
Terms & Privacy Policy
Thank you! Your submission has been received!
Oops! Something went wrong while submitting the form.
Have an account?
Sign in
Welcome,
Welcome
PRO
Show Featured Only
Checkbox 8
Companies
Mckinsey
Bain
BCG
EY
Deloitte
Accenture
PwC/Strategy&
JP Morgan
Goldman Sachs
Morgan Stanley
Citigroup
Deutsche Bank
Barclays
LEK
Kearney
Oliver Wyman
Booz Allen Hamilton
Gartner
IPSOS
Nielsen
Slide type
Text Only
Linear Flow
Vertical Flow
Single Chart
Header Horizontal
Mixed Chart
Header Vertical
Pillar
Multiple Chart
Graphic
Agenda
Title
Table
Framework
Industry
Technology & Software
Financial Services
Retail & E-commerce
Consumer Goods
Industrial & Manufacturing
Transportation & Logistics
Telecommunications
Real Estate & Construction
Hospitality & Tourism
Professional Services
Education & Training
Media & Entertainment
Agriculture & Food Production
Healthcare & Pharmaceuticals
Environmental Services & Sustainability
Government & Public Sector
Use Case
Mergers and Acquisitions
Performance Metrics and KPIs
Client Case Studies
Competitive Landscape
Corporate Finance and Valuation
Product and Service Analysis
Customer and Market Segmentation
Organizational Structure and Change
Industry Overview
Regulatory and Compliance
Risk Assessment and Management
Investment Analysis
Organizational Structure and Change
Human Resources and Talent Management
Financial Performance
Market Analysis and Trends
Sales and Business Development
Human Resources and Talent Management
Clear all
Thank you! Your submission has been received!
Oops! Something went wrong while submitting the form.
Tag
View slide
Contains detailed text along with a world map illustrating 'DALYs' attributable to ambient air pollution per 100,000 population in 2016, and a bar chart showing data on EU energy-related CO2 emissions over time.
Regulatory and Compliance
Environmental Services & Sustainability
Provides an overview of the impacts of air quality on public health, focusing on DALY metrics to illustrate the global burden of disease linked to air pollution. Discusses the role of monitoring and policy in improving air quality standards.
Air Quality, Public Health, Pollution, DALYs
false
Regulatory and Compliance
Environmental Services & Sustainability environmental-services-and-sustainability
Graphic
PwC/Strategy&
View slide
Pie chart and bar graphs comparing the purchasing triggers for offline and online airline buyers.
Market Analysis and Trends
Transportation & Logistics
Evaluates reasons why buyers choose offline vs. online purchasing for airlines, with emphasis on trust and transaction value.
Airlines, Trust, Onsite Payment, Online Buying, Offline Purchasing, Transaction Value
false
Market Analysis and Trends
Transportation & Logistics transportation-and-logistics
Mixed Chart
BCG
View slide
The slide contains a column chart showing market concentration levels across different access modes using an alternative approach, which considers outlet homepages within the last 5 steps and excludes subsequent visits. Annotations provided.
Market Analysis and Trends
Media & Entertainment
This slide examines market concentration levels (HHI) by access mode using an alternative approach that includes outlet homepages within the last 5 steps before reaching news articles and excludes subsequent visits, offering insights into media concentration.
Alternative Approach, Market Concentration, HHI, Column Chart, Access Mode
false
Market Analysis and Trends
Media & Entertainment media-and-entertainment
Single Chart
IPSOS
View slide
Contains tables and bullet points detailing alternative investments, their average AUS, and effective fees, alongside column chart summarizing historical principal investments rollforward.
Investment Analysis
Financial Services
Analyzes the alternative investment portfolio's performance, with a focus on average assets under supervision and fee structures. It's aimed at investors seeking detailed information on the sector's financial dynamics and investment potential.
Alternative Investments, AUS, Effective Fees, Corporate Equity, Hedge Funds, Principal Investments, Investment Portfolio, Fee Structure
false
Investment Analysis
Financial Services financial-services
Mixed Chart
Goldman Sachs
View slide
Featuring a title, tables with detailed financial data, and a column chart on historical principal investments, the slide has a moderate level of visual complexity appropriate for conveying detailed information.
Investment Analysis
Financial Services
Targets alternative investment performance within asset management, detailing average AUS and effective fees. It's used for assessing investment strategies, updating investors, or guiding financial planning. Includes management fees and fundraising achievements.
Alternative Investments, AUS, Effective Fees, Fundraising
false
Investment Analysis
Financial Services financial-services
Mixed Chart
Goldman Sachs
View slide
Contains a series of column chart detailing alternative investment asset under supervision and fees, with an emphasis on blue tones. There are also numerical lists presenting additional data on on-balance sheet investments.
Investment Analysis
Financial Services
Highlights the firm's alternative investment strategies, including assets under supervision and associated fees, designed for financial consultants or potential investors looking at alternative investment opportunities and their performance.
Alternative Investments, AUS, Fees, Strategy
false
Investment Analysis
Financial Services financial-services
Mixed Chart
Goldman Sachs
View slide
Mix of tables, column charts, and a summary section, along with textual annotations and headings for each section.
Investment Analysis
Financial Services
Slide analyzes alternative investment assets, fees, and balance sheet allocations. Appropriate for discussions on investment strategy or financial planning.
Alternative Investments, Fees, Asset Allocation
false
Investment Analysis
Financial Services financial-services
Multiple Chart
Goldman Sachs
View slide
A world map marked with various investment locations, accompanied by logos representing different sectors such as private equity and real estate.
Investment Analysis
Financial Services
Elucidates on the diversity and scope of the company's alternative investment platform, indicating different sectors and regions involved in the investment strategy.
Alternative investments, private equity, real estate, global
false
Investment Analysis
Financial Services financial-services
Graphic
Goldman Sachs
View slide
The slide displays stacked column charts for client assets and various icons for future growth strategies. The colors include shades of brown, blue, and green, with clear data annotations.
Strategic Planning
Financial Services
The slide outlines the growth of client assets in alternative investments and the strategic initiatives for future growth in real estate, infrastructure, and private equity.
Alternatives, Innovation, Growth, Client Assets, Investment, Real Estate, Infrastructure, Private Equity, Strategy
false
Strategic Planning
Financial Services financial-services
Multiple Chart
JP Morgan
View slide
The slide features a column chart, a table, and color-coded timelines.
Investment Analysis
Financial Services
The slide presents the history and innovation in investment types over time with a focus on alternatives. It includes historical timelines, net IRR percentages, and growth in asset mix.
Alternatives, Investment, Growth, IRR, Timeline
false
Investment Analysis
Financial Services financial-services
Mixed Chart
JP Morgan
View slide
The slide includes text sections and a column chart showing the frequency of responding to work emails/messages outside normal working hours for Gen Zs and Millennials. It is organized to emphasize the challenges of disconnecting from work.
Operational Efficiency
Professional Services
This slide explores the impact of "always-on" workplaces on Gen Zs and Millennials, highlighting the frequency of responding to work communications outside normal hours and the main reasons behind this behavior, illustrating the struggle to disconnect from work.
Always-on, workplaces, disconnect, work emails, Gen Z, Millennials
false
Operational Efficiency
Professional Services professional-services
Multiple Chart
Deloitte
View slide
The slide consists of complex data tables and a map detailing epidemiological and economic statistics. It uses a clean layout with a mixture of red indicators for immediate visual attention and comparative statistics.
Market Analysis and Trends
Government & Public Sector
The slide provides a detailed look at epidemiological trends and policy indicators in the Americas. It can be used to inform decisions on travel restrictions and to gauge the overall state of the pandemic, offering insights into both the health situation and the resulting economic policies.
Americas, Epidemiology, Policies, COVID-19, Health Data, Economic Indicators, Travel, Statistics, Public Sector, Governance
false
Market Analysis and Trends
Government & Public Sector government-and-public-sector
Multiple Chart
McKinsey
View slide
The slide features sections on description, pros, cons, an overview of technology, and key feature estimates. It includes a simple diagram of the Haber-Bosch process and a box listing the conversion and reconversion costs and efficiencies of ammonia.
Product and Service Analysis
Energy & Utilities
This slide provides detailed information on the conversion of ammonia through the Haber-Bosch process. It highlights the advantages and disadvantages of using ammonia for hydrogen conversion, supported by key feature estimates.
Ammonia, Conversion, Hydrogen, Process, Analysis
false
Product and Service Analysis
Energy & Utilities energy-and-utilities
Diagram
Kearney
View slide
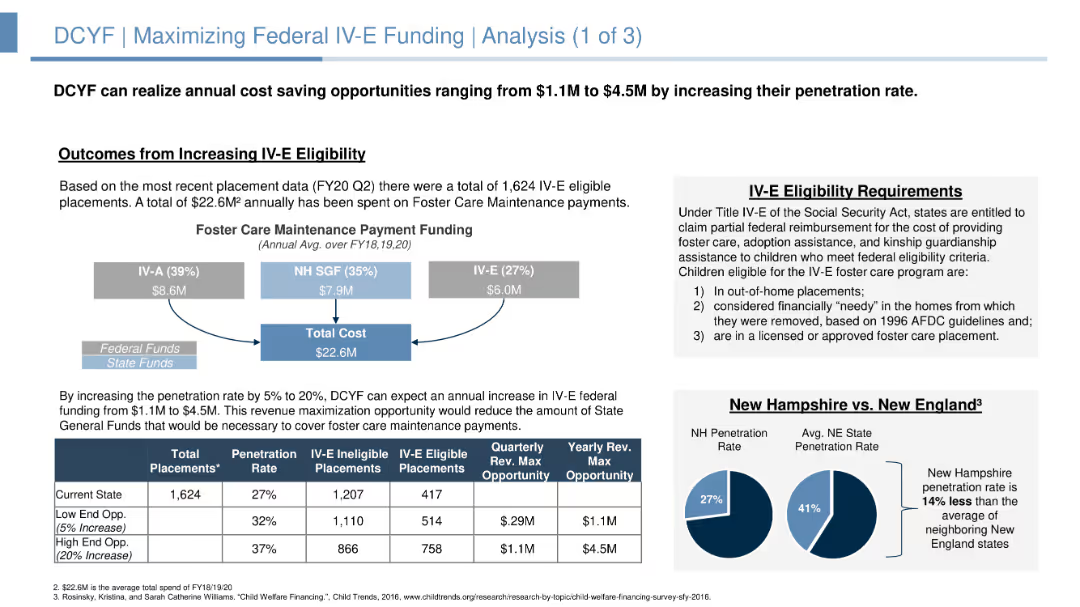
The slide includes a flow diagram illustrating funding distribution and a comparison between New Hampshire and New England penetration rates. The layout is moderately detailed with supporting data in boxes and charts.
Strategic Planning
Government & Public Sector
Slide includes charts, flow diagrams, and text blocks. Displays funding breakdowns and potential revenue opportunities.
Analyzes opportunities for increasing federal IV-E funding, detailing current funding, eligibility requirements, and potential revenue from increased penetration rates.
false
Strategic Planning
Government & Public Sector government-and-public-sector
Mixed Chart
Alvarez & Marsal
View slide
Assumptions in funding models for connectivity
Strategic Planning
Telecommunications
Detailed column charts with cost breakdowns and potential savings across various funding models, highlighting the assumptions made for each scenario. The design uses blue and green shades to represent different costs and savings, making it easy to differentiate.
Analyzes the impact of different funding assumptions on the potential success of school connectivity initiatives in Java, Bali, and Sumatra, emphasizing the role of governmental and community contributions.
false
Strategic Planning
Telecommunications telecommunications
Mixed Chart
BCG
View slide
A bar chart comparing sources of anxiety and stress among Millennials and Gen Z, with categories such as family welfare, financial future, and job prospects.
Market Analysis and Trends
Professional Services
This slide analyzes the primary sources of anxiety and stress among Millennials and Gen Z, comparing various factors like family welfare and financial future.
Anxiety, stress, Millennials, Gen Z, comparison, sources, family welfare, financial future, job prospects
false
Market Analysis and Trends
Professional Services professional-services
Mixed Chart
Deloitte
View slide
Timeline graphic illustrating Apple's evolution with images of products, financial highlights, and a narrative caption.
Technology and Digital Transformation
Technology & Software
Showcases Apple as a leading example of adopting as-a-service models, depicting their growth and services evolution over time.
Apple, as-a-service, business model, evolution, case study, subscription
false
Technology and Digital Transformation
Technology & Software technology-and-software
Linear Flow
Accenture
View slide
Contains bullet points detailing application modernization and infrastructure modernization with emphasis on cloud adoption and data center consolidation. It uses a purple color scheme and icons to denote different points, including the aim to decommission applications and adopt a multi-cloud strategy.
Operational Efficiency
Technology & Software
Focuses on the bank's initiative to modernize its software development and infrastructure to increase efficiency and cost-effectiveness.
Application Modernization, Infrastructure, Cloud Strategy, Efficiency, Optimization, Data Centers, Security, Financial Services
false
Operational Efficiency
Technology & Software technology-and-software
Table
JP Morgan
View slide
Features a column chart and three pie charts to depict Arion Bank’s international exposure and loan exposure in the Arctic region, alongside a timeline showing growth in loan exposure from 2020 to 2022. The slide effectively uses visual elements to highlight the growth and strategic importance of the Arctic region for the bank’s international portfolio.
Regulatory and Compliance
Financial Services
Focuses on Arion Bank's growing international exposure in the Arctic region, detailing significant investment opportunities due to abundant natural resources and tourism potential. The slide showcases the bank's commitment to diversifying its portfolio and highlights the strategic importance of the Arctic region in its overall international expansion strategy.
Arctic, banking, international exposure, investment opportunities
false
Regulatory and Compliance
Financial Services financial-services
Multiple Chart
Deutsche Bank
View slide
A slide that incorporates various icons and bullet points detailing technological trends such as AI, AR/VR, NFTs, and cryptocurrency, with case examples and potential applications.
Technology and Digital Transformation
Retail & E-commerce
Outlines the influence of AI, AR/VR, NFTs, and cryptocurrencies on sales and marketing, and the opportunities for hyperpersonalization and enhanced customer experiences.
Artificial Intelligence, AR, VR, Metaverse, NFTs, Cryptocurrency, Hyperpersonalization, Automation, Customer Engagement, Technological Trends
false
Technology and Digital Transformation
Retail & E-commerce retail-and-e-commerce
Graphic
BCG
View slide
This slide contains a circular diagram centering on artificial intelligence, branching out to subfields like machine learning and NLP, complemented by descriptions and use cases.
Technology and Digital Transformation
Technology & Software
Focusing on AI, the slide breaks down its notable technologies and subfields, such as machine learning and NLP, with real-world applications like facial recognition and speech assistance.
Artificial Intelligence, Machine Learning, NLP, Computer Vision, Deep Learning, Technology Trends
false
Technology and Digital Transformation
Technology & Software technology-and-software
Mixed Chart
McKinsey
View slide
Features a timeline graphic showing the progression of contract values over years, along with icons representing different business sectors.
Market Analysis and Trends
Technology & Software
This slide presents the growth of Experian's Ascend platform, illustrating its increasing contract value over time and its potential in the analytics market.
Ascend platform, market growth, analytics, contract value, business expansion
false
Market Analysis and Trends
Technology & Software technology-and-software
Linear Flow
Barclays
View slide
Organized in a three-column table listing different aspects of operational assessment, improvement, and restructuring across various companies in Asia.
Investment Analysis
Professional Services
This slide showcases a selection of performance improvement projects managed by Alvarez & Marsal in Asia, highlighting different sectors and approaches used.
Asia, Case Studies, Performance, Improvement, Projects
false
Investment Analysis
Professional Services professional-services
Table
Alvarez & Marsal
View slide
The slide includes two doughnut charts comparing Asia’s investment values for 2012 and 2016, highlighting the rise in China and Southeast Asia.
Market Analysis and Trends
Financial Services
Discusses the rapid increase in investment values within Asia, particularly in China and Southeast Asia, over the four-year period.
Asia, Investment, China, Southeast Asia, Trends
false
Market Analysis and Trends
Financial Services financial-services
Multiple Chart
Kearney
View slide
The slide shows a comparative analysis using two doughnut charts illustrating global investment values by region for 2012 and 2016.
Market Analysis and Trends
Financial Services
Highlights the growth of Asia in global investment values, showing significant increases from 2012 to 2016, emphasizing Asia’s growing market share.
Asia, Investment, Global Market, Trends
false
Market Analysis and Trends
Financial Services financial-services
Multiple Chart
Kearney
View slide
Lists key facts about the firm's Asian operations using bullet points and a simple map to indicate locations. The design is straightforward with blue highlights.
Market Analysis and Trends
Professional Services
Provides an overview of Alvarez & Marsal’s presence in Asia, detailing their office locations, years of operation, and team experience. The slide aims to position the firm as a seasoned player in the Asian market with extensive regional expertise.
Asia, market presence, senior team, operational experience, client portfolio
false
Market Analysis and Trends
Professional Services professional-services
Header Vertical
Alvarez & Marsal
View slide
A combination of text and a column chart displaying the growth of Asia's middle class compared to the rest of the world.
Strategic Planning
Professional Services
Highlights reasons to invest in Asia, backed by the rapid growth of its middle class, driving regional economic changes and opportunities.
Asia, middle class, investment, economic growth, strategy
false
Strategic Planning
Professional Services professional-services
Mixed Chart
Citigroup
View slide
The slide features a column chart comparing U/HNW wealth pool growth between APAC and the rest of the world. Additional metrics show the significant share of client wallet held by top firms in the region, with supporting bullet points on key trends.
Market Analysis and Trends
Financial Services
The slide projects substantial wealth growth in Asia, with top firms capturing a large share of client wallets. It highlights the trends driving this growth, including the rise of first and second-generation entrepreneurs and the increasing management of wealth pools by top players.
Asia, wealth growth, client wallet, top players, market trends
false
Market Analysis and Trends
Financial Services financial-services
Multiple Chart
Credit Suisse
View slide
The slide presents a combination of column charts and tables, detailing the number of IPOs and proceeds across the Asia-Pacific region. It includes stock exchange data and sector breakdowns.
Market Analysis and Trends
Financial Services
The slide examines the mixed momentum in the Asia-Pacific IPO market, with a focus on the leading growth in Indonesia and Japan. It provides comprehensive data on the number of IPOs, proceeds, and top stock exchanges and sectors.
Asia-Pacific IPOs, regional growth, stock exchanges, sector analysis, financial trends
false
Market Analysis and Trends
Financial Services financial-services
Multiple Chart
EY
View slide
The slide features multiple column charts and data tables showing IPO performance across major Asia-Pacific stock exchanges, sectors, and countries. The visuals are well-organized and detailed.
Market Analysis and Trends
Financial Services
This slide summarizes the IPO market performance in the Asia-Pacific region, highlighting strong performance from Mainland China and ASEAN markets, with detailed breakdowns by stock exchange and sector.
Asia-Pacific, IPO, stock exchange, performance, 2022
false
Market Analysis and Trends
Financial Services financial-services
Multiple Chart
EY
Previous
Loading...
Hold On!
We are searching in our database
If nothing, comes up, please try different filters!
Column Chart
Heatmap
Chevron
Org Chart
Infographic
Callouts
Timeline
List
Graphic
Picture
Process Flow
Diagram
Paragraph
Map
Table
Framework
Subtitle
Takeaway Box
Icon
Other Chart
Radar Chart
Waterfall Chart
Mekko Chart
Pie Chart
Scatter Plot
Line Chart
Bar chart
Bullet points
Create a FREE account to continue browsing
Receive Instant Access to 8,000+ of the internet's best slides
First Name
Last Name
Email
Password
I agree to all
Terms & Privacy Policy
Thank you! Your submission has been received!
Oops! Something went wrong while submitting the form.
Have an account?
Sign in
Upgrade to PRO to Save slides
Advanced Search and Filters
Access to 8,000+ slides
Access to Category Pages
Save/Bookmark Slides
PowerPoint Template Library
(Coming Soon)
Pick a Plan
MONTHLY
$12/month
Billed every month, Cancel anytime.
YEARLY
$9/year
Billed $108 annually, Cancel anytime.
Checkout for $12/month
Checkout for $108/yr
Secured by Stripe | AES-256 bit encryption