My Account
My Slides
Search by Category
Templates
View All Templates
Download Template Slides
Leave Feedback
Login
Logout
Get Started
Browse all Slides
Browse all Slides
Create a FREE Account
Instant access to 1,000+ real slides from top companies like McKinsey, BCG, Goldman Sachs, Google and many more!
First Name
Last Name
Email
Password
I agree to all
Terms & Privacy Policy
Thank you! Your submission has been received!
Oops! Something went wrong while submitting the form.
Have an account?
Sign in
Spark Your Next Big Idea with New Presentation Templates
VIEW ALL Templates
Welcome,
Welcome
PRO
Show Featured Only
Checkbox 8
Companies
Mckinsey
Bain
BCG
EY
Deloitte
Accenture
PwC/Strategy&
JP Morgan
Goldman Sachs
Morgan Stanley
Citigroup
Deutsche Bank
Barclays
LEK
KPMG
Kearney
Oliver Wyman
Booz Allen Hamilton
Gartner
IPSOS
Nielsen
Slide type
Text Only
Linear Flow
Vertical Flow
Single Chart
Header Horizontal
Mixed Chart
Header Vertical
Pillar
Multiple Chart
Graphic
Agenda
Title
Table
Framework
Industry
Technology & Software
Artificial Intelligence
Financial Services
Retail & E-commerce
Consumer Goods
Industrial & Manufacturing
Transportation & Logistics
Telecommunications
Real Estate & Construction
Hospitality & Tourism
Professional Services
Education & Training
Media & Entertainment
Agriculture & Food Production
Healthcare & Pharmaceuticals
Environmental Services & Sustainability
Government & Public Sector
Use Case
Mergers and Acquisitions
Performance Metrics and KPIs
Client Case Studies
Competitive Landscape
Corporate Finance and Valuation
Product and Service Analysis
Customer and Market Segmentation
Organizational Structure and Change
Industry Overview
Regulatory and Compliance
Risk Assessment and Management
Investment Analysis
Organizational Structure and Change
Human Resources and Talent Management
Financial Performance
Market Analysis and Trends
Sales and Business Development
Human Resources and Talent Management
Clear all
Thank you! Your submission has been received!
Oops! Something went wrong while submitting the form.
Tag
View slide
The slide outlines key strategies for leaders in sales and marketing, advocating for a customer-first approach and integration across functions with vibrant graphics and a clear layout.
Technology and Digital Transformation
Retail & E-commerce
Encourages leaders to personalize customer journeys and reinvent sales channels to stay competitive in
false
Technology and Digital Transformation
Retail & E-commerce retail-and-e-commerce
Vertical Flow
BCG
View slide
Incorporating charts and graphs, this slide provides a visual representation of population growth, arable land per person, and meat consumption trends.
Investment Analysis
Agriculture & Food Production
An analysis of agricultural market drivers globally, emphasizing the influence of population growth and dietary changes on the industry.
false
Investment Analysis
Agriculture & Food Production agriculture-and-food-production
Multiple Chart
EY
View slide
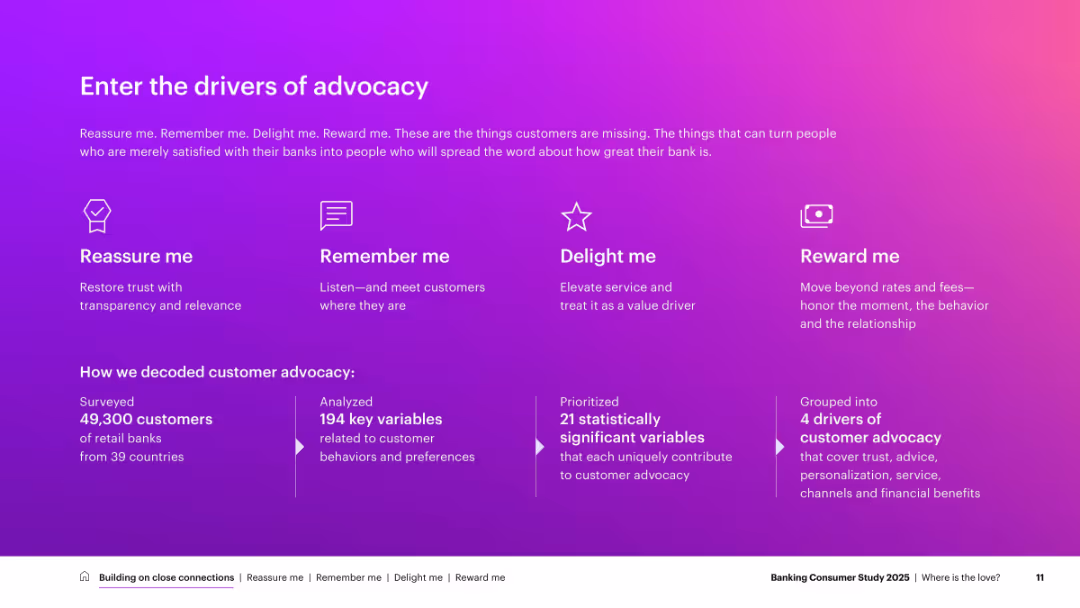
Gradient pink-purple background with white text; icons and labeled segments describing drivers; bottom section outlines research methodology
Strategic Planning
Financial Services
Identifies four main drivers of customer advocacy—Reassure me, Remember me, Delight me, Reward me—based on global banking study findings. Describes methodology used (49,300 surveyed, 194 variables analyzed) to derive 21 significant variables into 4 key groups.
false
Strategic Planning
Financial Services financial-services
Pillar
Accenture
View slide
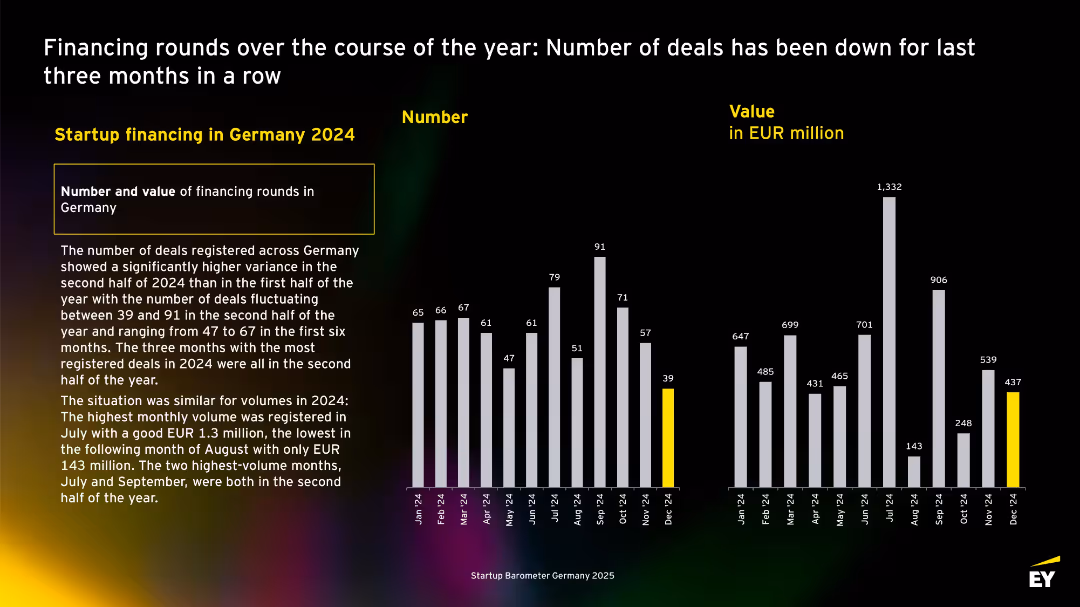
Monthly bar charts of deal numbers and values for 2024, with descriptive text on the left. Yellow highlight for December data.
Investment Analysis
Professional Services
Illustrates monthly fluctuations in startup deal counts and values for 2024. Highest activity was in Q3, while December marked the lowest. Emp
false
Investment Analysis
Professional Services professional-services
Multiple Chart
EY
View slide
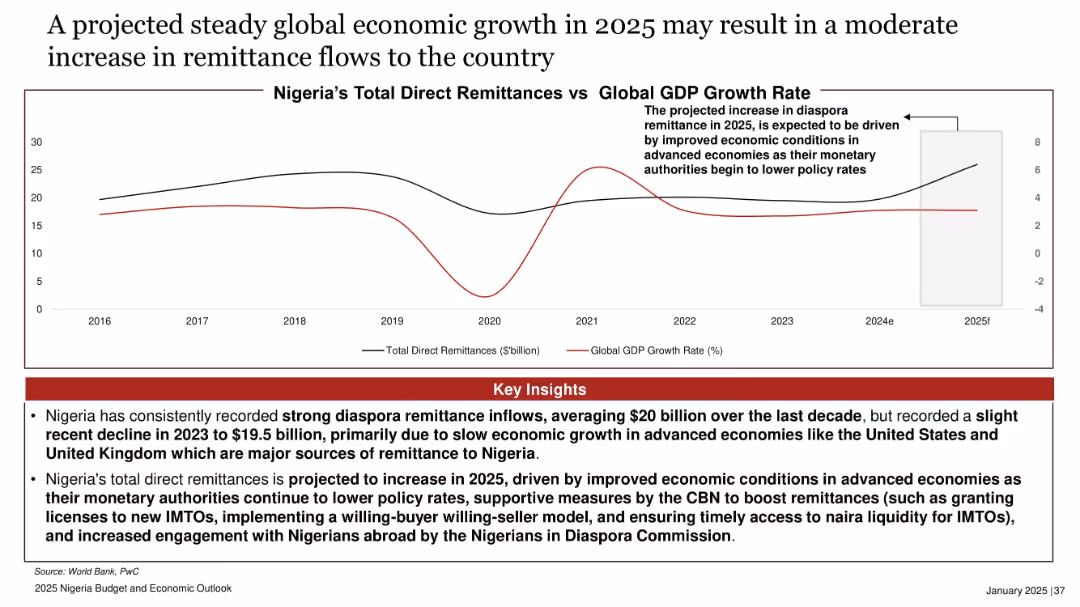
Duplicate of Slide 17812. Same dual-line chart and layout.
Market Analysis and Trends
Financial Services
Duplicate content: forecasted remittance increase in 2025 due to improved global growth and easing policy rates in source countries. Highlights CBN actions to support inflow.
(Same as Slide 17812)
false
Market Analysis and Trends
Financial Services financial-services
Mixed Chart
PwC/Strategy&
View slide
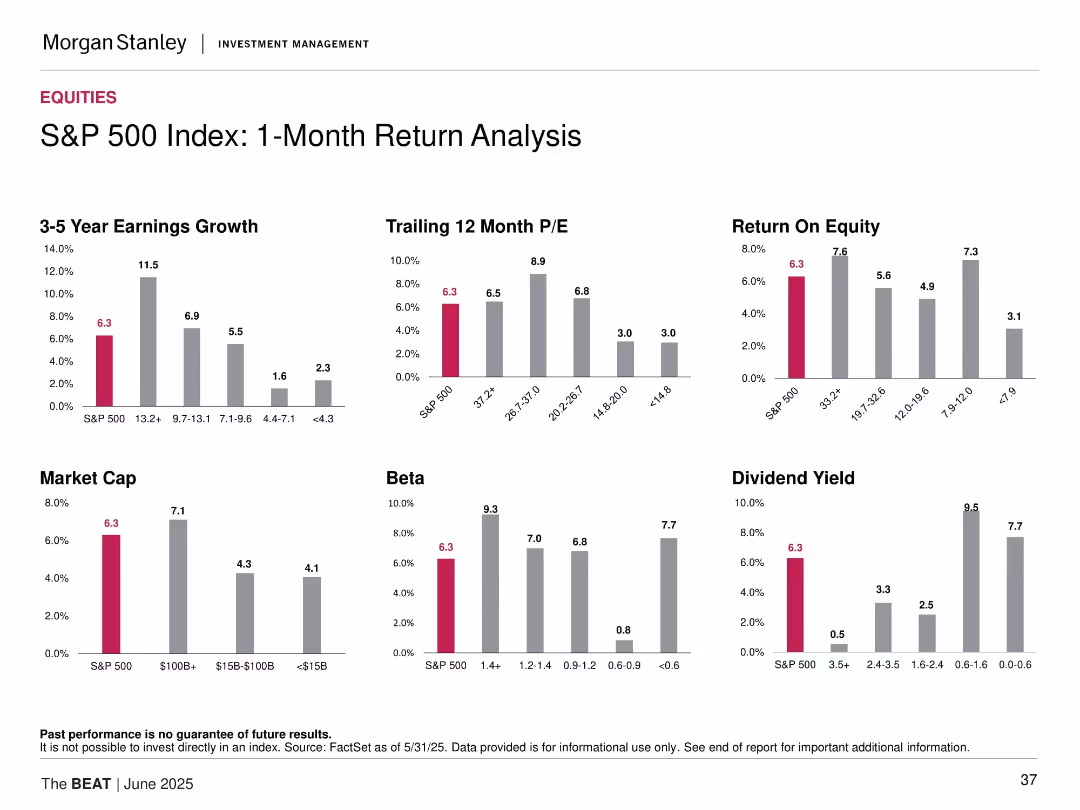
Grid of bar charts showing various metrics like ROE, P/E, dividend yield, earnings growth across different market cap and beta groups.
Performance Metrics and KPIs
Financial Services
This slide breaks down 1-month return data for the S&P 500 based on factors such as beta, market cap, and valuation. It compares the S&P 500's return against various cohorts and attributes performance to key financial metrics. Each subplot visualizes a different performance driver.
1-month return, S&P 500, financial metrics, ROE, dividend yield, beta, market cap, comparative analysis
false
Performance Metrics and KPIs
Financial Services financial-services
Multiple Chart
Morgan Stanley
View slide
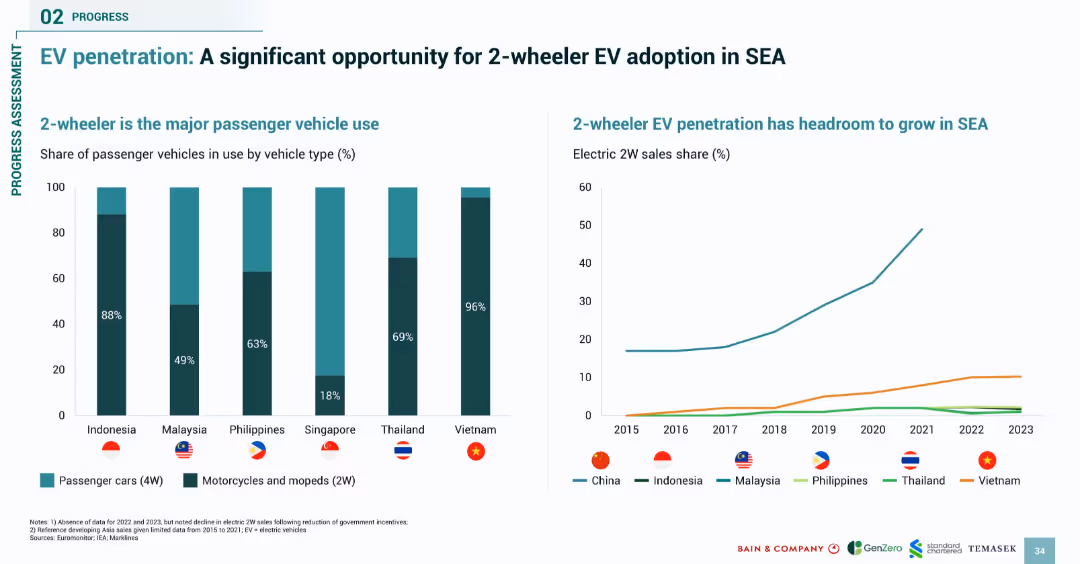
Dual-chart slide with a bar chart (vehicle type usage) and line chart (2W EV sales); clean modern layout
Market Analysis and Trends
Transportation & Logistics
This slide illustrates the dominance of 2-wheelers in Southeast Asia and the growth opportunity for 2W EVs. It compares current vehicle types in use and trends in 2W EV penetration, noting that countries like Vietnam have seen strong adoption compared to others.
2-wheeler, EV adoption, SEA, motorbikes, e-mobility, passenger vehicle use, electric scooters
false
Market Analysis and Trends
Transportation & Logistics transportation-and-logistics
Multiple Chart
Bain
View slide
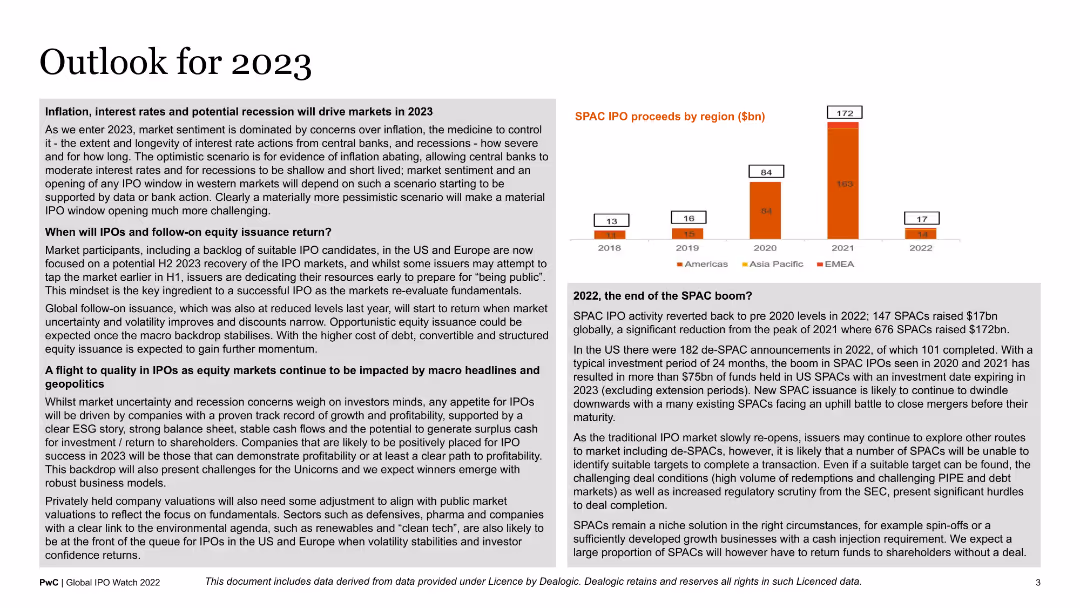
The slide contains a detailed text analysis on market expectations for 2023, accompanied by a small bar chart showing SPAC IPO proceeds by region from 2018 to 2022. It is text-heavy, with key points highlighted in bullet form for readability.
Strategic Planning
Financial Services
This slide outlines predictions for 2023 market trends, focusing on potential impacts of inflation, interest rates, and recession fears. It is aimed at market analysts and financial strategists planning for the upcoming year.
2023 outlook, market trends, SPAC IPOs, inflation, recession
false
Strategic Planning
Financial Services financial-services
Mixed Chart
PwC/Strategy&
View slide
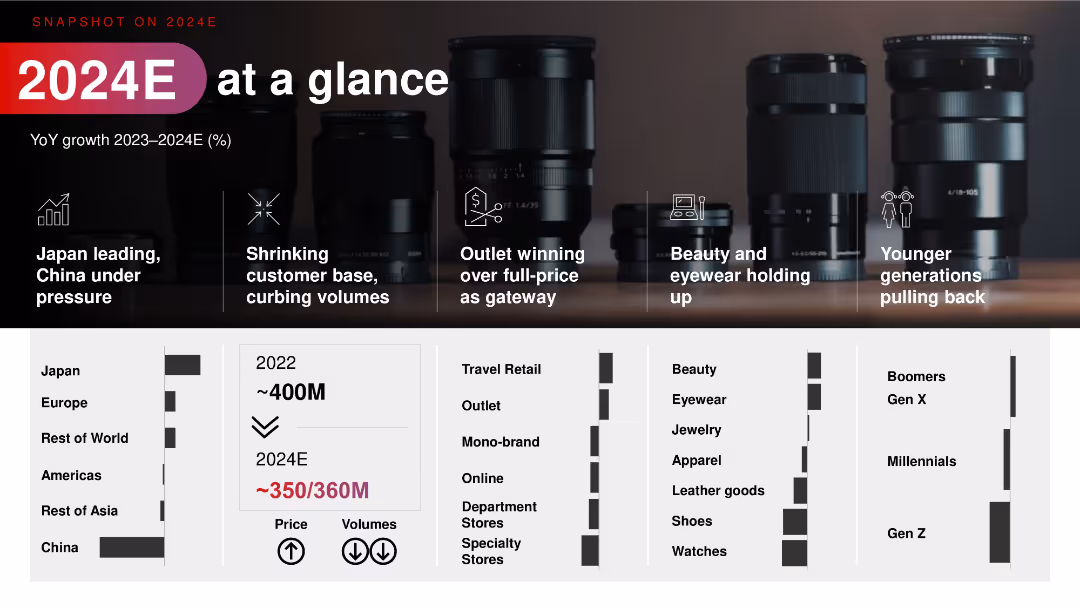
Visual collage of camera lenses in the background. Icons highlight 5 major themes, with a lower matrix showing segment and channel performance across regions and categories.
Strategic Planning
Consumer Goods
Offers a visual summary of 2024 luxury performance. Japan is leading while China is under pressure. Outlets outperform full-price stores. Eyewear and beauty hold strong, while Gen Z and Millennials are pulling back. Breakdowns by retail type, product category, and generation offer insights into shifting consumption behavior.
2024 summary, outlet channels, generational shifts, product trends, China, Japan
false
Strategic Planning
Consumer Goods consumer-goods
Mixed Chart
Bain
View slide
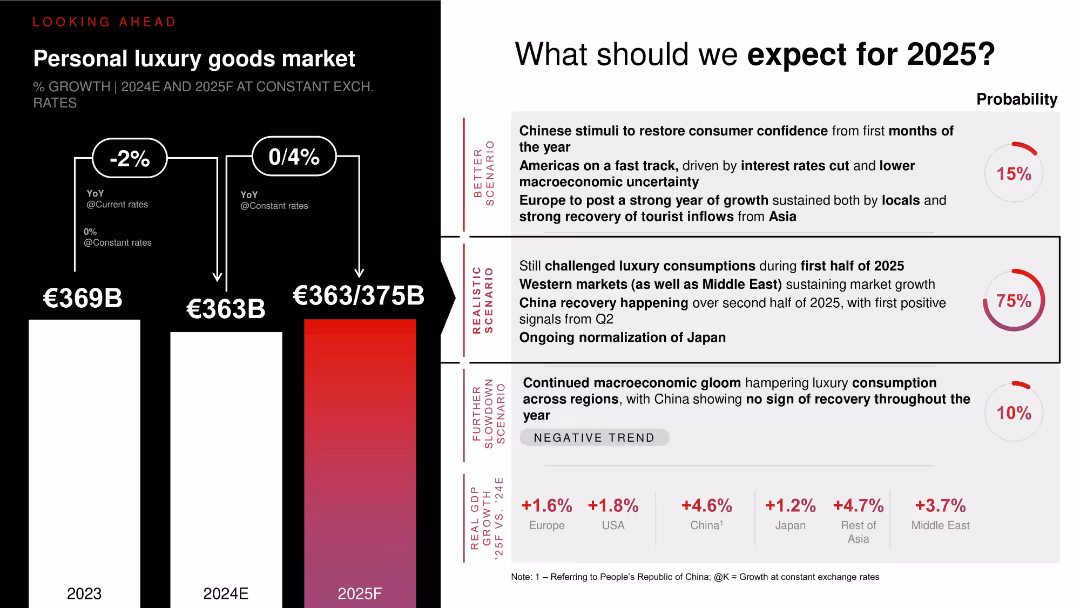
Vertical bar chart projecting 2025 scenarios with arrows and probability indicators (realistic, better, worse). Accompanied by scenario descriptions and macro trends.
Market Analysis and Trends
Consumer Goods
Outlines three potential scenarios for personal luxury goods market growth in 2025, with a realistic scenario (75% probability) expecting recovery led by China, Western markets, and Japan. Charts suggest flat to moderate growth (€363–375B). Also includes economic growth rates across regions to support expectations.
2025 forecast, luxury market, scenario planning, China recovery, global consumption trends
false
Market Analysis and Trends
Consumer Goods consumer-goods
Multiple Chart
Bain
View slide
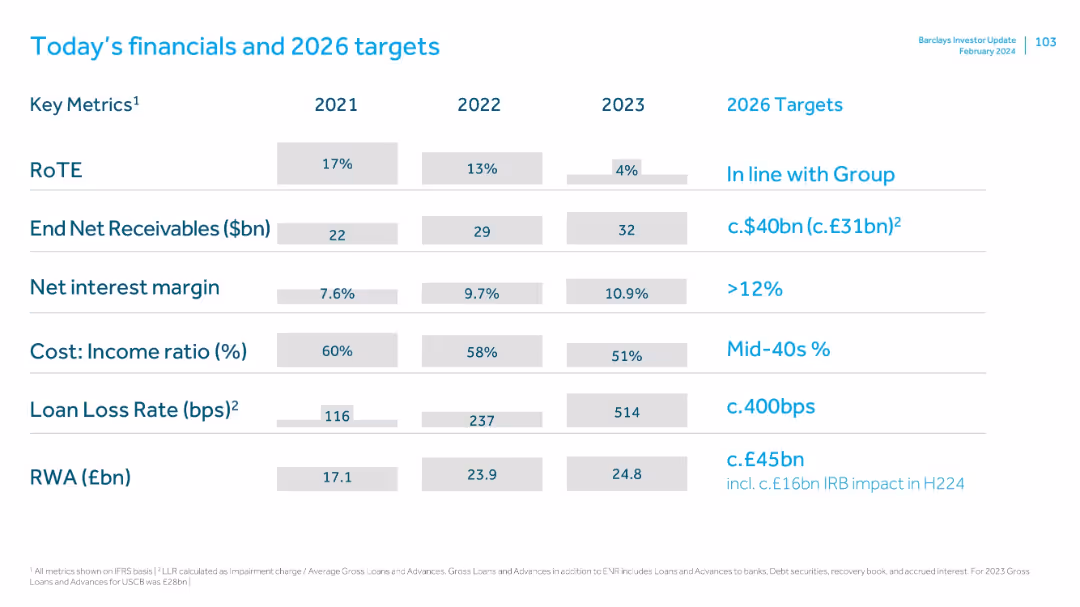
Tabular comparison of 2021–2023 metrics with 2026 targets. Uses grey and blue text to distinguish years vs goals.
Strategic Planning
Financial Services
Provides a consolidated snapshot of Barclays' current financials and 2026 strategic goals, showing targets for receivables, RoTE, margin, CIR, loan loss rate, and risk-weighted assets. Aligns expectations with broader Group objectives.
2026 targets, RoTE, receivables, margin, CIR, RWA, loan loss, financial planning
false
Strategic Planning
Financial Services financial-services
Single Chart
Barclays
View slide
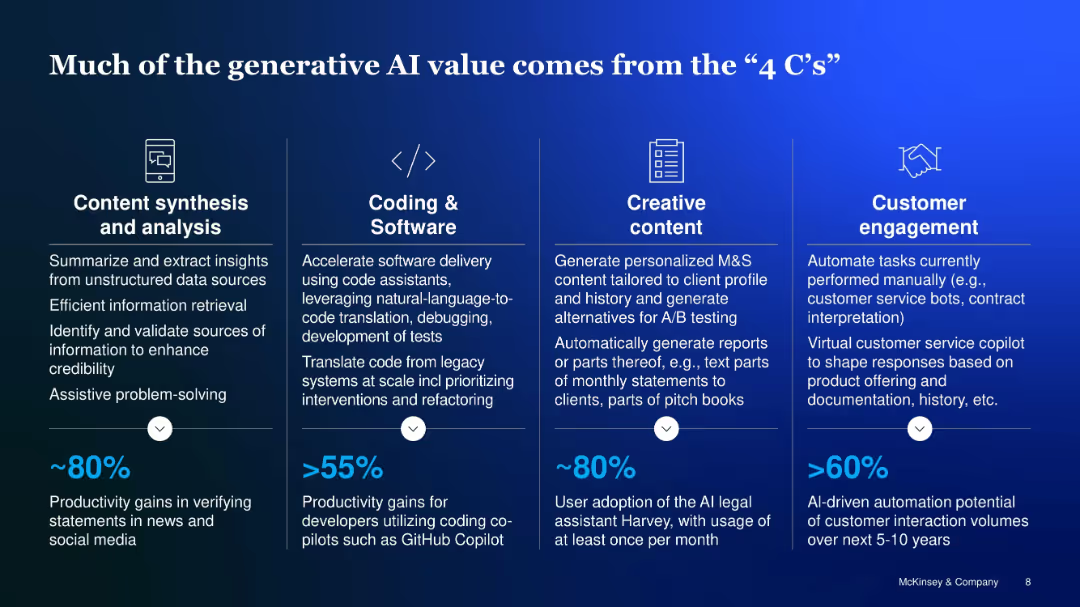
4-column layout, each for Content synthesis, Coding, Creative content, and Customer engagement
Operational Efficiency
Artificial Intelligence
Describes GenAI's value generation across four domains: synthesizing content, coding, creative personalization, and customer interaction. Each area includes specific use cases and productivity gain estimates.
4 Cs, content, coding, engagement, creativity, productivity
false
Operational Efficiency
Artificial Intelligence artificial-intelligence
Pillar
McKinsey
View slide
Contains column charts and bar charts detailing 3G/4G coverage in schools across different regions in Indonesia, and additional data on the proximity of schools to network nodes.
Strategic Planning
Telecommunications
Highlights the superior 4G coverage in Java, Bali, and Sumatra which facilitates better internet connectivity in schools compared to other regions.
4G coverage, Indonesia, Java, Bali, Sumatra, schools, internet connectivity
false
Strategic Planning
Telecommunications telecommunications
Multiple Chart
BCG
View slide
Features two sets of column charts comparing 4G download speeds and availability among major operators from 2018 to 2020. The visual style uses different colors for each operator to facilitate comparison. Annotations emphasize improvements in network quality.
Market Analysis and Trends
Telecommunications
Examines the discrepancies in 4G download speeds across various operators over time, highlighting how smaller operators are improving their services to remain competitive despite having similar levels of 4G network availability.
4G, download speed, network quality, operators, competition, service improvement
false
Market Analysis and Trends
Telecommunications telecommunications
Multiple Chart
BCG
View slide
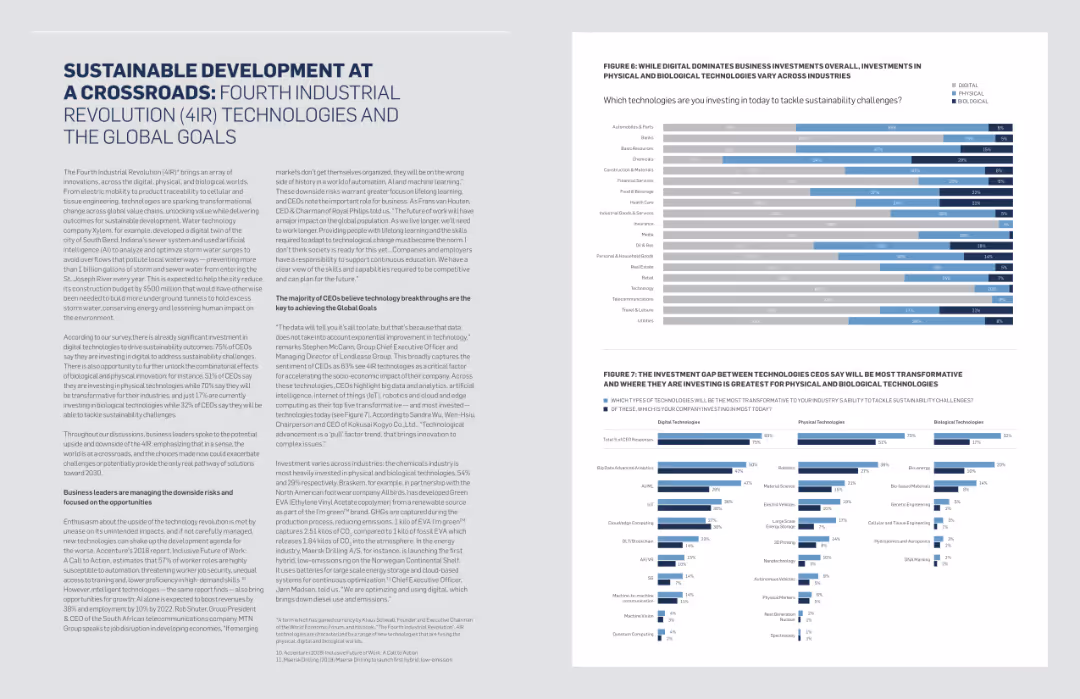
The slide includes a mix of text and two column charts. The charts display data on investments in technologies and their impact on sustainability challenges across industries.
Technology and Digital Transformation
Technology & Software
This slide highlights the role of Fourth Industrial Revolution technologies in achieving global goals, focusing on investment trends and sustainability challenges.
4IR, Technology, Sustainability, Investment, Global Goals, Digital Transformation, Industrial Revolution
false
Technology and Digital Transformation
Technology & Software technology-and-software
Multiple Chart
Accenture
View slide
Slide with a column chart detailing underlying PBT for 4Q23, with additional charts showing related metrics and financial performance for the same period.
Financial Performance
Financial Services
The slide provides an overview of UBS's underlying PBT for 4Q23, highlighting key financial metrics and performance indicators.
4Q23 PBT, financial performance, underlying profit, UBS quarterly results
false
Financial Performance
Financial Services financial-services
Mixed Chart
UBS
View slide
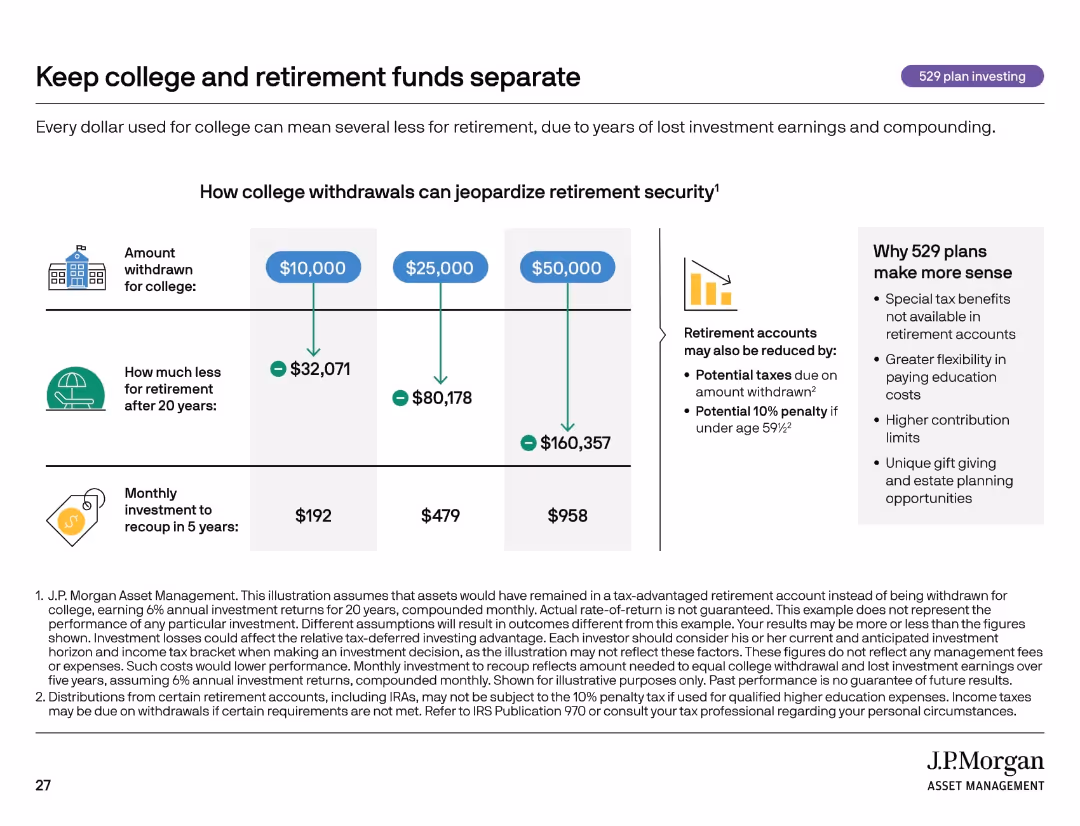
Informational slide with infographic-style design, three-column layout comparing withdrawal scenarios, side panel.
Strategic Planning
Financial Services
Highlights the long-term cost of withdrawing retirement funds to pay for college. It quantifies the loss to retirement savings and monthly investment needed to recoup those losses. Promotes using 529 plans for tax-advantaged education savings.
529 plan, retirement, education funding, compounding, taxes, investing
false
Strategic Planning
Financial Services financial-services
Mixed Chart
JP Morgan
View slide
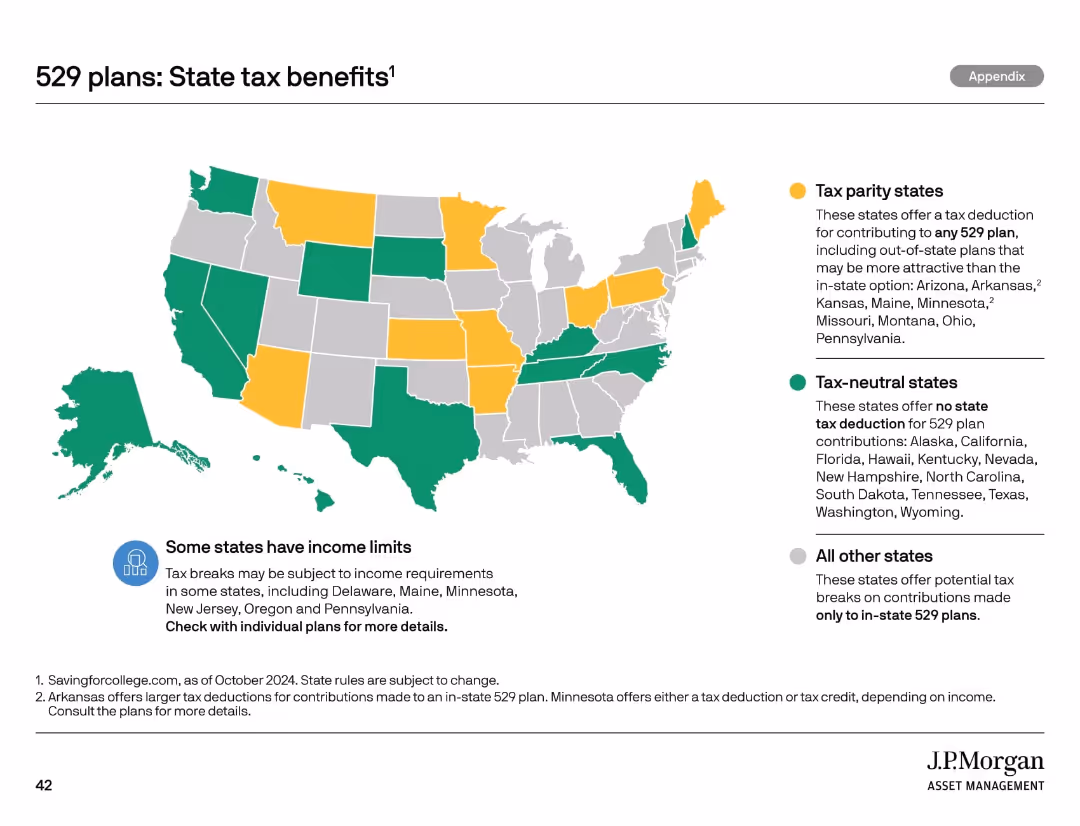
U.S. map color-coded by tax benefit categories. Text boxes explain tax rules and conditions per state.
Regulatory and Compliance
Financial Services
Displays the differences in state tax benefits for 529 plan contributions. Distinguishes between tax parity, tax-neutral, and in-state-only benefit states. Encourages checking local rules for contribution advantages.
529 plan, state tax, map, regulation, contributions
false
Regulatory and Compliance
Financial Services financial-services
Mixed Chart
JP Morgan
View slide
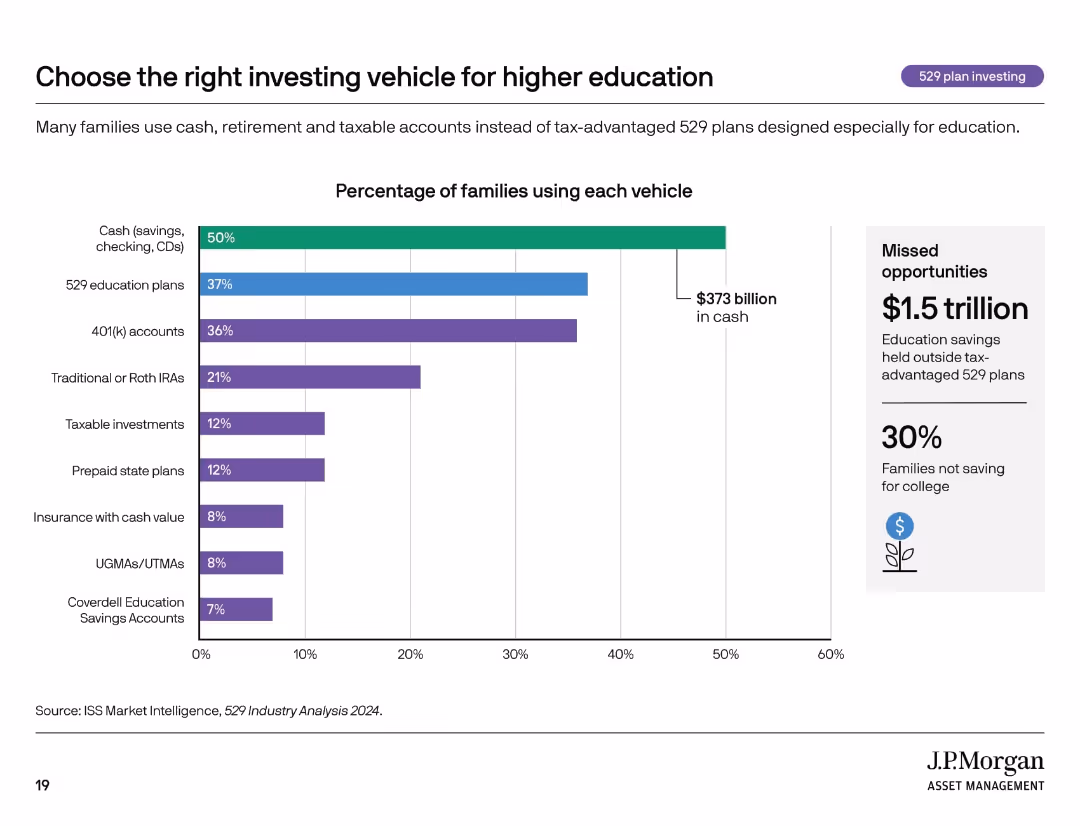
Horizontal bar chart with eight categories, includes monetary value and sidebar showing missed opportunity.
Investment Analysis
Financial Services
This slide outlines the most common savings vehicles families use for education and highlights underutilization of tax-advantaged 529 plans. It compares the percentage of families using different options, including cash, IRAs, and insurance, while emphasizing $1.5 trillion in missed savings efficiency.
529 plans, savings, education investing, cash savings, financial strategy
false
Investment Analysis
Financial Services financial-services
Mixed Chart
JP Morgan
View slide
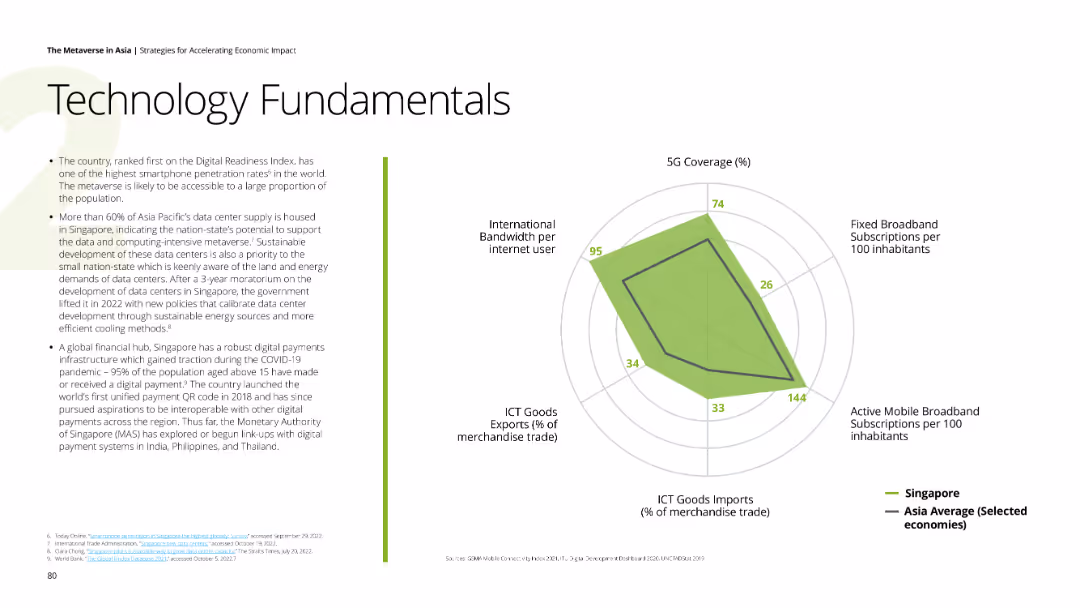
The slide features a radar chart comparing various metrics between Singapore and the Asia average, including 5G coverage, fixed broadband subscriptions, and ICT goods trade. It also includes textual information on the left side of the slide.
Technology and Digital Transformation
Telecommunications
Discusses Singapore’s strong digital infrastructure, high smartphone penetration rate, and the country's leading role in metaverse readiness and data center developments.
5G coverage, broadband, ICT exports, metaverse, digital infrastructure
false
Technology and Digital Transformation
Telecommunications telecommunications
Mixed Chart
Deloitte
View slide
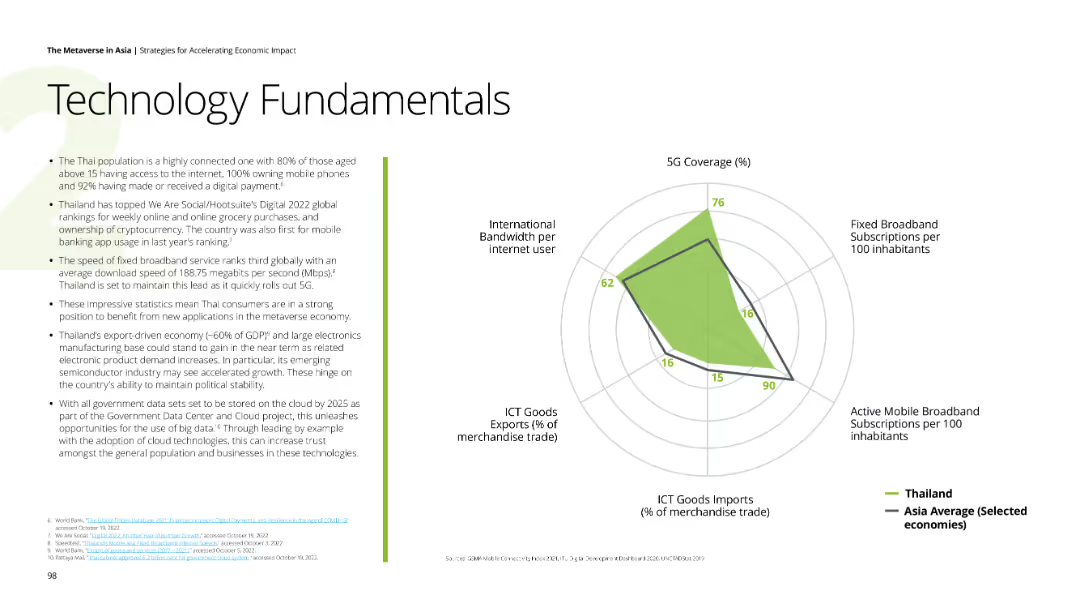
The slide features a radar chart comparing Thailand’s tech metrics against the Asia average. Textual information on the left discusses Thailand’s connectivity, broadband speed, and digital economy initiatives.
Technology and Digital Transformation
Telecommunications
Discusses Thailand’s technological advancements, including 5G coverage, broadband speed, and digital economy, with a focus on enhancing consumer and business tech use.
5G, broadband, digital economy, Thailand, connectivity
false
Technology and Digital Transformation
Telecommunications telecommunications
Mixed Chart
Deloitte
View slide
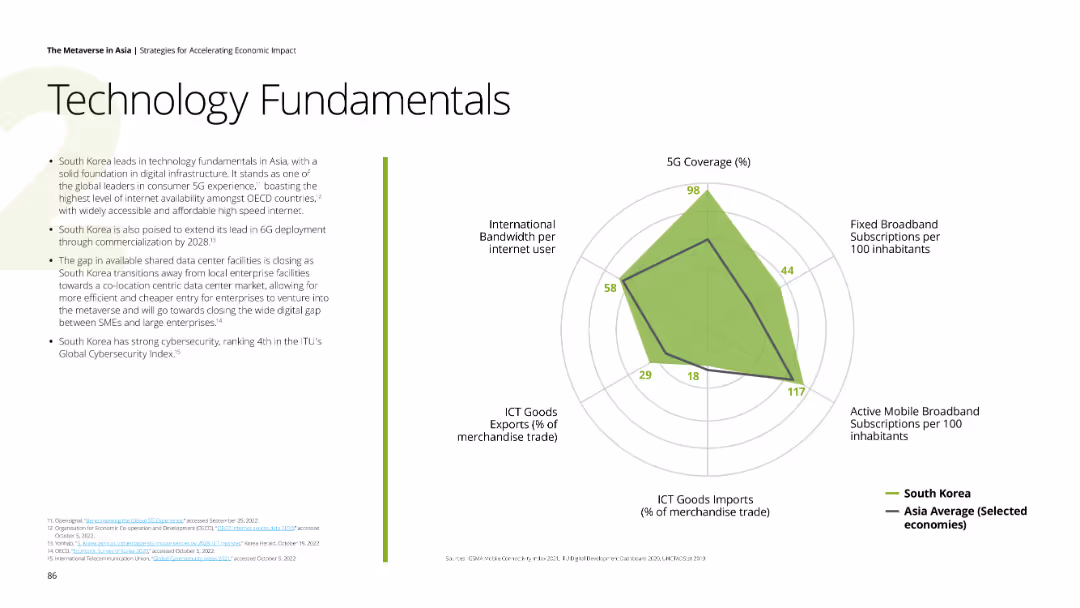
The slide features a radar chart comparing South Korea’s tech metrics against the Asia average. Textual information on the left discusses South Korea’s leadership in digital infrastructure and cybersecurity.
Technology and Digital Transformation
Telecommunications
Describes South Korea’s advancements in technology, 5G coverage, and cybersecurity, with a focus on future developments like 6G and shared data centers.
5G, cybersecurity, digital infrastructure, South Korea, 6G
false
Technology and Digital Transformation
Telecommunications telecommunications
Mixed Chart
Deloitte
View slide
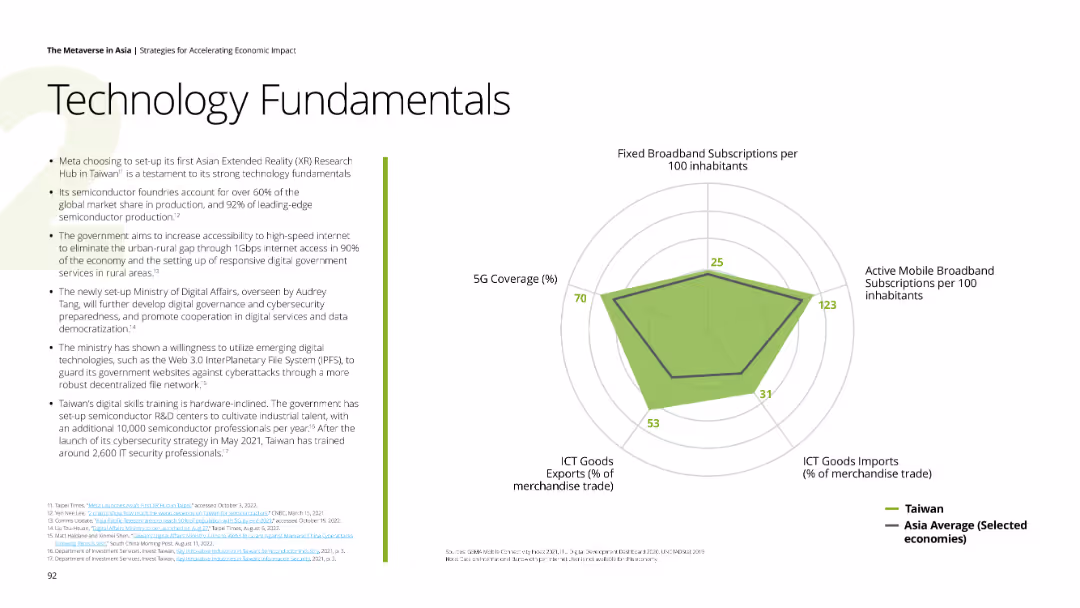
The slide features a radar chart comparing Taiwan’s tech metrics against the Asia average. Textual information on the left discusses Taiwan’s advancements in digital infrastructure and high-speed internet access.
Technology and Digital Transformation
Telecommunications
Highlights Taiwan’s tech fundamentals, including 5G coverage, semiconductor production, and initiatives to enhance digital governance and cybersecurity.
5G, digital infrastructure, semiconductor, Taiwan, cybersecurity
false
Technology and Digital Transformation
Telecommunications telecommunications
Mixed Chart
Deloitte
View slide
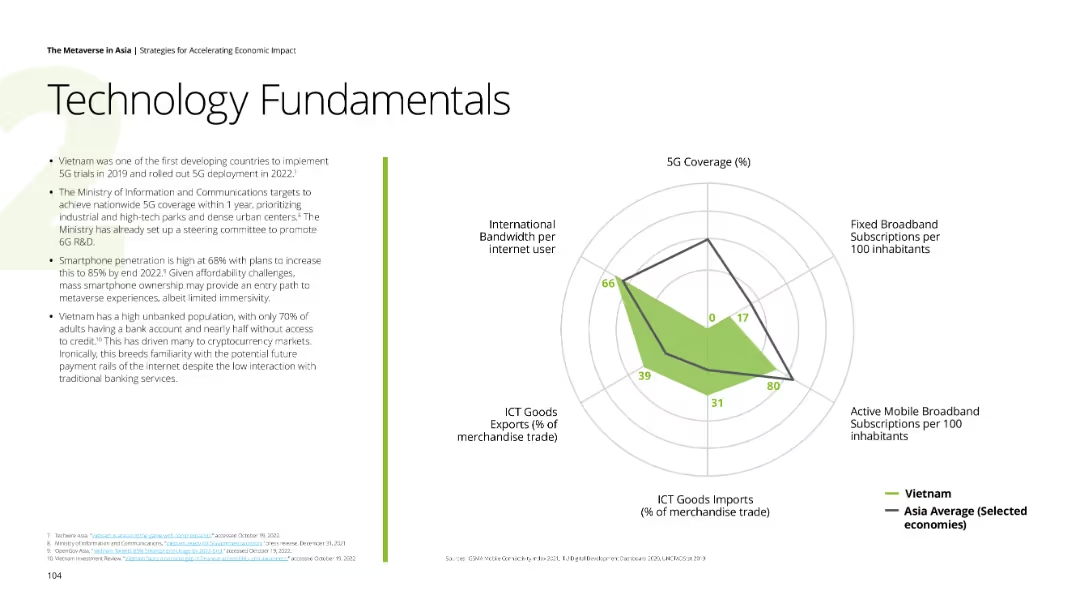
The slide features a radar chart comparing Vietnam’s tech metrics against the Asia average. Textual information on the left discusses Vietnam’s advancements in 5G and smartphone penetration.
Technology and Digital Transformation
Telecommunications
Highlights Vietnam’s technology fundamentals, including 5G coverage, smartphone penetration, and initiatives to enhance digital infrastructure and accessibility.
5G, digital infrastructure, smartphone, Vietnam, accessibility
false
Technology and Digital Transformation
Telecommunications telecommunications
Mixed Chart
Deloitte
View slide
Contains a pie chart comparing user experiences between 4G and 5G networks, using a balanced color scheme to differentiate responses. The slide is visually straightforward and focused.
Technology and Digital Transformation
Telecommunications
Discusses user perceptions of 5G compared to 4G, highlighting improvements and challenges in mobile internet quality. This slide can be used to assess the impact of technological advancements in mobile networks.
5G, mobile internet, user experience, 4G, technology
false
Technology and Digital Transformation
Telecommunications telecommunications
Mixed Chart
Deloitte
View slide
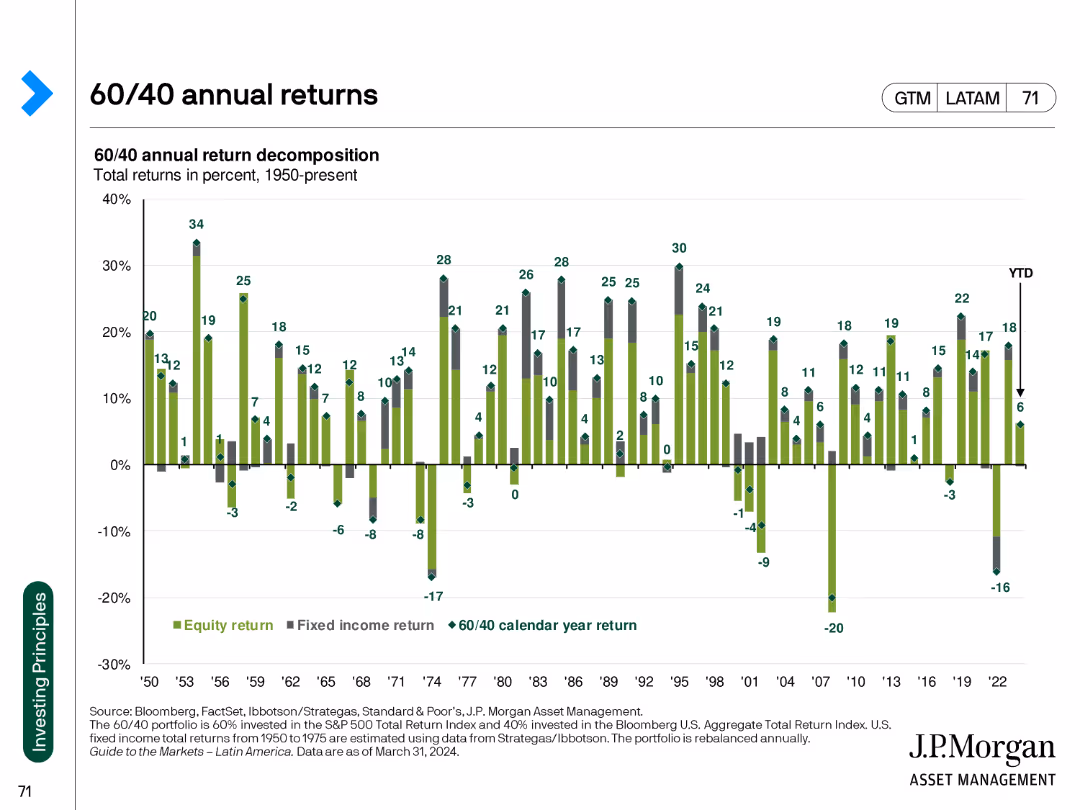
The slide presents a bar chart comparing annual returns of a 60/40 equity and fixed income portfolio over several decades.
Market Analysis and Trends
Financial Services
The slide analyzes the historical performance of a balanced 60/40 portfolio, useful for understanding long-term investment returns and risk management.
60/40 portfolio, annual returns, historical performance, equity, fixed income, investment strategy, financial analysis, market trends
false
Market Analysis and Trends
Financial Services financial-services
Single Chart
JP Morgan
View slide
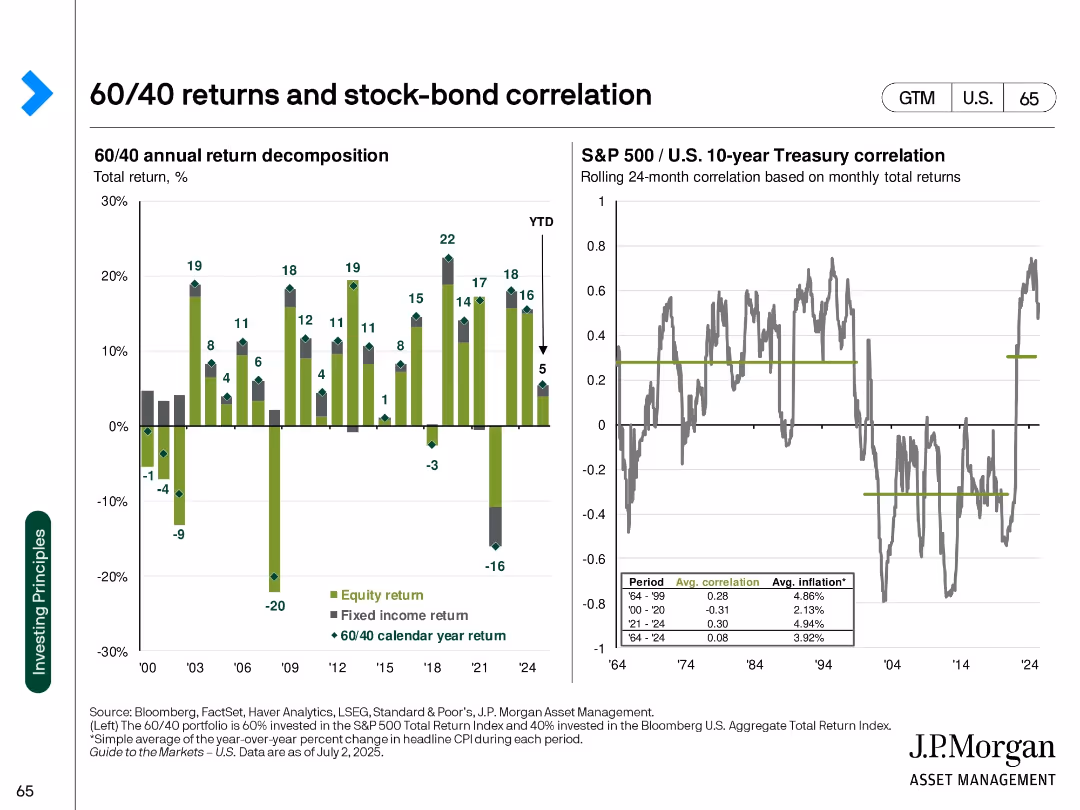
Two-panel chart with bar chart (return decomposition) and line chart (correlation over time)
Financial Performance
Financial Services
Shows yearly breakdown of 60/40 portfolio returns into equity and fixed income components, alongside historical correlation between stocks and bonds. Analyzes inflation periods as well.
60/40 returns, stock-bond correlation, equity return, fixed income, annual performance, inflation, diversification
false
Financial Performance
Financial Services financial-services
Multiple Chart
JP Morgan
View slide
Timeline diagram comparing wireless communication networks (1G to 6G) across selected KPIs. List of use cases benefiting from 6G technology on the right.
Technology and Digital Transformation
Technology & Software
The slide explores the advancements in wireless communication technologies from 1G to 6G, highlighting the improvements in KPIs like peak data rate and latency. It lists potential use cases for 6G, emphasizing its role in supporting data-hungry applications and enabling fundamental innovations.
6G, Wireless Communication, Innovation, KPIs
false
Technology and Digital Transformation
Technology & Software technology-and-software
Mixed Chart
Roland Berger
View slide
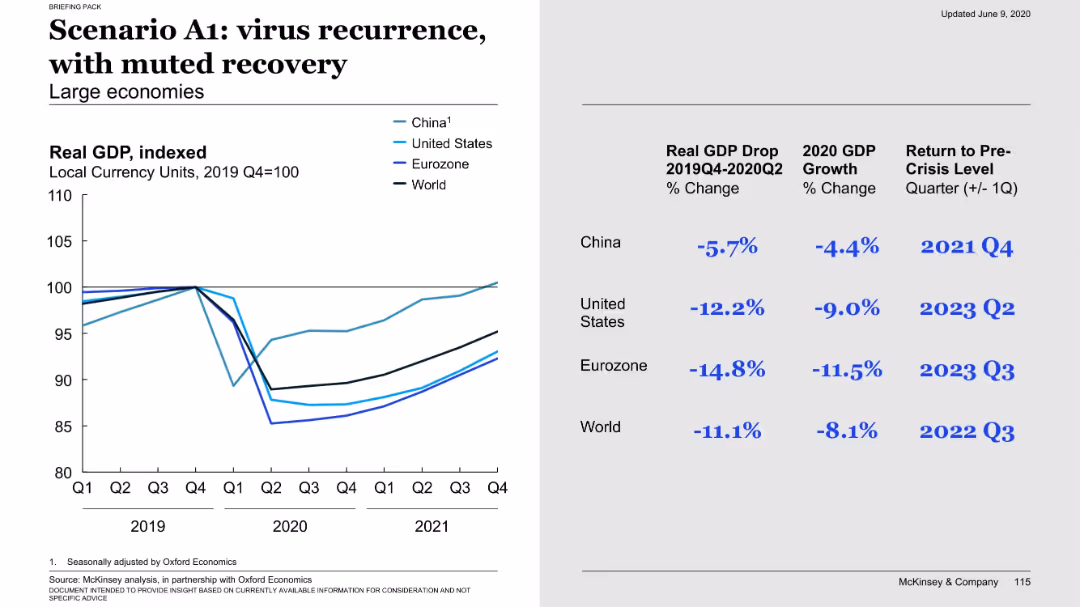
Similar layout to 17457, with graph and economic stats. Displays more prolonged and weaker recovery paths for all regions.
Financial Performance
Government & Public Sector
The A1 scenario models virus recurrence with slow economic recovery. It shows deeper GDP drops and delayed return to pre-crisis levels, especially for the US and Eurozone. This represents a pessimistic but plausible recovery path.
A1, virus recurrence, GDP decline, muted recovery, slow growth, scenario, economic impact, crisis
false
Financial Performance
Government & Public Sector government-and-public-sector
Mixed Chart
McKinsey
View slide
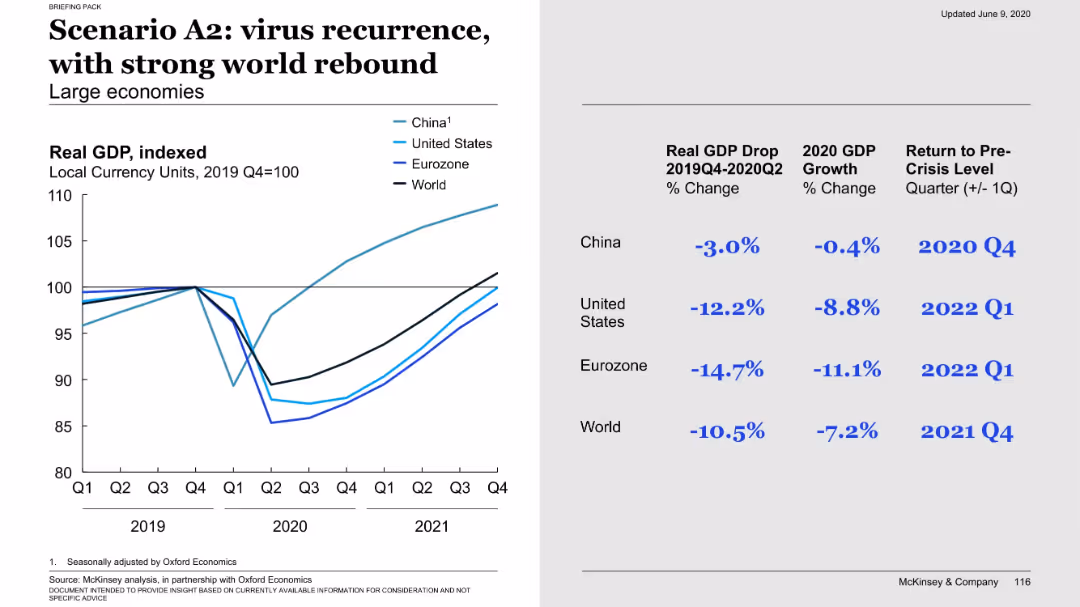
Graph on left shows faster rebound than A1; economic data on right shows a more optimistic path for all major economies.
Financial Performance
Government & Public Sector
A more optimistic recurrence scenario (A2) where strong global policy response drives a sharp recovery. GDP drops are significant but the rebound is faster, especially for China, returning to pre-crisis levels by late 2021 or early 2022.
A2, virus recurrence, strong rebound, GDP recovery, global policy, economic impact, scenario, growth
false
Financial Performance
Government & Public Sector government-and-public-sector
Mixed Chart
McKinsey
Loading...
Hold On!
We are searching in our database
If nothing, comes up, please try different filters!
Column Chart
Heatmap
Chevron
Org Chart
Infographic
Callouts
Timeline
List
Graphic
Picture
Process Flow
Diagram
Paragraph
Map
Table
Framework
Subtitle
Takeaway Box
Icon
Other Chart
Radar Chart
Waterfall Chart
Mekko Chart
Pie Chart
Scatter Plot
Line Chart
Bar chart
Bullet points
Create a FREE account to continue browsing
Receive Instant Access to 1,000+ slides from companies like McKinsey, Google, and Goldman Sachs
First Name
Last Name
Email
Password
I agree to all
Terms & Privacy Policy
Thank you! Your submission has been received!
Oops! Something went wrong while submitting the form.
Have an account?
Sign in
Upgrade to PRO to Save slides
Advanced Search and Filters
Access to 15,000+ slides
Access to Category Pages
Save/Bookmark Slides
PowerPoint Template Library
Pick a Plan
MONTHLY
$12/month
Billed every month, Cancel anytime.
YEARLY
$9/year
Billed $108 annually, Cancel anytime.
Checkout for $12/month
Checkout for $108/yr
Secured by Stripe | AES-256 bit encryption