My Account
My Slides
Search by Category
Templates
View All Templates
Download Template Slides
Leave Feedback
Login
Logout
Get Started
Browse all Slides
Browse all Slides
Create a FREE Account
Instant access to 1,000+ real slides from top companies like McKinsey, BCG, Goldman Sachs, Google and many more!
First Name
Last Name
Email
Password
I agree to all
Terms & Privacy Policy
Thank you! Your submission has been received!
Oops! Something went wrong while submitting the form.
Have an account?
Sign in
Spark Your Next Big Idea with New Presentation Templates
VIEW ALL Templates
Welcome,
Welcome
PRO
Show Featured Only
Checkbox 8
Companies
Mckinsey
Bain
BCG
EY
Deloitte
Accenture
PwC/Strategy&
JP Morgan
Goldman Sachs
Morgan Stanley
Citigroup
Deutsche Bank
Barclays
LEK
KPMG
Kearney
Oliver Wyman
Booz Allen Hamilton
Gartner
IPSOS
Nielsen
Slide type
Text Only
Linear Flow
Vertical Flow
Single Chart
Header Horizontal
Mixed Chart
Header Vertical
Pillar
Multiple Chart
Graphic
Agenda
Title
Table
Framework
Industry
Technology & Software
Artificial Intelligence
Financial Services
Retail & E-commerce
Consumer Goods
Industrial & Manufacturing
Transportation & Logistics
Telecommunications
Real Estate & Construction
Hospitality & Tourism
Professional Services
Education & Training
Media & Entertainment
Agriculture & Food Production
Healthcare & Pharmaceuticals
Environmental Services & Sustainability
Government & Public Sector
Use Case
Mergers and Acquisitions
Performance Metrics and KPIs
Client Case Studies
Competitive Landscape
Corporate Finance and Valuation
Product and Service Analysis
Customer and Market Segmentation
Organizational Structure and Change
Industry Overview
Regulatory and Compliance
Risk Assessment and Management
Investment Analysis
Organizational Structure and Change
Human Resources and Talent Management
Financial Performance
Market Analysis and Trends
Sales and Business Development
Human Resources and Talent Management
Clear all
Thank you! Your submission has been received!
Oops! Something went wrong while submitting the form.
Tag
View slide
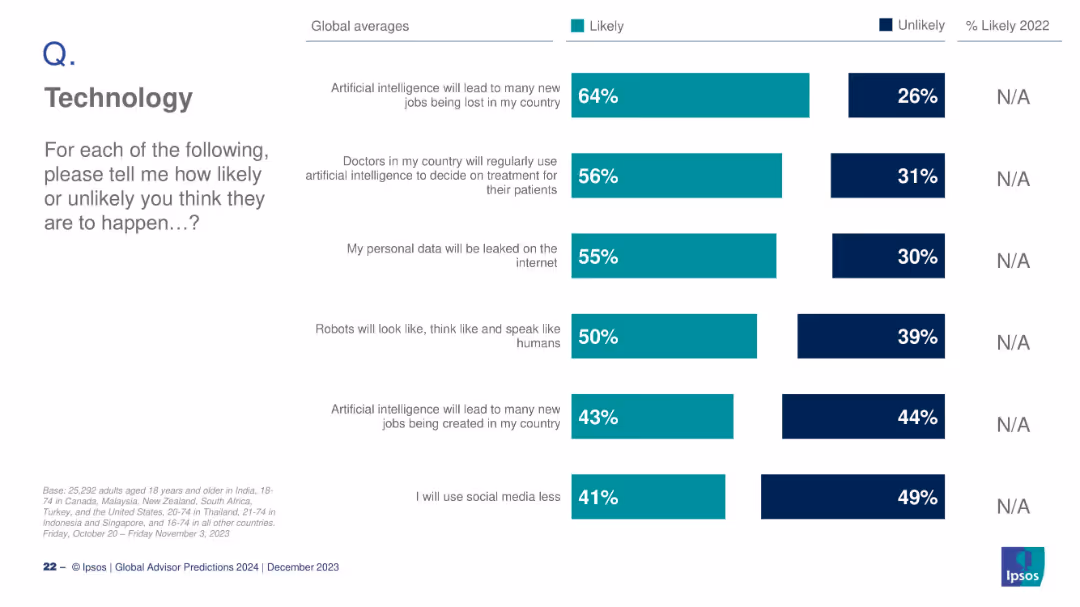
Vertical bar chart with multiple AI-related questions and global responses
Technology and Digital Transformation
Artificial Intelligence
This slide summarizes public opinion on multiple AI-related developments, including job loss, AI in healthcare, data leaks, robot behavior, and social media use. Each is represented by a separate bar with likely/unlikely stats.
AI, job loss, healthcare, data privacy, robots, social media, trends
false
Technology and Digital Transformation
Artificial Intelligence artificial-intelligence
Mixed Chart
IPSOS
View slide
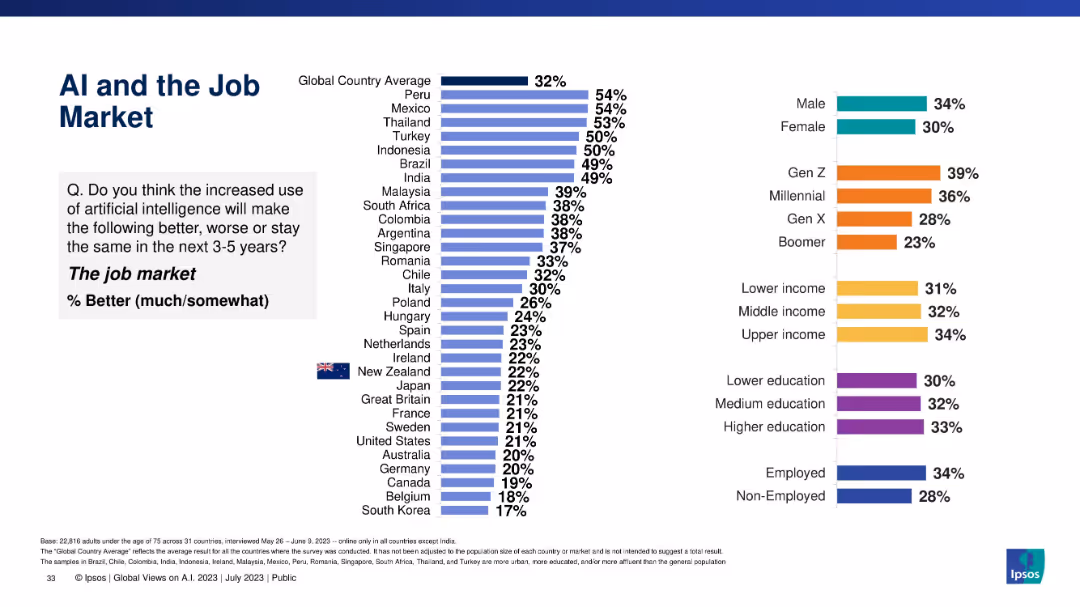
Comparative bar chart showing beliefs about AI’s impact on the job market, with demographic and global breakdowns, ranked by positivity.
Market Analysis and Trends
Artificial Intelligence
The slide captures a largely skeptical view of AI improving the job market, especially in developed countries. Gen Z is more optimistic, but most countries rank low on job market positivity from AI.
AI, job market, perception, global comparison, Ipsos, demographics, workforce, economic impact, employment trends
false
Market Analysis and Trends
Artificial Intelligence artificial-intelligence
Multiple Chart
IPSOS
View slide
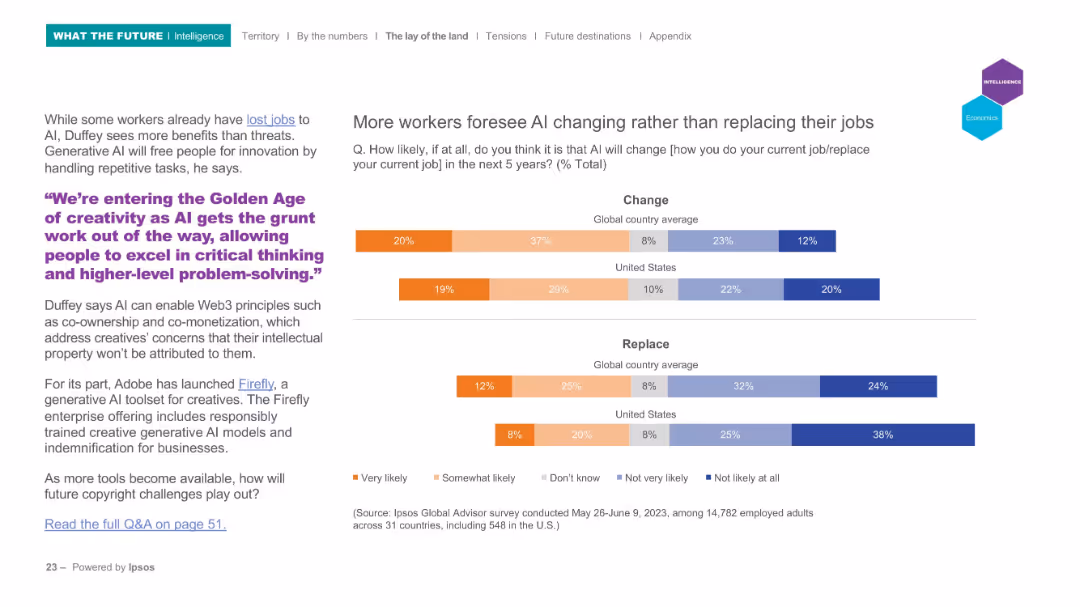
Left-aligned text with a quote in purple, right-aligned horizontal bar graphs showing survey results on "Change" and "Replace" expectations by country.
Market Analysis and Trends
Technology & Software
This slide explores perceptions of how AI will impact jobs over the next five years, showing that workers believe AI will more likely change than replace their roles. A quote highlights AI’s role in enhancing creativity. Survey data compares global and U.S. perspectives.
AI, jobs, survey, automation, creativity, change
false
Market Analysis and Trends
Technology & Software technology-and-software
Mixed Chart
IPSOS
View slide
Slide with split design, left side features a bold percentage number and right side pie charts, minimal text, strong contrasting colors (green, purple), clear fonts.
Human Resources and Talent Management
Technology & Software
Discusses the influence of AI on job security and skills enhancement, highlighting differing perceptions among employees and leaders.
AI, jobs, upskilling, workforce, technology
false
Human Resources and Talent Management
Technology & Software technology-and-software
Multiple Chart
BCG
View slide
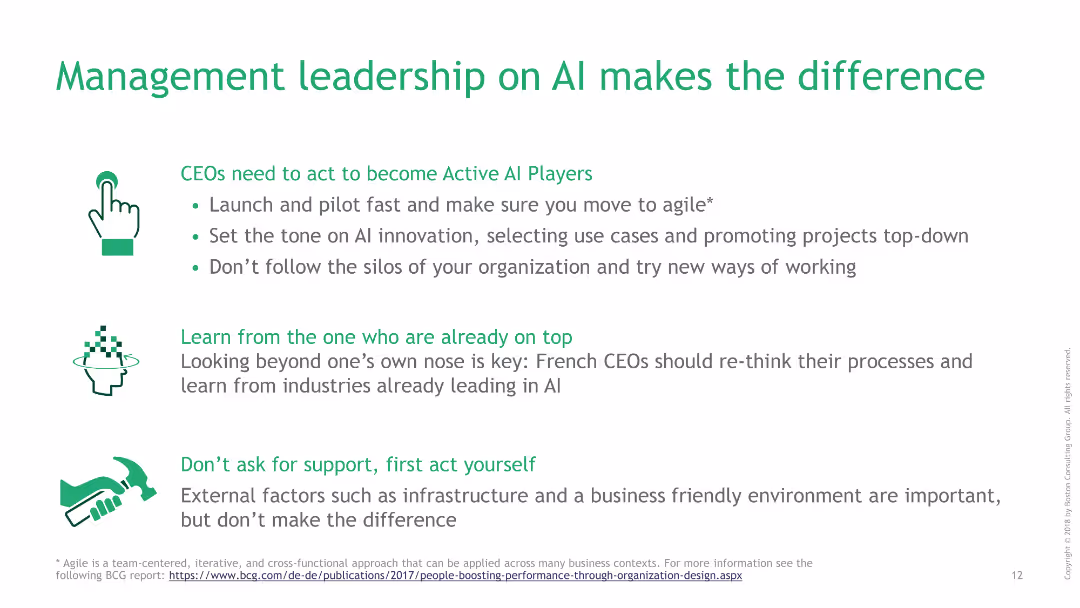
Icons and text outlining key actions CEOs need to take to become active AI players, such as piloting fast, promoting AI innovation, and avoiding silos.
Strategic Planning
Professional Services
This slide emphasizes the importance of management leadership in AI, providing actionable steps for CEOs to enhance AI adoption in their organizations.
AI, leadership, CEOs, management, strategic planning, actions, piloting, innovation, silos, professional services
false
Strategic Planning
Professional Services professional-services
Header Vertical
BCG
View slide
Features split design with icons: potential of AI on the left, challenges of AI adoption on the right.
Technology and Digital Transformation
Technology & Software
Highlights AI's potential for success and disruptive capability, alongside the challenges faced by organizations in adopting and scaling AI solutions.
AI, leadership, potential, challenges, adoption, success
false
Technology and Digital Transformation
Technology & Software technology-and-software
Text Only
McKinsey
View slide
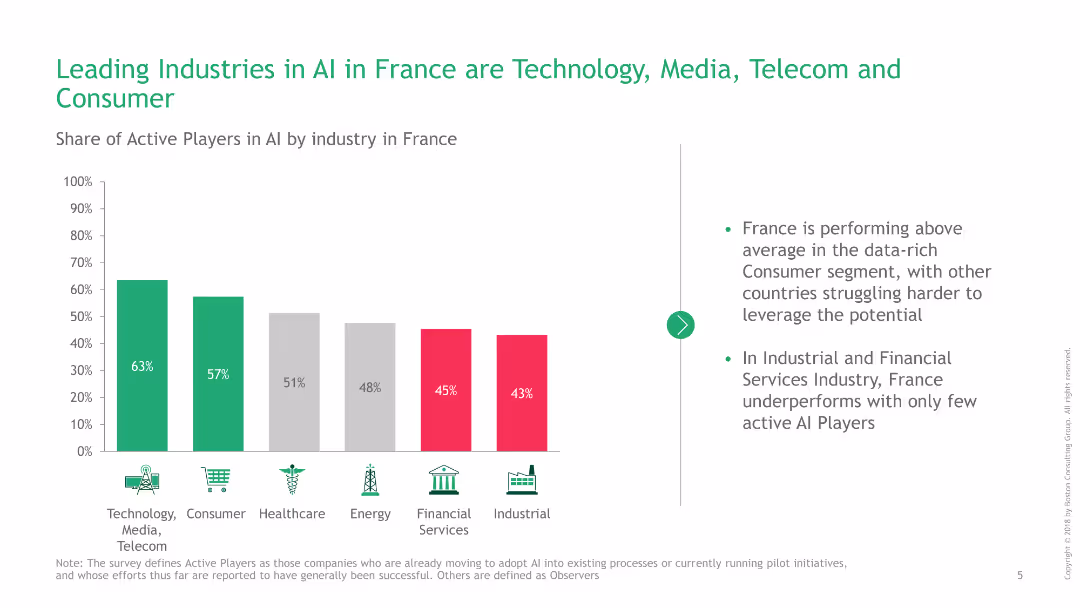
Features a column chart depicting the share of active AI players by industry in France, with supporting text on France's performance.
Market Analysis and Trends
Technology & Software
Highlights the leading industries in AI adoption within France, with a focus on the Technology, Media, Telecom, and Consumer sectors.
AI, leading industries, France, technology, performance
false
Market Analysis and Trends
Technology & Software technology-and-software
Mixed Chart
BCG
View slide
Column chart with a projected growth annotation, showing the percentage use of AI and machine learning in marketing efforts from the current to future expectations.
Technology and Digital Transformation
Technology & Software
Highlights the current and expected future usage of AI and machine learning in marketing, noting a 166% growth projection.
AI, machine learning, marketing, growth projection, automation
false
Technology and Digital Transformation
Technology & Software technology-and-software
Single Chart
Deloitte
View slide
A content slide with text on the left and a column chart on the right. The chart lists significant ways organizations are using machine learning and AI.
Technology and Digital Transformation
Financial Services
This slide discusses the adoption of AI in risk management, highlighting key applications like fraud detection, data analysis, and operational task automation.
AI, machine learning, risk management, technology, adoption
false
Technology and Digital Transformation
Financial Services financial-services
Multiple Chart
EY
View slide
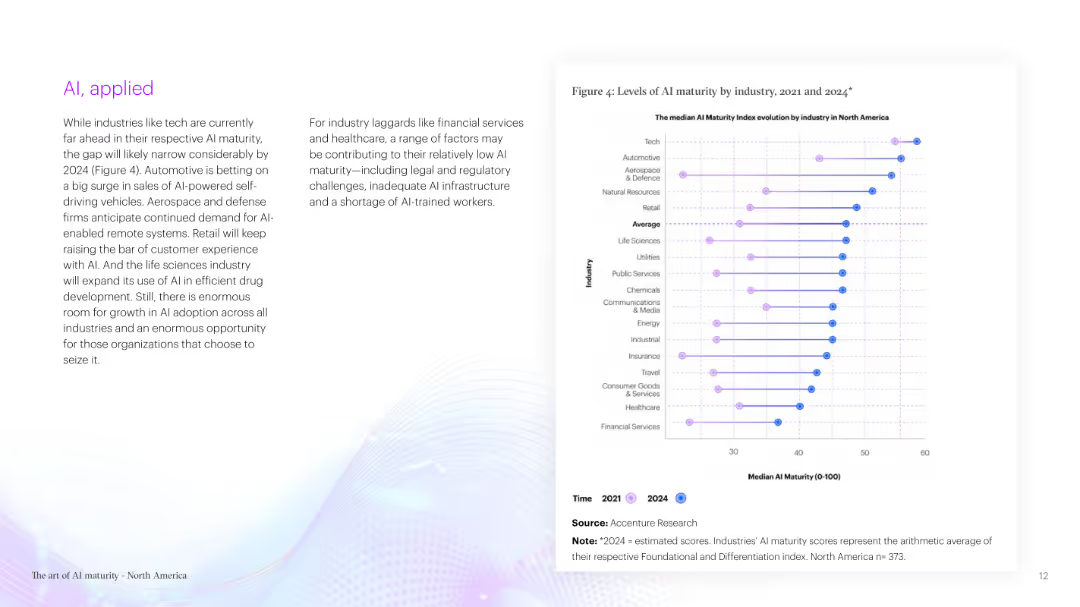
A two-column slide with text on the left and a column chart on the right. The column chart compares AI maturity levels across various industries from 2021 to 2024.
Technology and Digital Transformation
Technology & Software
The slide discusses AI maturity across industries, predicting a narrowing gap by 2024, with tech industries leading. It mentions the challenges faced by financial services and healthcare in adopting AI due to various factors.
AI, maturity, industries, technology, adoption, challenges, predictions, 2024, financial, healthcare
false
Technology and Digital Transformation
Technology & Software technology-and-software
Mixed Chart
Accenture
View slide
Side-by-side layout; left side features text with white font on blue background, right side shows horizontal bar chart with country comparisons (agree/disagree %)
Risk Assessment and Management
Artificial Intelligence
This slide presents the percentage of people in various countries who believe AI will worsen misinformation and disinformation. It shows a global average of 51% agreement, with Canada and New Zealand among the highest. The visual illustrates broad concern about AI's societal impact.
AI, misinformation, disinformation, public perception, survey, global comparison, risk, Ipsos, technology, ethics
false
Risk Assessment and Management
Artificial Intelligence artificial-intelligence
Mixed Chart
IPSOS
View slide
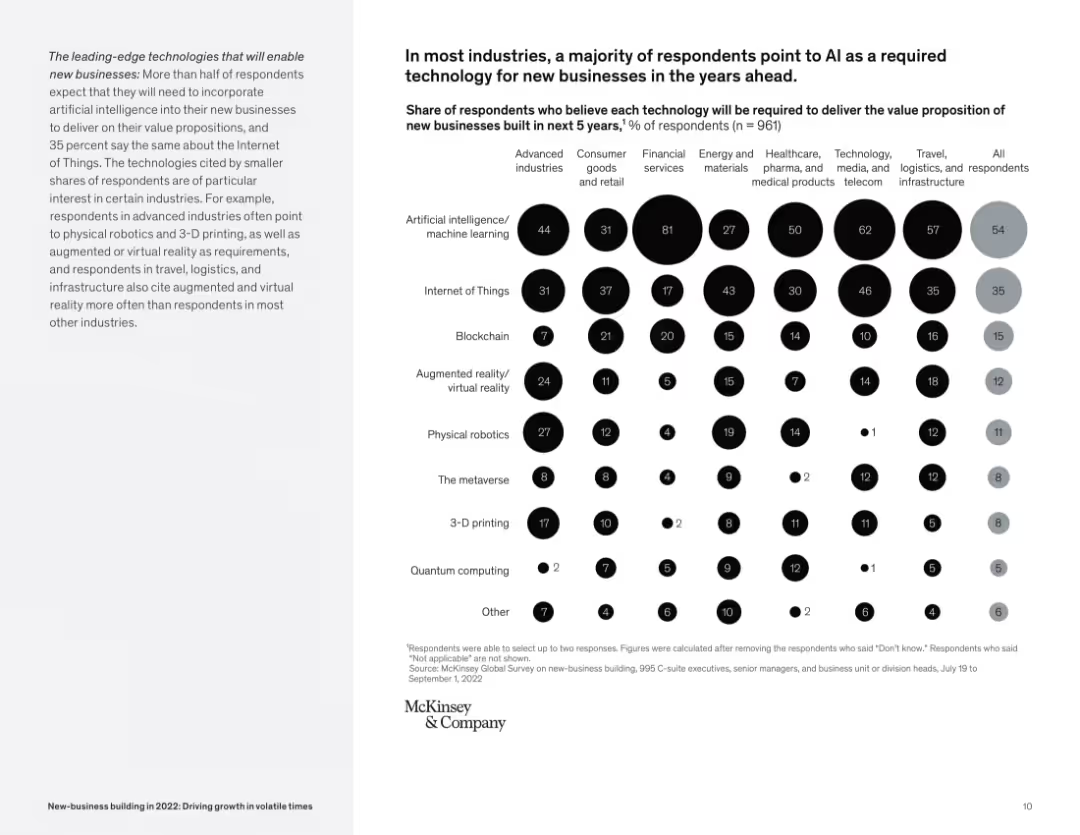
Split layout: text explanation on left, bubble chart on right showing tech importance by industry. Clean design with industry labels.
Technology and Digital Transformation
Artificial Intelligence
The slide shows that AI is the top technology required for new businesses across industries, especially in energy, tech, and logistics. It presents percentage data for 10 technologies via a bubble chart segmented by industry.
AI, new business, required tech, industry comparison, survey, McKinsey, bubble chart, technology adoption
false
Technology and Digital Transformation
Artificial Intelligence artificial-intelligence
Mixed Chart
McKinsey
View slide
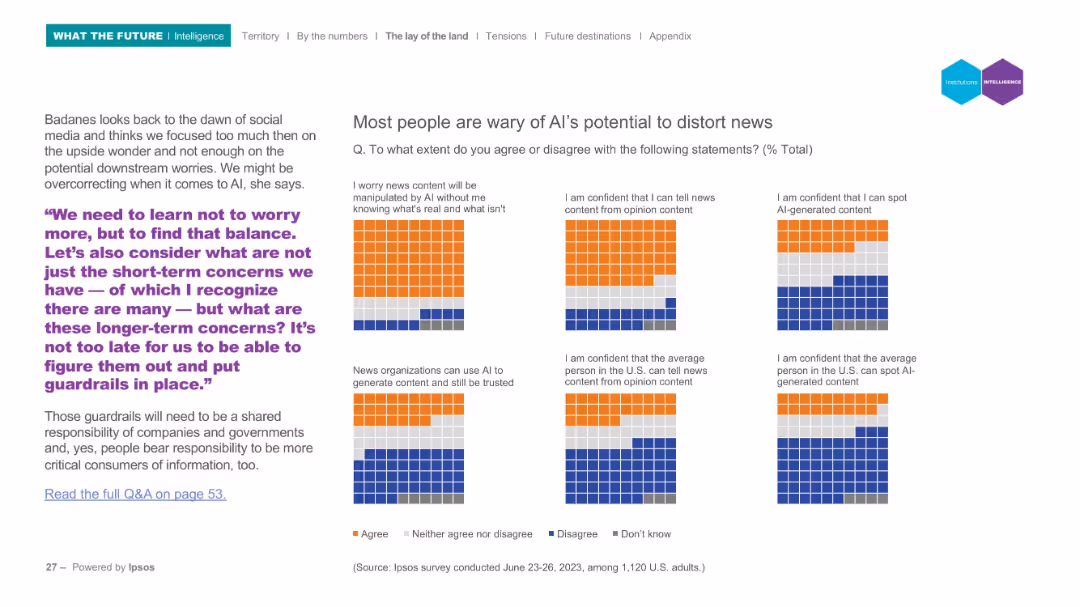
Grid-based infographic with colored blocks representing survey responses to 6 statements. Left-aligned text with quote.
Risk Assessment and Management
Media & Entertainment
This slide presents survey results on AI and news credibility, showing significant concern over manipulation and trust in AI-generated news. The quote calls for long-term thinking and placing guardrails around AI technologies.
AI, news, misinformation, trust, survey, risk
false
Risk Assessment and Management
Media & Entertainment media-and-entertainment
Mixed Chart
IPSOS
View slide
Features multiple pie charts displaying the percentage use of AI in different operational areas.
Operational Efficiency
Technology & Software
Outlines the use of AI in daily operations across various industries, focusing on customer experience and operations, and highlights the sectors and processes where AI has the most significant impact.
AI, operations, customer experience, day-to-day, industries
false
Operational Efficiency
Technology & Software technology-and-software
Multiple Chart
Deloitte
View slide
Column chart showing the percentage of companies filing AI patents in Europe, North America, and APAC.
Market Analysis and Trends
Technology & Software
The slide highlights the lag in AI patent filings by European companies compared to North American and APAC counterparts.
AI, patents, Europe, North America, APAC, market trends, innovation, technology
false
Market Analysis and Trends
Technology & Software technology-and-software
Mixed Chart
Accenture
View slide
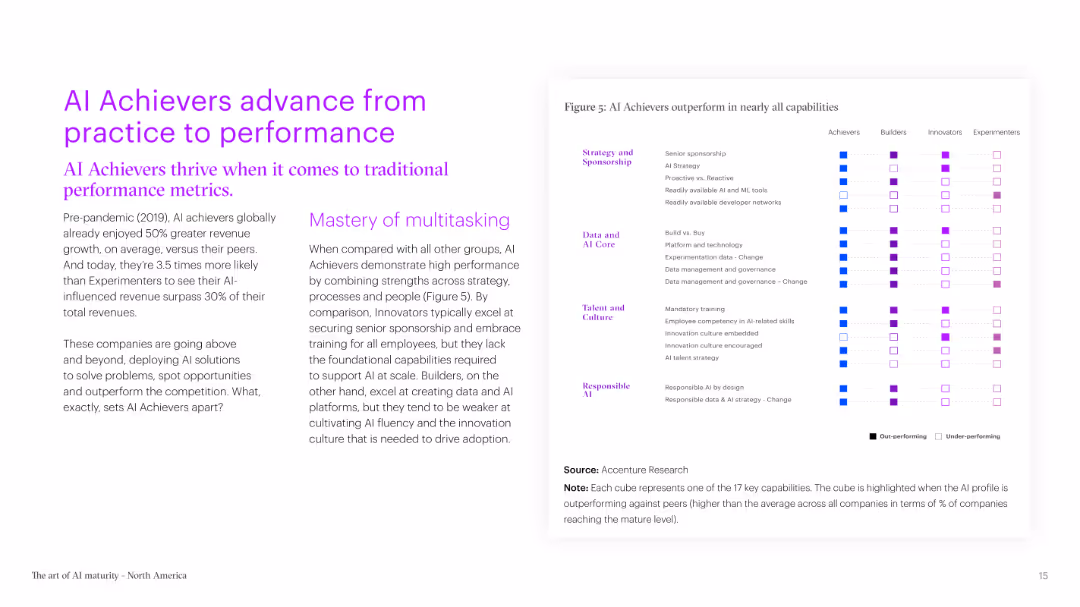
A two-column slide with text on the left and a matrix chart on the right. The matrix shows how AI Achievers outperform in various capabilities compared to other groups.
Strategic Planning
Technology & Software
The slide highlights the superior performance of AI Achievers in traditional performance metrics, emphasizing their ability to multitask and outperform competitors in nearly all key capabilities.
AI, performance, metrics, capabilities, multitasking, Achievers, comparison, traditional, superior, groups
false
Strategic Planning
Technology & Software technology-and-software
Boxed
Accenture
View slide
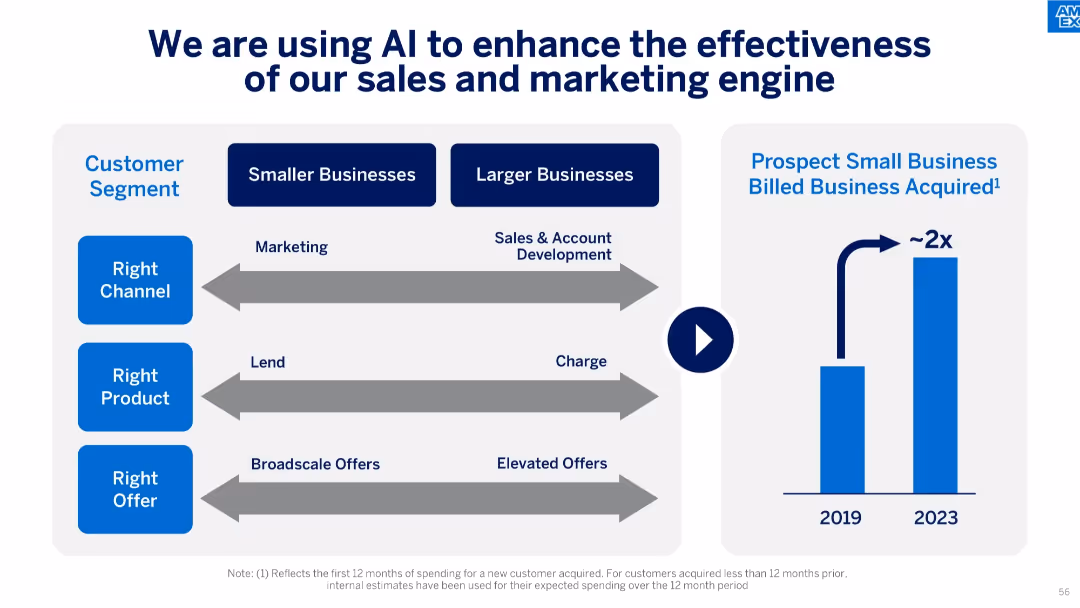
Left: flowchart of personalized sales/marketing by business size and offer type. Right: bar graph showing 2x growth in billed business from 2019 to 2023.
Technology and Digital Transformation
Artificial Intelligence
The slide showcases the use of AI in optimizing channels, product offers, and acquisition strategies for both small and large businesses, resulting in a doubling of billed business acquired.
AI, personalization, sales engine, marketing optimization, small business, acquisition, customer segmentation
false
Technology and Digital Transformation
Artificial Intelligence artificial-intelligence
Mixed Chart
McKinsey
View slide
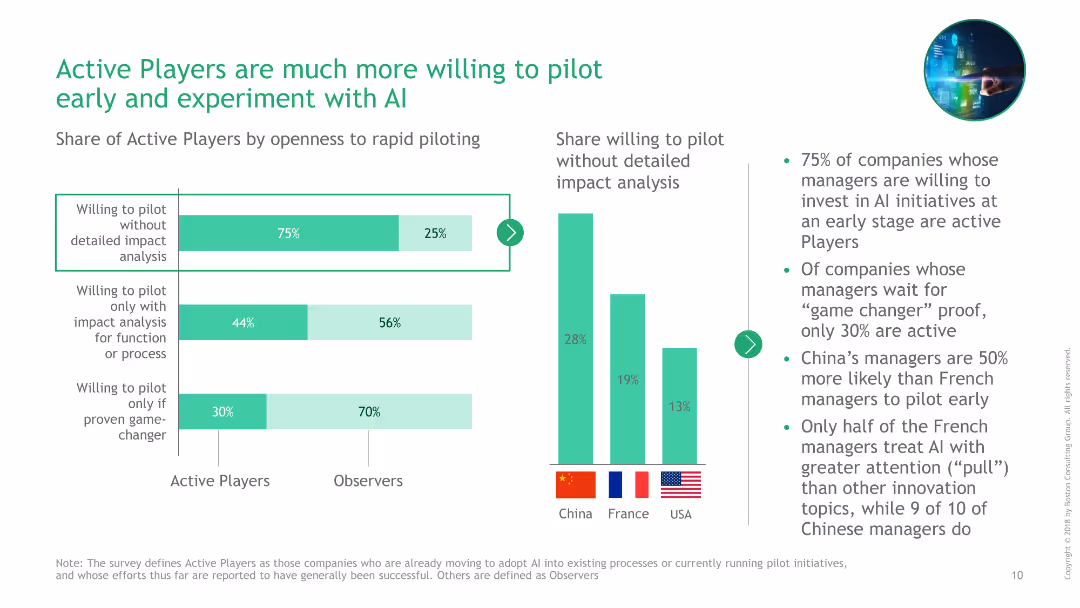
Bar charts comparing the willingness to pilot AI without detailed impact analysis among active players and observers, and across China, France, and USA.
Market Analysis and Trends
Technology & Software
This slide compares the willingness of companies in different countries to pilot AI initiatives early without detailed impact analysis, highlighting differences between active players and observers.
AI, piloting, China, France, USA, active players, observers, comparison, bar charts, market trends
false
Market Analysis and Trends
Technology & Software technology-and-software
Multiple Chart
BCG
View slide
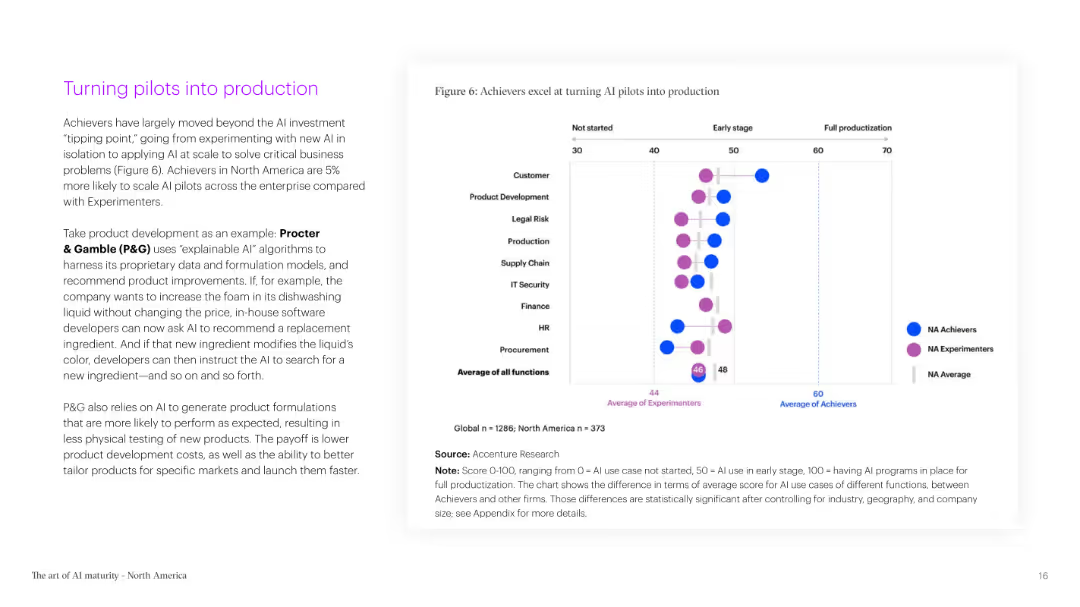
A two-column slide with text on the left and a bubble chart on the right. The bubble chart shows the stages of AI pilot programs and their production levels across different functions.
Technology and Digital Transformation
Technology & Software
This slide explains the transition of AI pilots into production, using Procter & Gamble as an example. It highlights the increased likelihood of AI Achievers to scale AI pilots compared to Experimenters.
AI, pilots, production, Procter & Gamble, scaling, functions, stages, transition, Achievers, Experimenters
false
Technology and Digital Transformation
Technology & Software technology-and-software
Mixed Chart
Accenture
View slide
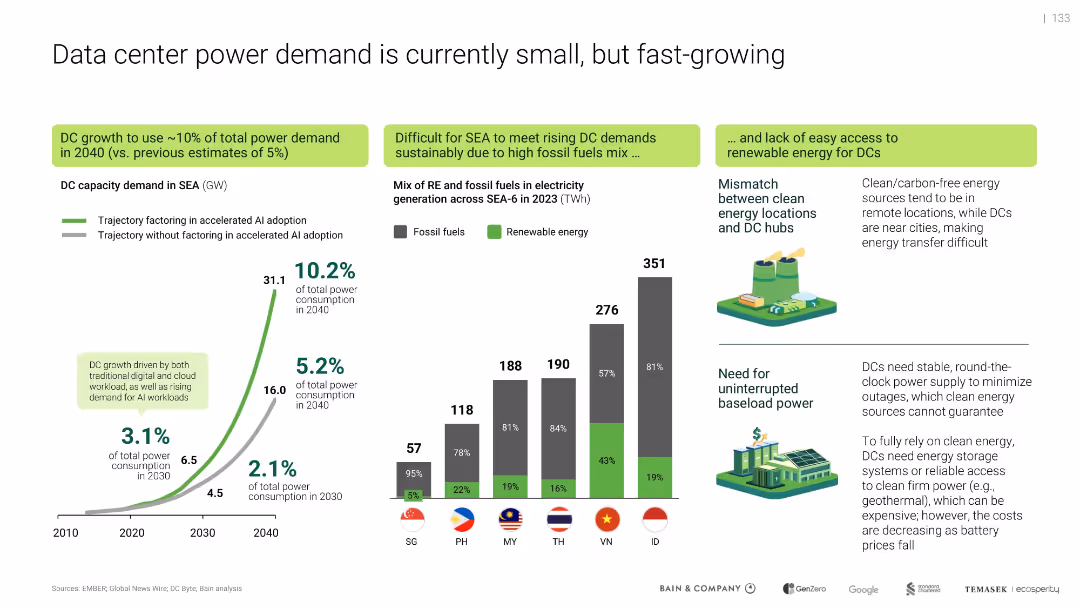
Multi-section layout with graphs, illustrations, and color-coded callouts
Strategic Planning
Technology & Software
Projects that data center energy demand in SEA could reach 10% of total power use by 2040, driven by AI. Emphasizes mismatch between renewable sources and data center locations, and the need for uninterrupted power. Highlights current reliance on fossil fuels and challenges of clean energy integration.
AI, power demand, renewable energy, fossil fuels, data center growth, energy mismatch, SEA-6, baseload power
false
Strategic Planning
Technology & Software technology-and-software
Multiple Chart
Bain
View slide
Features a bar chart showing anticipated contributions of AI to productivity, such as reducing manufacturing cycles and enhancing workforce learning.
Technology and Digital Transformation
Technology & Software
Analyzes expectations from AI technology in boosting productivity through enhancements in manufacturing, workforce development, and customer experience.
AI, productivity, manufacturing, workforce, technology
false
Technology and Digital Transformation
Technology & Software technology-and-software
Single Chart
Deloitte
View slide
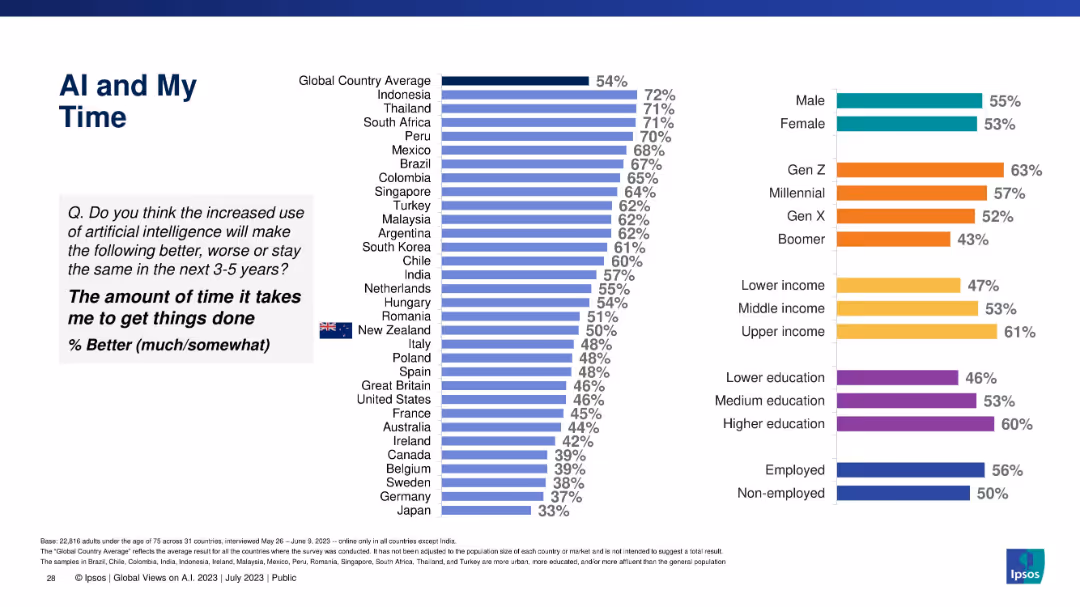
Ranked bar chart comparing countries and demographics on the belief that AI will improve time efficiency, with bars color-coded by category.
Operational Efficiency
Artificial Intelligence
The slide compares how countries and demographic segments believe AI will improve time efficiency. Indonesia leads globally, and younger generations are more optimistic than older ones.
AI, productivity, time efficiency, global ranking, generational views, education level, gender, country comparison
false
Operational Efficiency
Artificial Intelligence artificial-intelligence
Multiple Chart
IPSOS
View slide
Slide displays a bar chart with timelines for anticipated productivity improvements from AI, with a focus on the next three years.
Technology and Digital Transformation
Technology & Software
Predicts the timeline for noticeable productivity improvements due to AI implementation across the surveyed companies.
AI, productivity, timeline, improvements, technology
false
Technology and Digital Transformation
Technology & Software technology-and-software
Single Chart
Deloitte
View slide
Includes a textual section and a dot matrix chart that visually represents the level of agreement with statements regarding regulation and collaboration in AI. The design is clean, with green dots signifying the percentage agreement.
Regulatory and Compliance
Government & Public Sector
The slide highlights the desire for more government regulation and global collaboration on AI technologies. It presents data showing a significant majority of business leaders advocating for these measures to manage the unique risks of generative AI, raising concerns about leaving regulation solely to individual organizations.
AI, regulation, collaboration, government, leaders, risks, technology
false
Regulatory and Compliance
Government & Public Sector government-and-public-sector
Mixed Chart
Deloitte
View slide
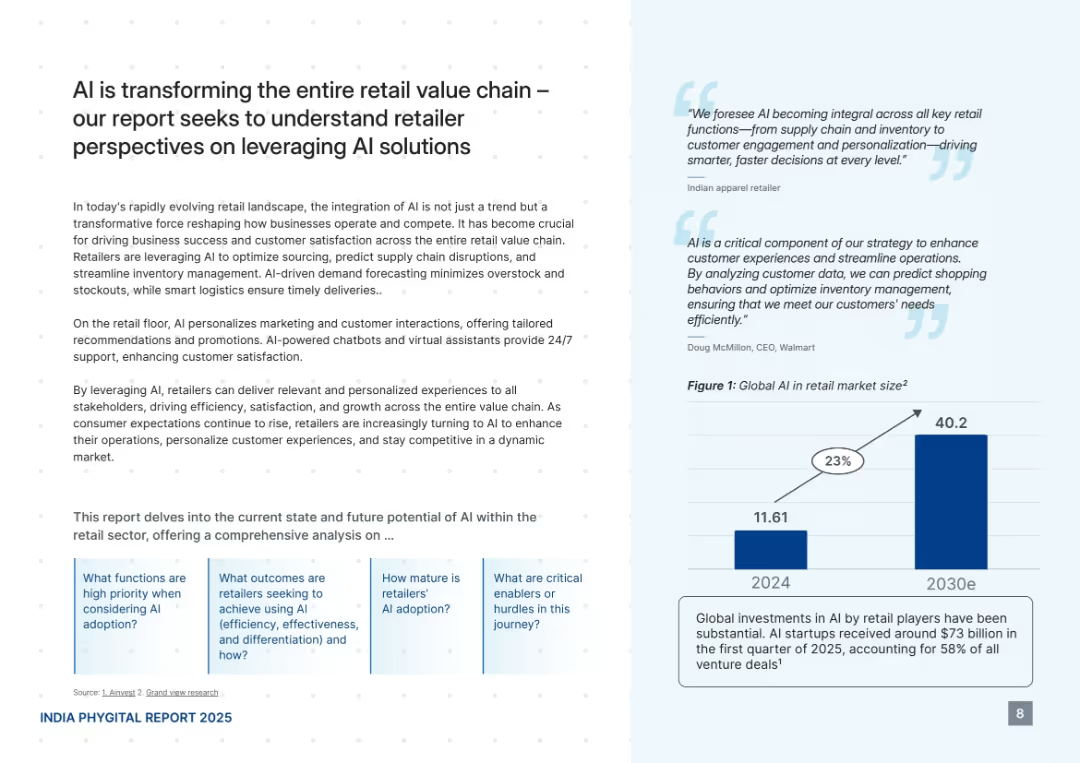
Clean white and light blue background. Divided into text-heavy left panel and light blue panel with quotes and a bar chart. Subtle dotted pattern.
Technology and Digital Transformation
Retail & E-commerce
This slide discusses how AI is reshaping the retail sector through personalized customer interactions, smarter logistics, and data-driven insights. It includes insights from retailers and CEOs, plus a projected growth chart showing the global AI retail market increasing from $11.61B in 2024 to $40.2B by 2030.
AI, retail, transformation, personalization, logistics, market size, chatbot, supply chain, Walmart, insights
false
Technology and Digital Transformation
Retail & E-commerce retail-and-e-commerce
Mixed Chart
PwC/Strategy&
View slide
Image of a man working on a laptop. Column chart showing the extent of implementation of automation or advanced analytics in risk management.
Technology and Digital Transformation
Technology & Software
This slide addresses the implementation of AI and advanced analytics in risk management, highlighting the current adoption rates and potential risks associated with these technologies. It discusses the importance of integrating AI to enhance business innovation and operational excellence.
AI, risk management, advanced analytics, automation, technology
false
Technology and Digital Transformation
Technology & Software technology-and-software
Multiple Chart
EY
View slide
The slide presents a complex, color-coded chart structure with seven key sections: AI Adoption Strategy, Control Framework, Use case/POV, Data Ecosystems, Techniques & Tools, Solution Development/Integration, and Operate & Monitor. Each section includes bullet points listing specific items related to AI and risk management strategies. The layout is grid-like with each section clearly numbered and titled.
Risk Assessment and Management
Technology & Software
This slide outlines various aspects of risk management throughout the AI development lifecycle, from strategy adoption to operation and monitoring. It is likely used in presentations addressing the integration of risk management into AI development processes, discussing detailed points like data privacy, cloud use, validation metrics, and deployment pipelines among others. This makes it suitable for audiences involved in AI development and risk management within the technology sector.
AI, risk management, data privacy, cloud, validation
false
Risk Assessment and Management
Technology & Software technology-and-software
Linear Flow
PwC/Strategy&
View slide
Contains a bar chart comparing the importance of AI applications in risk management and ethics.
Risk Assessment and Management
Technology & Software
Analyzes the critical AI applications for managing risks and improving AI ethics in businesses.
AI, risk management, ethics, applications, importance
false
Risk Assessment and Management
Technology & Software technology-and-software
Single Chart
PwC/Strategy&
View slide
Includes pie charts in green tones, highlighting statistics on AI risk management strategies.
Risk Assessment and Management
Technology & Software
Examines how organizations manage AI risks, emphasizing training and collaboration on AI ethics as key strategies. Highlights differences in approaches between high- and low-outcome organizations.
AI, risk management, training, ethics, strategies
false
Risk Assessment and Management
Technology & Software technology-and-software
Multiple Chart
Deloitte
View slide
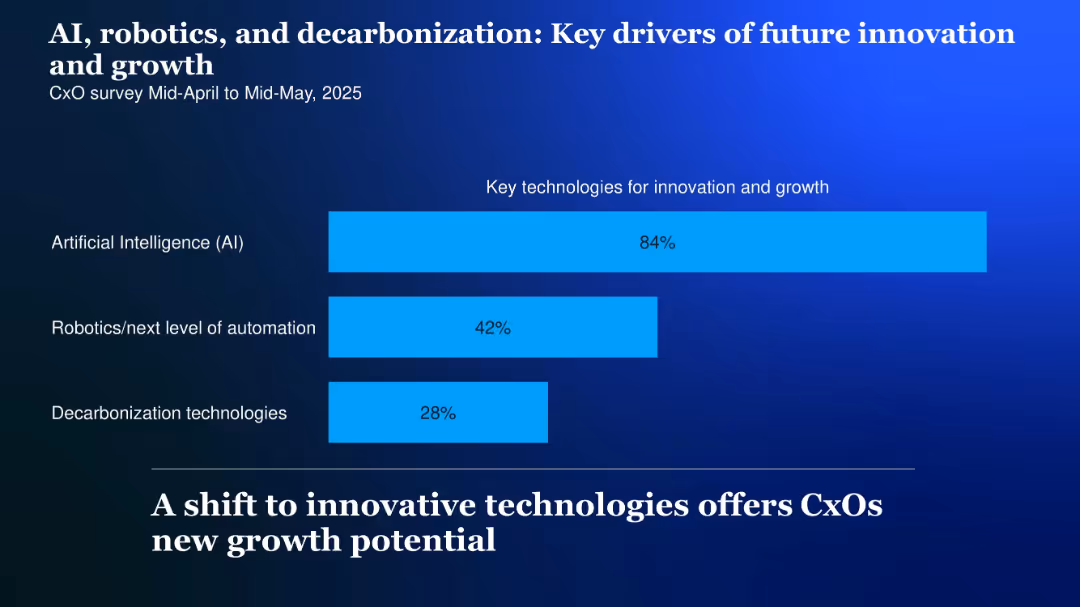
Simple horizontal bar chart showing percentage focus on three technologies; light blue bars over a dark blue background
Technology and Digital Transformation
Artificial Intelligence
Highlights the top technologies driving innovation: AI (84%), robotics (42%), and decarbonization (28%), suggesting where future investments and strategic focus may lie.
AI, robotics, decarbonization, innovation, future growth, key drivers, 2025
false
Technology and Digital Transformation
Artificial Intelligence artificial-intelligence
Single Chart
McKinsey
Previous
Loading...
Hold On!
We are searching in our database
If nothing, comes up, please try different filters!
Column Chart
Heatmap
Chevron
Org Chart
Infographic
Callouts
Timeline
List
Graphic
Picture
Process Flow
Diagram
Paragraph
Map
Table
Framework
Subtitle
Takeaway Box
Icon
Other Chart
Radar Chart
Waterfall Chart
Mekko Chart
Pie Chart
Scatter Plot
Line Chart
Bar chart
Bullet points
Create a FREE account to continue browsing
Receive Instant Access to 1,000+ slides from companies like McKinsey, Google, and Goldman Sachs
First Name
Last Name
Email
Password
I agree to all
Terms & Privacy Policy
Thank you! Your submission has been received!
Oops! Something went wrong while submitting the form.
Have an account?
Sign in
Upgrade to PRO to Save slides
Advanced Search and Filters
Access to 15,000+ slides
Access to Category Pages
Save/Bookmark Slides
PowerPoint Template Library
Pick a Plan
MONTHLY
$12/month
Billed every month, Cancel anytime.
YEARLY
$9/year
Billed $108 annually, Cancel anytime.
Checkout for $12/month
Checkout for $108/yr
Secured by Stripe | AES-256 bit encryption