My Account
My Slides
Search by Category
Templates
View All Templates
Download Template Slides
Leave Feedback
Login
Logout
Get Started
Browse all Slides
Browse all Slides
Create a FREE Account
Instant access to 1,000+ real slides from top companies like McKinsey, BCG, Goldman Sachs, Google and many more!
First Name
Last Name
Email
Password
I agree to all
Terms & Privacy Policy
Thank you! Your submission has been received!
Oops! Something went wrong while submitting the form.
Have an account?
Sign in
Spark Your Next Big Idea with New Presentation Templates
VIEW ALL Templates
Welcome,
Welcome
PRO
Show Featured Only
Checkbox 8
Companies
Mckinsey
Bain
BCG
EY
Deloitte
Accenture
PwC/Strategy&
JP Morgan
Goldman Sachs
Morgan Stanley
Citigroup
Deutsche Bank
Barclays
LEK
KPMG
Kearney
Oliver Wyman
Booz Allen Hamilton
Gartner
IPSOS
Nielsen
Slide type
Text Only
Linear Flow
Vertical Flow
Single Chart
Header Horizontal
Mixed Chart
Header Vertical
Pillar
Multiple Chart
Graphic
Agenda
Title
Table
Framework
Industry
Technology & Software
Artificial Intelligence
Financial Services
Retail & E-commerce
Consumer Goods
Industrial & Manufacturing
Transportation & Logistics
Telecommunications
Real Estate & Construction
Hospitality & Tourism
Professional Services
Education & Training
Media & Entertainment
Agriculture & Food Production
Healthcare & Pharmaceuticals
Environmental Services & Sustainability
Government & Public Sector
Use Case
Mergers and Acquisitions
Performance Metrics and KPIs
Client Case Studies
Competitive Landscape
Corporate Finance and Valuation
Product and Service Analysis
Customer and Market Segmentation
Organizational Structure and Change
Industry Overview
Regulatory and Compliance
Risk Assessment and Management
Investment Analysis
Organizational Structure and Change
Human Resources and Talent Management
Financial Performance
Market Analysis and Trends
Sales and Business Development
Human Resources and Talent Management
Clear all
Thank you! Your submission has been received!
Oops! Something went wrong while submitting the form.
Tag
View slide
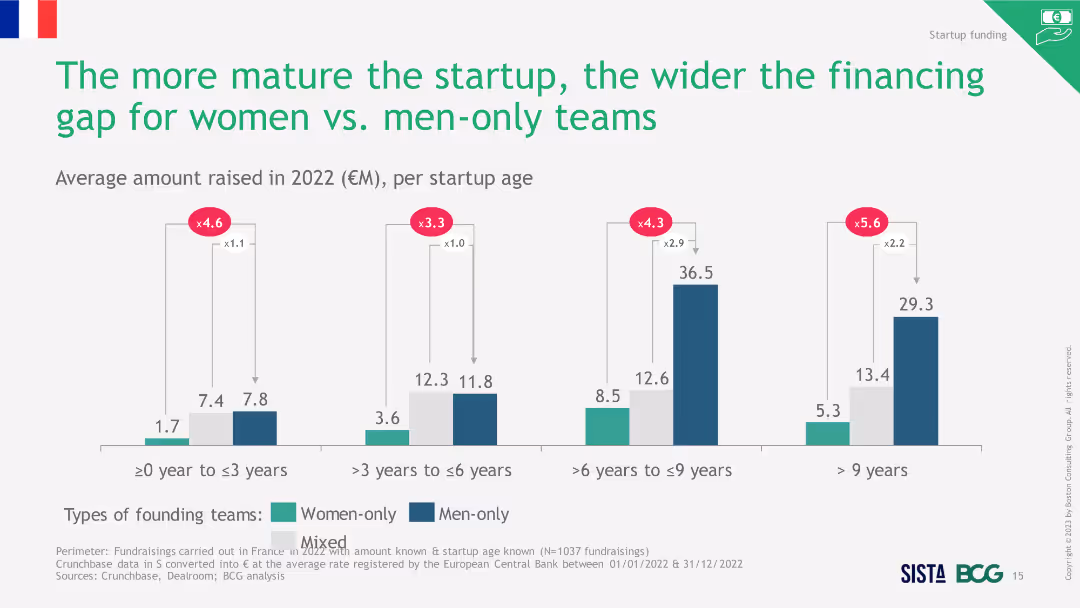
Column chart illustrating the average amount raised in 2022 per startup age. The chart compares women-only, men-only, and mixed teams, showing significant disparities as startups mature.
Market Analysis and Trends
Financial Services
This slide examines the financing gap between women-only and men-only teams as startups mature. It presents the average amounts raised by startups in different age brackets and highlights the growing disparity.
Financing, Startup, Age, Women, Men
false
Market Analysis and Trends
Financial Services financial-services
Single Chart
BCG
View slide
Features column chart comparing financing revenue growth over years with a clear visual hierarchy.
Financial Performance
Financial Services
Highlights Goldman Sachs' strategic progress in global banking and markets, with a focus on equities and FICC financing growth and client engagement.
Financing, growth, strategy, Goldman Sachs
false
Financial Performance
Financial Services financial-services
Mixed Chart
Goldman Sachs
View slide
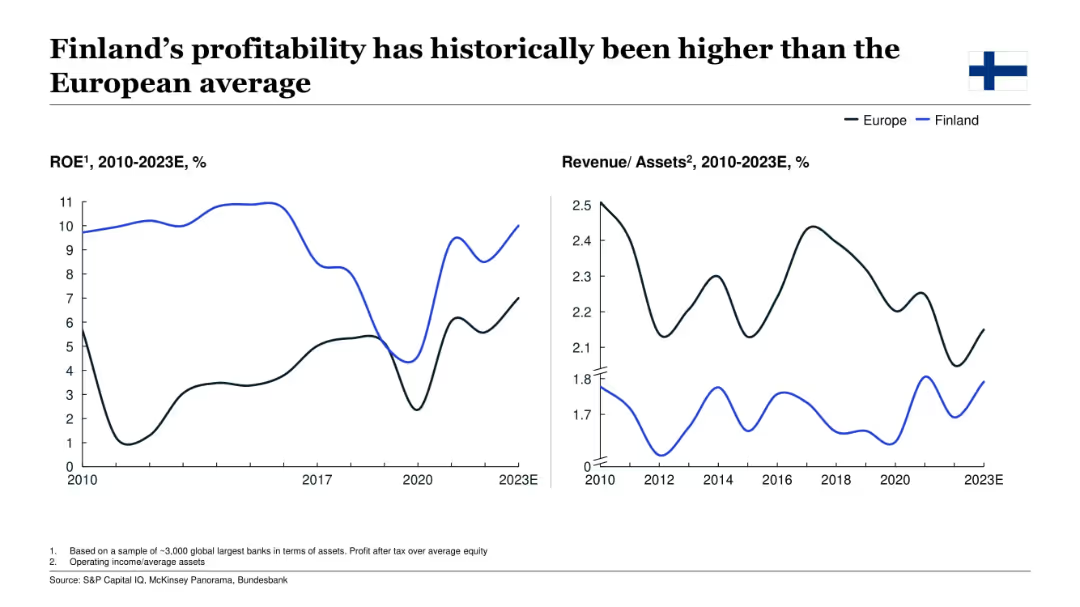
Dual line charts showing Finland’s ROE and revenue/assets from 2010–2023E, compared to the European average.
Financial Performance
Financial Services
This slide focuses on Finland’s bank performance, showing historically higher ROE versus the European average, though revenue/assets are lower. It underscores sustained profitability and offers insight into the structural dynamics of Finnish banking institutions.
Finland, profitability, ROE, revenue/assets, European banks, finance, historical trend
false
Financial Performance
Financial Services financial-services
Multiple Chart
McKinsey
View slide
Contains icons representing various Fintech services and column charts showing VC funding trends and the rise of Fintech "Unicorns".
Market Analysis and Trends
Financial Services
Introduces the Fintech landscape, highlighting service adoption, VC funding trends, and growth in sector innovators.
Fintech, Adoption, VC Funding, Unicorns, Market Trends, Financial Services
false
Market Analysis and Trends
Financial Services financial-services
Multiple Chart
Citigroup
View slide
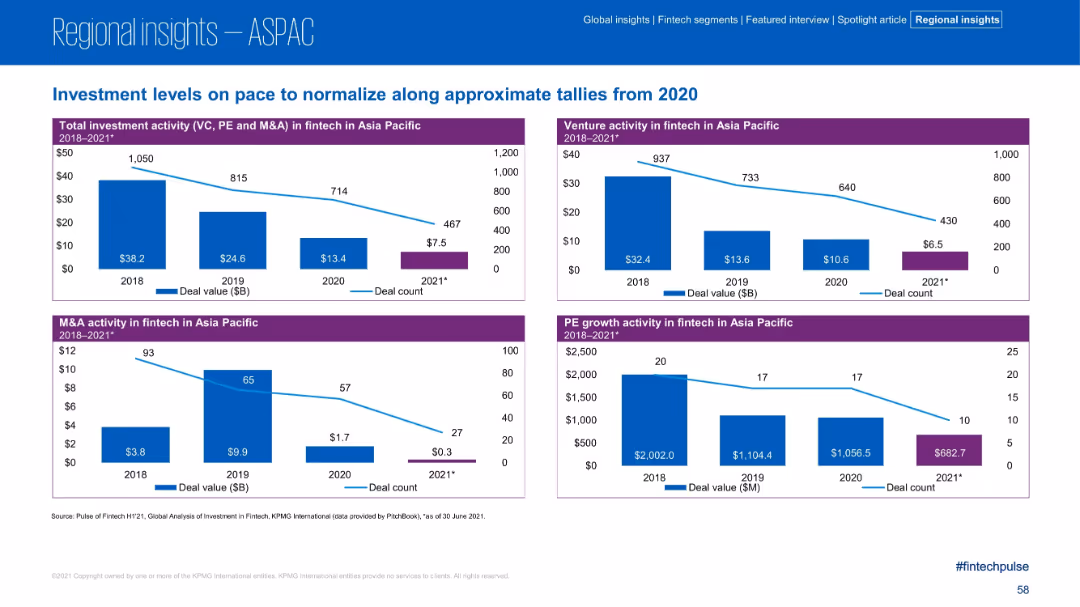
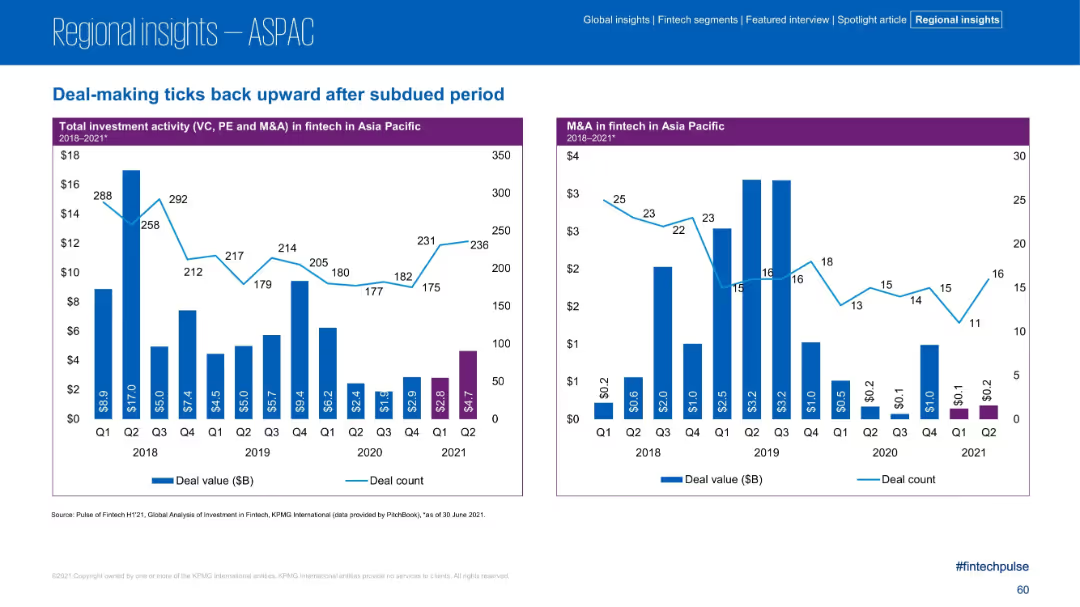
Four-panel bar and line charts comparing deal value and count for VC, PE, and M&A from 2018–2021 in ASPAC.
Market Analysis and Trends
Financial Services
This slide illustrates the decline in fintech investment activity across the Asia Pacific region from 2018 to 2021. Each panel focuses on a different segment—venture, M&A, and PE—with deal value and count both trending downward across the board.
Fintech, Asia Pacific, Investment, Deal Flow, M&A, PE, VC, Trends
false
Market Analysis and Trends
Financial Services financial-services
Multiple Chart
KPMG
View slide
Contains icons and statistics related to Fintech, Buy Now Pay Later, and the Rental industry, with projected market values and growth rates.
Market Analysis and Trends
Financial Services
Discusses Experian's growth opportunities in various emerging sectors like Fintech and Buy Now Pay Later, highlighting the potential for innovation and market expansion.
Fintech, Buy Now Pay Later, market growth, innovation, Experian
false
Market Analysis and Trends
Financial Services financial-services
Header Vertical
Barclays
View slide
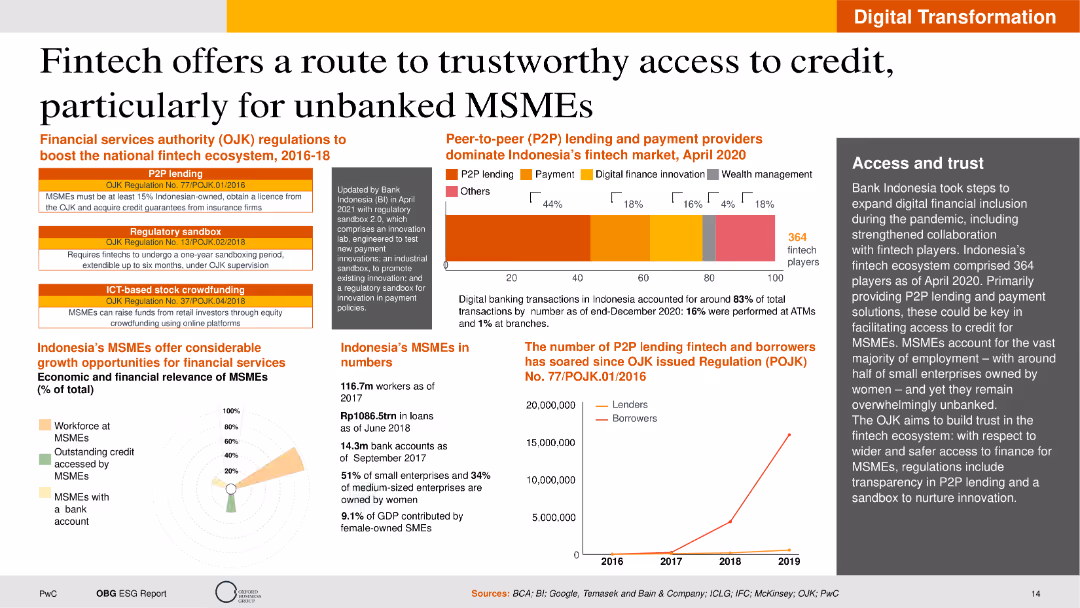
The slide includes text sections on fintech regulations, a bar chart on fintech market share, and statistical data on MSMEs. The layout is detailed but organized to separate different data points clearly.
Technology and Digital Transformation
Financial Services
This slide explores the role of fintech in providing access to credit for MSMEs in Indonesia. It covers regulatory frameworks, market share of fintech services, and the economic impact of fintech on small and medium enterprises.
Fintech, Credit, MSMEs, Regulations, Indonesia
false
Technology and Digital Transformation
Financial Services financial-services
Multiple Chart
PwC/Strategy&
View slide
The slide has a split layout with the left side listing new players in payments, lending, and wealth management along with their logos. The right side shows four short text blocks with key strategic insights. There's also a small section on the bottom left with icons representing new technological developments.
Market Analysis and Trends
Financial Services
This slide compares traditional banking with emerging fintech disruptors, focusing on payments, lending, and wealth management. It presents key challenges like unbundling by new players and lower costs. It's used to analyze shifts in the financial industry and strategize on value propositions.
Fintech, Disruption, Banking, Payments, Lending, Wealth Management, Big Data, Blockchain, Cloud, AI
false
Market Analysis and Trends
Financial Services financial-services
Boxed
Morgan Stanley
View slide
Title slide with a cityscape background, introducing a talk on the impact of Fintech on the financial services industry.
Industry Overview
Financial Services
Sets the stage for a presentation on Fintech’s influence on financial services, likely opening a detailed discussion.
Fintech, Financial Services, Industry Change, Innovation, Strategic Partnerships
false
Industry Overview
Financial Services financial-services
Title
Citigroup
View slide
The slide is moderately complex with a mix of textual content and images. The left side details the acquisition of a fintech company, while the right side shows a flow diagram of the healthcare provider revenue cycle management value chain. The focal point of the fintech acquisition is highlighted, and the company's healthcare vertical is briefly overviewed. The design is clean and organized, utilizing the brand's color palette.
Strategic Planning
Financial Services
This slide communicates the strategic acquisition of a fintech company to enhance payment reconciliation services for healthcare providers. It depicts how this acquisition aligns with the company’s digital strategy and treasury management services, offering a glance at the broader strategic growth within the healthcare vertical.
Fintech, Healthcare, Strategic Acquisition, Revenue Cycle Management, Digital Payments, Managed Services, Growth Strategy, Treasury Management
false
Strategic Planning
Financial Services financial-services
Header Horizontal
Morgan Stanley
View slide
Two bar charts tracking quarterly investment and M&A in fintech across ASPAC from 2018–2021.
Market Analysis and Trends
Financial Services
This slide tracks quarterly fintech deal values and counts in ASPAC, indicating a slight recovery in Q2 2021 following a sustained dip. M&A values remained low but deal counts began to rise again.
Fintech, Quarterly Deals, M&A, VC, Recovery, ASPAC
false
Market Analysis and Trends
Financial Services financial-services
Multiple Chart
KPMG
View slide
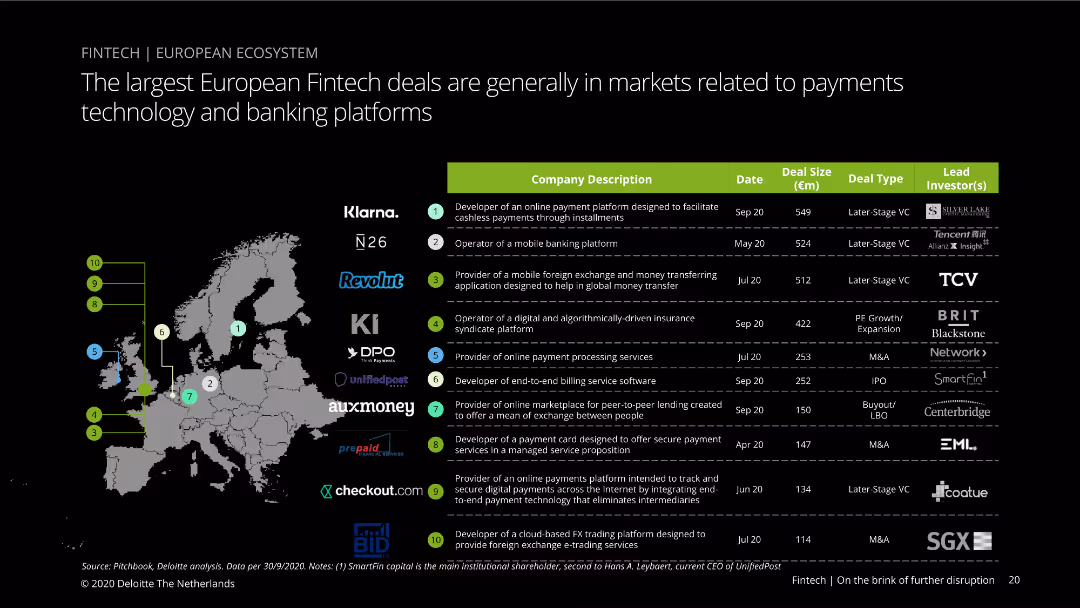
The slide features a map of Europe with markers indicating the location of fintech companies involved in significant deals. A table lists company names, descriptions, deal sizes, dates, and lead investors. Visual complexity is moderate to advanced.
Market Analysis and Trends
Financial Services
The slide presents the top fintech deals in Europe, highlighting key players, deal sizes, and leading investors. It's useful for analyzing trends in fintech investment and identifying major market players.
Fintech, deals, Europe, investors, companies, trends, market
false
Market Analysis and Trends
Financial Services financial-services
Table
Deloitte
View slide
This slide has bar graphs comparing the fintech lending market size in tier 2 and tier 3 cities with textual annotations for clarity.
Market Analysis and Trends
Financial Services
It assesses the growth of consumer lending within the digital space, informative for financial services and market trend analysis.
Fintech, lending, market growth, digital space, consumer behavior, tier 2, tier 3, market analysis
false
Market Analysis and Trends
Financial Services financial-services
Mixed Chart
Kearney
View slide
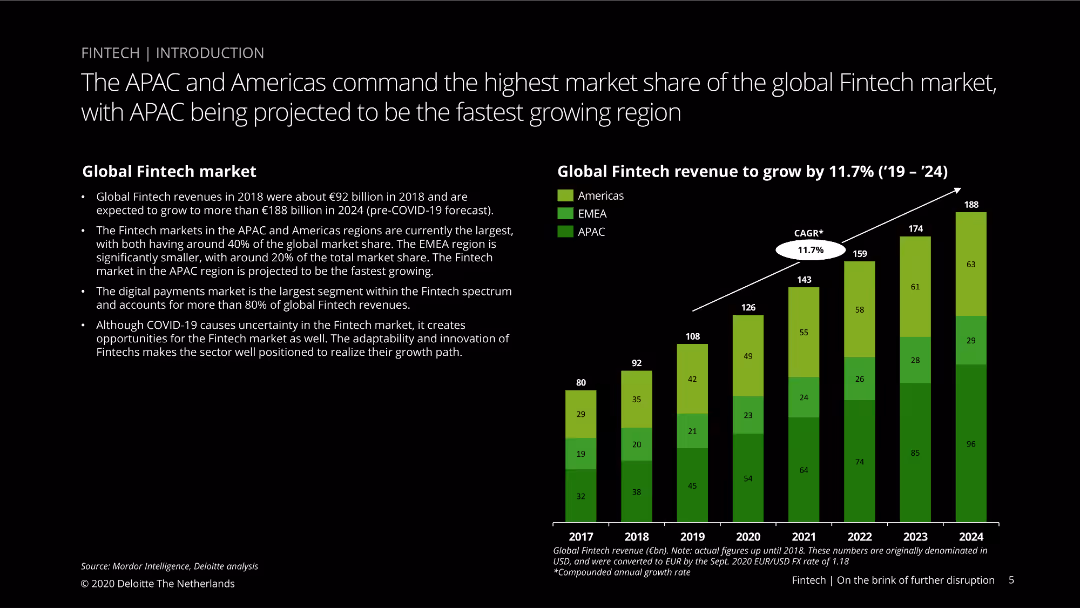
This slide features a column chart showing global fintech revenue growth from 2017 to 2024, segmented by region (Americas, EMEA, APAC), with green, yellow, and blue colors.
Market Analysis and Trends
Financial Services
Discusses the global fintech market size and growth projections, highlighting the dominance of the APAC and Americas regions and the impact of COVID-19 on fintech growth opportunities.
Fintech, market share, APAC, Americas, EMEA, growth, COVID-19, projections, digital payments, innovation
false
Market Analysis and Trends
Financial Services financial-services
Mixed Chart
Deloitte
View slide
Involves a collection of column charts, tables, and textual analysis with a consistent color scheme. The layout is systematic and packed with data.
Risk Assessment and Management
Financial Services
Discusses the supervision of firmwide assets, their classes, and distribution, which is pertinent for risk management and strategic planning.
Firmwide, Assets, Supervision, Risk, Management, Strategic, Planning, Asset Class, Distribution, Classes
false
Risk Assessment and Management
Financial Services financial-services
Multiple Chart
Goldman Sachs
View slide
A balance of text and graphics, showing the bank's strengths and how it aligns with J.P.Morgan's strategies, accompanied by a pie chart.
Mergers and Acquisitions
Financial Services
Slide compares the business models of First Republic Bank and J.P.Morgan, focusing on client service, credit performance, and strategic alignment. Suitable for M&A context or business model comparison.
First Republic Bank, client service, credit performance, strategic alignment, loan portfolio, high-growth markets, talent acquisition
false
Mergers and Acquisitions
Financial Services financial-services
Mixed Chart
JP Morgan
View slide
Features a comparative column chart of revenue and expenditure for Namibia from 2022/23 to 2024/25. Each year is represented with dual bars for revenue and expenses, colored distinctly in red and grey, alongside deficit annotations. The design is straightforward with clear labels.
Financial Performance
Government & Public Sector
Analyzes the balance between revenue and expenditures in Namibia's budget, highlighting fiscal challenges and planning for deficit management. Useful for governmental financial strategy and public administration.
Fiscal Balance, Revenue, Expenditure, Namibia, Government Finance
false
Financial Performance
Government & Public Sector government-and-public-sector
Single Chart
PwC/Strategy&
View slide
This slide presents a column chart detailing expenditure trends over a decade and a dotted line illustrating expenditure as a percentage of GDP, along with a sidebar on wage containment measures.
Regulatory and Compliance
Government & Public Sector
Discusses strategic measures to manage and consolidate government expenditure, including wage bill controls.
Fiscal consolidation, expenditure trends, wage control, budget
false
Regulatory and Compliance
Government & Public Sector government-and-public-sector
Mixed Chart
PwC/Strategy&
View slide
Contains a line chart and an area chart illustrating fiscal revenue and expenditure, and the pace of central and local government bond issuance over time.
Regulatory and Compliance
Government & Public Sector
Analyzes China's fiscal policy with data on revenue, expenditure, and bond issuance, providing insights into government financial strategies and public sector funding.
Fiscal policy, China, Government, Revenue, Expenditure, Bonds, Public sector, Financial analysis, Economic data
false
Regulatory and Compliance
Government & Public Sector government-and-public-sector
Multiple Chart
JP Morgan
View slide
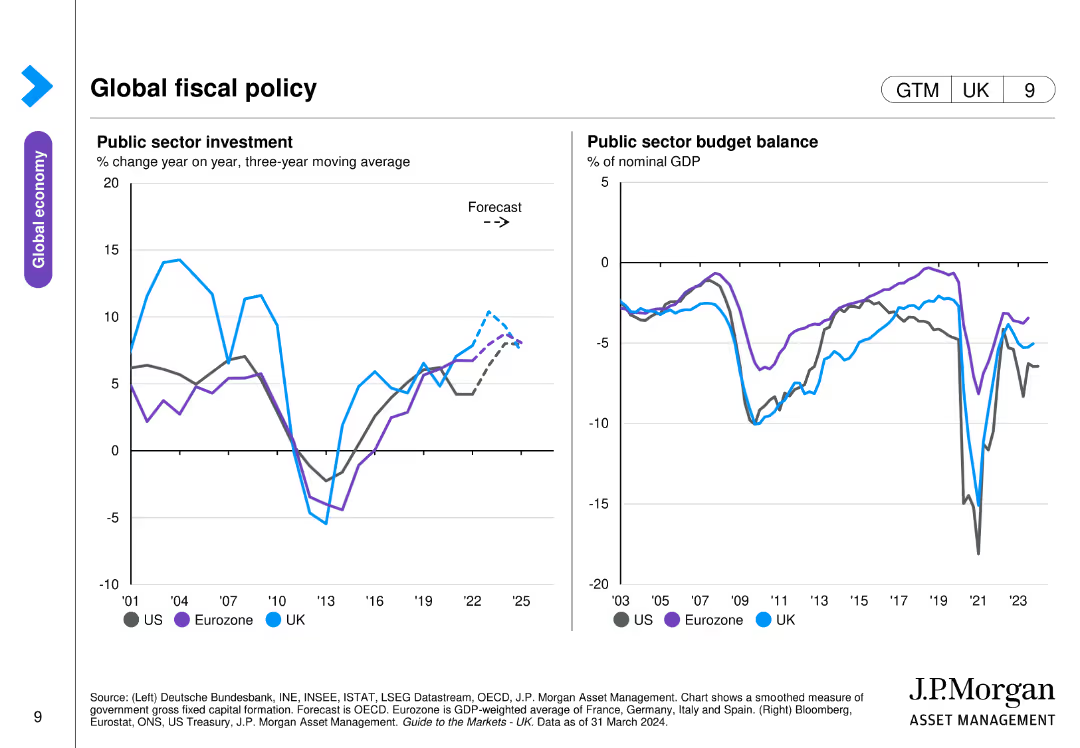
The slide features two line charts, one showing public sector investment as a percentage of GDP and another depicting public sector budget balance for the US, Eurozone, and UK.
Strategic Planning
Government & Public Sector
This slide provides an overview of public sector investment and budget balance trends, essential for analyzing fiscal policy and its economic impacts.
Fiscal policy, public investment, budget balance, GDP, government finance
false
Strategic Planning
Government & Public Sector government-and-public-sector
Multiple Chart
JP Morgan
View slide
Includes two vertical column charts and one line chart depicting budget deficit and public debt trends. The slide is color-coordinated with a clear division between the charts.
Strategic Planning
Government & Public Sector
Focuses on the fiscal consolidation efforts showing trends in budget deficit and public debt over several years. Ideal for strategic discussions on fiscal policy and debt management in governmental contexts.
Fiscal, Budget, Debt, Trends, Government
false
Strategic Planning
Government & Public Sector government-and-public-sector
Multiple Chart
PwC/Strategy&
View slide
A minimalistic design with the title text prominently displayed against a light blue geometric background.
Investment Analysis
Financial Services
This slide presents the fiscal year and quarter, highlighting its purpose as an investor presentation. It is used to set the context for the financial information that will follow.
Fiscal, Quarter, Investor, Presentation, Financial
false
Investment Analysis
Financial Services financial-services
Title
Booz Allen Hamilton
View slide
Slide with a comparison chart showing the purchase decisions in the fitness industry related to initial consideration, active evaluation, and loyalty. It compares fitness with other industries like airlines, hotels, and streaming entertainment.
Competitive Landscape
Healthcare & Pharmaceuticals
Highlights the importance of brand consideration and loyalty in the fitness industry, showing how fitness ranks among other industries in consumer purchase decisions. Useful for strategic planning in marketing and customer loyalty enhancement within the fitness sector.
Fitness industry, consumer loyalty, purchase decisions, competitive analysis, brand strategy
false
Competitive Landscape
Healthcare & Pharmaceuticals healthcare-and-pharmaceuticals
Mixed Chart
McKinsey
View slide
Slide contains multiple bar charts comparing the usage rates of different fitness products and services between 2020 and 2022. It includes sections for 'Outside of home', 'At-home', and 'Digital', highlighting increases in participation and projected future spending.
Market Analysis and Trends
Healthcare & Pharmaceuticals
Focuses on the growth of fitness participation across various categories with a particular boost in at-home and digital fitness due to health consciousness. The slide provides detailed insights into consumer behavior changes over time and anticipated future spending. Could be useful in analyzing market shifts in the fitness industry.
Fitness trends, consumer behavior, digital fitness, market growth, spending forecast
false
Market Analysis and Trends
Healthcare & Pharmaceuticals healthcare-and-pharmaceuticals
Mixed Chart
McKinsey
View slide
Features a column charts displaying the change in fitness activities before, during, and after COVID-19 lockdowns.
Market Analysis and Trends
Healthcare & Pharmaceuticals
Analyzes trends in fitness behavior changes over the course of the pandemic, illustrating consumer adoption of hybrid routines involving digital and traditional fitness methods.
Fitness, Hybrid, COVID-19, Trends, Bar Charts, Consumer Behavior, Health, Digital
false
Market Analysis and Trends
Healthcare & Pharmaceuticals healthcare-and-pharmaceuticals
Multiple Chart
McKinsey
View slide
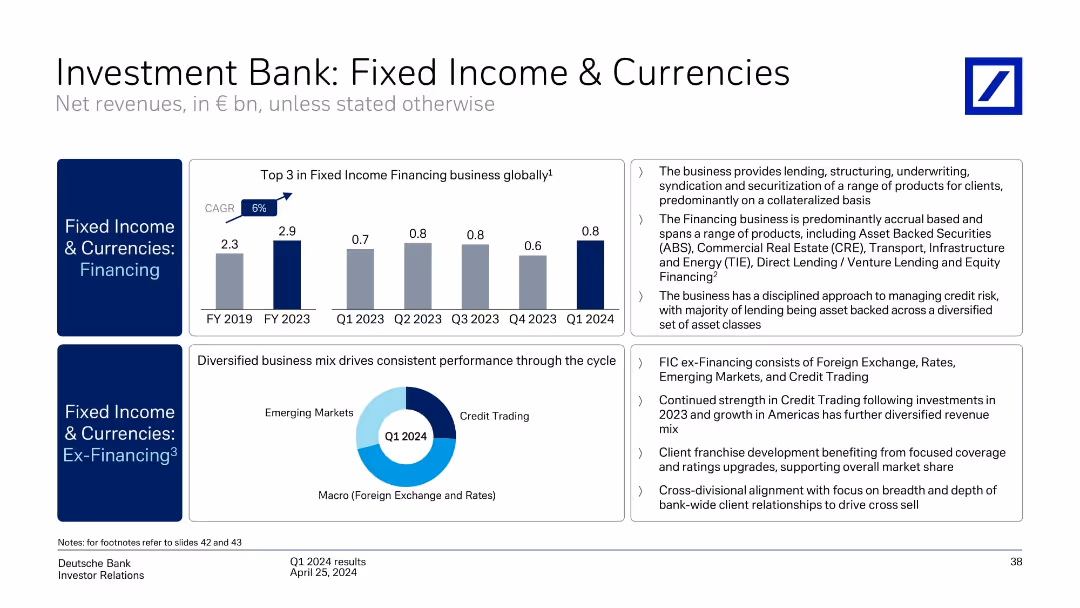
Split layout with two blue sidebar sections, bar chart on top left, donut chart on bottom center, text boxes on the right side.
Performance Metrics and KPIs
Financial Services
The slide presents financial performance for Deutsche Bank’s Fixed Income & Currencies division, showing growth in financing revenue (CAGR 6%) and diversified revenue in ex-Financing segments. Text explains business structure and strategic priorities.
Fixed Income, Currencies, Credit Trading, Revenue, Q1 2024, KPIs, Financing, Performance, Macro, Risk Management
false
Performance Metrics and KPIs
Financial Services financial-services
Multiple Chart
Deutsche Bank
View slide
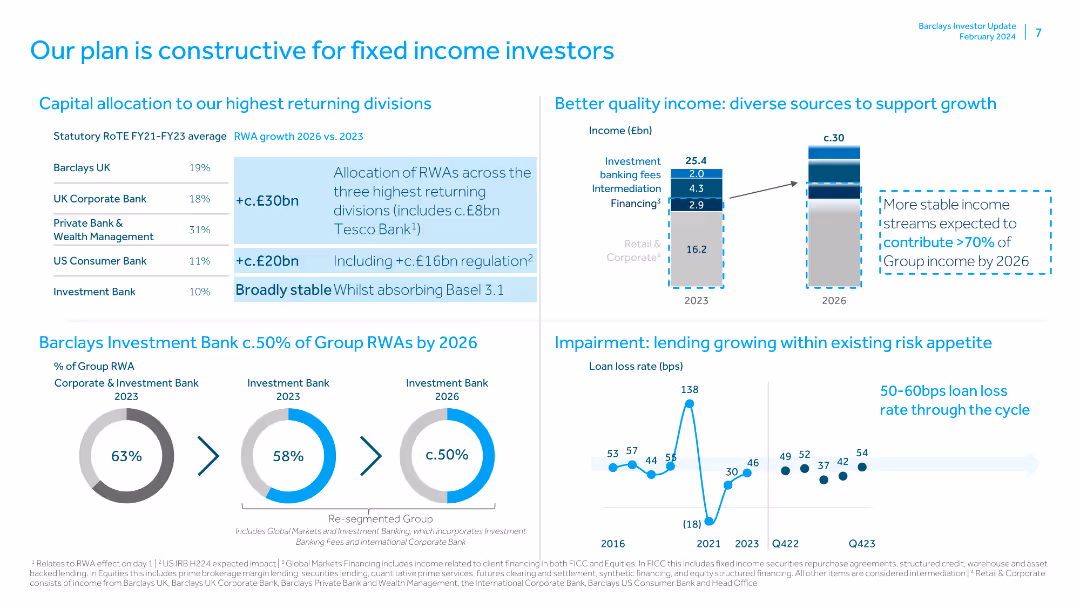
The slide includes a table of capital allocation by divisions, a bar chart of income sources, pie charts of group RWAs, and a line chart of loan loss rates, with text highlights.
Investment Analysis
Financial Services
The slide presents a plan for fixed income investors, focusing on capital allocation, quality income sources, and lending within risk appetite, supported by detailed data and projections.
Fixed Income, Investors, Capital, Allocation, Income, Risk
false
Investment Analysis
Financial Services financial-services
Multiple Chart
Barclays
View slide
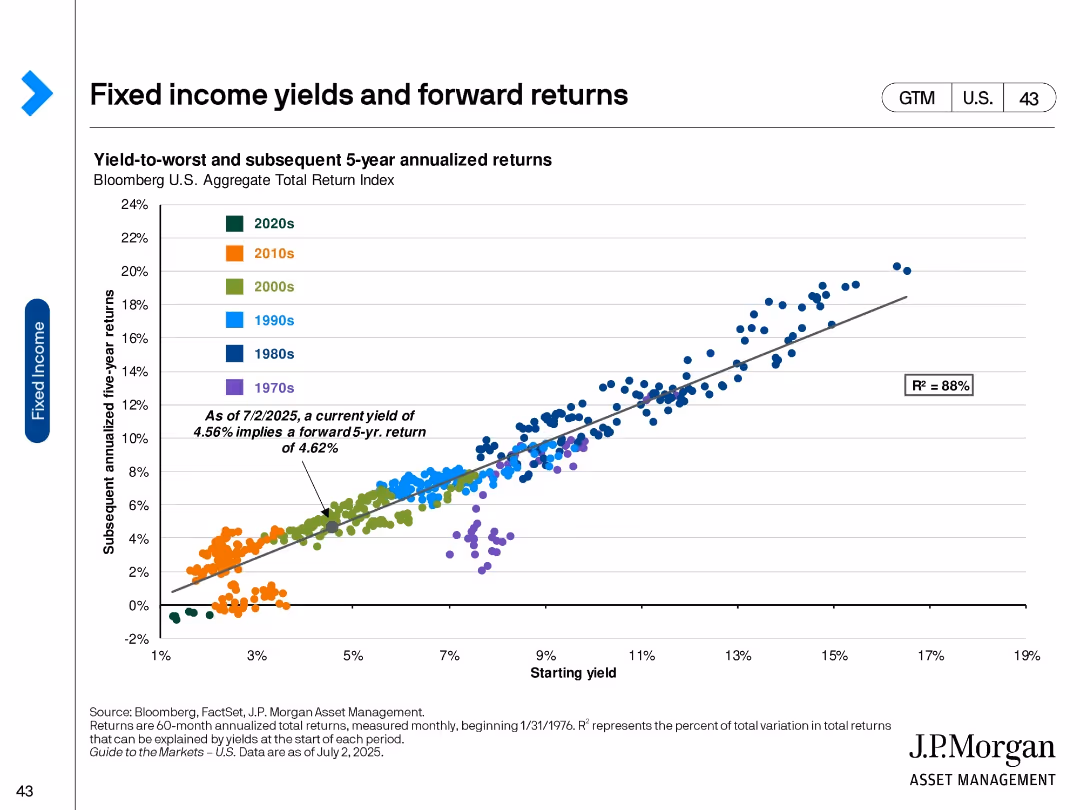
Scatter plot of starting yield vs. 5-year forward returns with color-coded historical data points.
Investment Analysis
Financial Services
Demonstrates the strong relationship between starting fixed income yields and forward 5-year returns using historical data. Shows that higher starting yields tend to correlate with better future performance, supported by R² of 88%.
Fixed income, forward return, yield curve, total return, investment forecast, bond analysis, historical data
false
Investment Analysis
Financial Services financial-services
Single Chart
JP Morgan
View slide
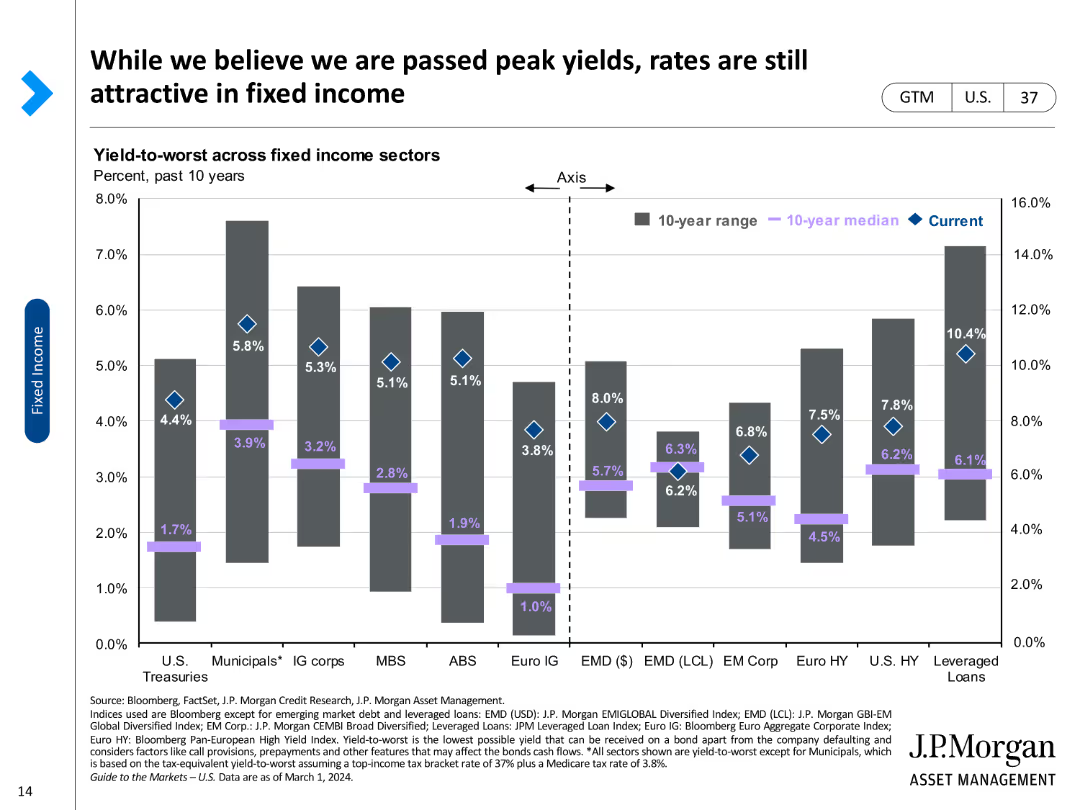
A column chart comparing yield-to-worst across various fixed income sectors, marked with current rates and historical medians.
Investment Analysis
Financial Services
Reviews yield-to-worst metrics across different fixed income sectors, highlighting investment attractiveness in the current market.
Fixed income, yield-to-worst, investment, bonds, sectors, median, current rates, attractiveness, analysis
false
Investment Analysis
Financial Services financial-services
Single Chart
JP Morgan
View slide
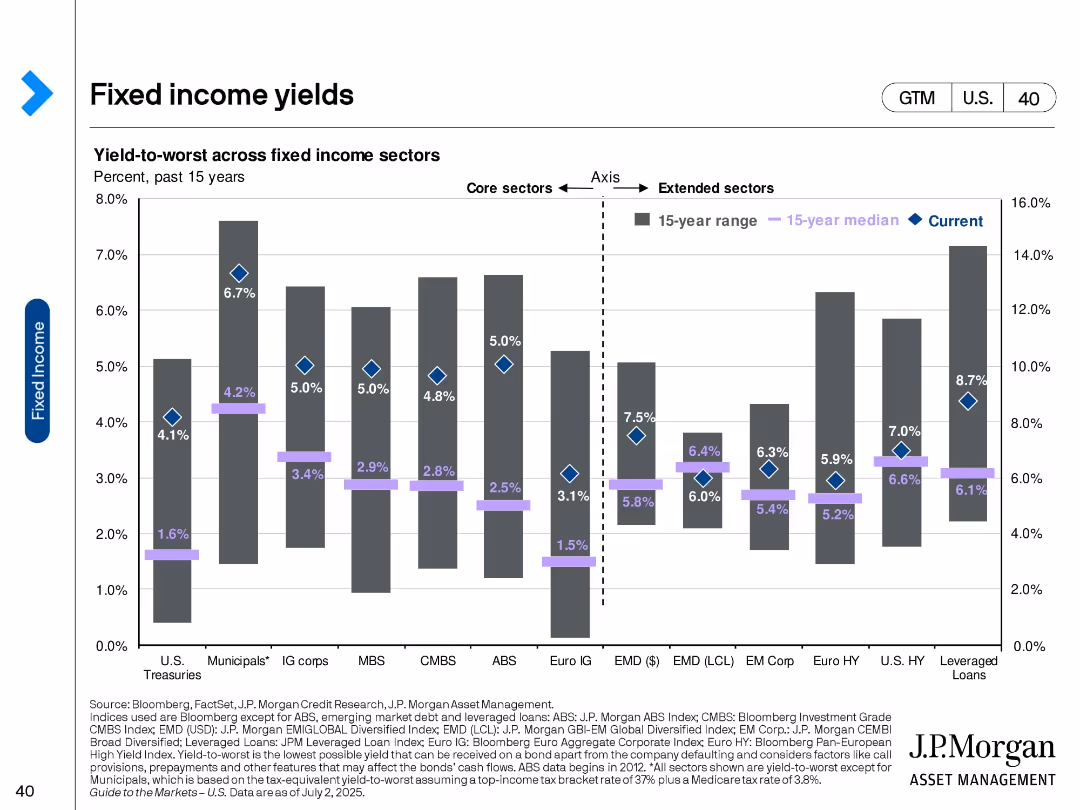
Bar chart with diamond markers comparing current, 15-year median, and range of yields across fixed income sectors.
Investment Analysis
Financial Services
This slide presents yield-to-worst data across core and extended fixed income sectors, showing how current yields compare to historical norms. It highlights opportunities in areas like leveraged loans and high-yield bonds.
Fixed income, yields, investment returns, sector analysis, bonds, interest rates, historical comparison, risk-return, income strategy
false
Investment Analysis
Financial Services financial-services
Single Chart
JP Morgan
Previous
Loading...
Hold On!
We are searching in our database
If nothing, comes up, please try different filters!
Column Chart
Heatmap
Chevron
Org Chart
Infographic
Callouts
Timeline
List
Graphic
Picture
Process Flow
Diagram
Paragraph
Map
Table
Framework
Subtitle
Takeaway Box
Icon
Other Chart
Radar Chart
Waterfall Chart
Mekko Chart
Pie Chart
Scatter Plot
Line Chart
Bar chart
Bullet points
Create a FREE account to continue browsing
Receive Instant Access to 1,000+ slides from companies like McKinsey, Google, and Goldman Sachs
First Name
Last Name
Email
Password
I agree to all
Terms & Privacy Policy
Thank you! Your submission has been received!
Oops! Something went wrong while submitting the form.
Have an account?
Sign in
Upgrade to PRO to Save slides
Advanced Search and Filters
Access to 15,000+ slides
Access to Category Pages
Save/Bookmark Slides
PowerPoint Template Library
Pick a Plan
MONTHLY
$12/month
Billed every month, Cancel anytime.
YEARLY
$9/year
Billed $108 annually, Cancel anytime.
Checkout for $12/month
Checkout for $108/yr
Secured by Stripe | AES-256 bit encryption