My Account
My Slides
Search by Category
Templates
View All Templates
Download Template Slides
Leave Feedback
Login
Logout
Get Started
Browse all Slides
Browse all Slides
Create a FREE Account
Instant access to 1,000+ real slides from top companies like McKinsey, BCG, Goldman Sachs, Google and many more!
First Name
Last Name
Email
Password
I agree to all
Terms & Privacy Policy
Thank you! Your submission has been received!
Oops! Something went wrong while submitting the form.
Have an account?
Sign in
Spark Your Next Big Idea with New Presentation Templates
VIEW ALL Templates
Welcome,
Welcome
PRO
Show Featured Only
Checkbox 8
Companies
Mckinsey
Bain
BCG
EY
Deloitte
Accenture
PwC/Strategy&
JP Morgan
Goldman Sachs
Morgan Stanley
Citigroup
Deutsche Bank
Barclays
LEK
KPMG
Kearney
Oliver Wyman
Booz Allen Hamilton
Gartner
IPSOS
Nielsen
Slide type
Text Only
Linear Flow
Vertical Flow
Single Chart
Header Horizontal
Mixed Chart
Header Vertical
Pillar
Multiple Chart
Graphic
Agenda
Title
Table
Framework
Industry
Technology & Software
Artificial Intelligence
Financial Services
Retail & E-commerce
Consumer Goods
Industrial & Manufacturing
Transportation & Logistics
Telecommunications
Real Estate & Construction
Hospitality & Tourism
Professional Services
Education & Training
Media & Entertainment
Agriculture & Food Production
Healthcare & Pharmaceuticals
Environmental Services & Sustainability
Government & Public Sector
Use Case
Mergers and Acquisitions
Performance Metrics and KPIs
Client Case Studies
Competitive Landscape
Corporate Finance and Valuation
Product and Service Analysis
Customer and Market Segmentation
Organizational Structure and Change
Industry Overview
Regulatory and Compliance
Risk Assessment and Management
Investment Analysis
Organizational Structure and Change
Human Resources and Talent Management
Financial Performance
Market Analysis and Trends
Sales and Business Development
Human Resources and Talent Management
Clear all
Thank you! Your submission has been received!
Oops! Something went wrong while submitting the form.
Tag
View slide
Presents a timeline and a column chart reflecting the growth in FoodTech investments over the years, identifying key areas of focus like AgTech and Food Science. Includes annotations for significant startups and initiatives.
Investment Analysis
Agriculture & Food Production
Provides a comprehensive view of the investment landscape in the European FoodTech sector, with specific emphasis on sustainable and technology-driven initiatives.
FoodTech, investment, Europe, sustainability, AgTech
false
Investment Analysis
Agriculture & Food Production agriculture-and-food-production
Mixed Chart
Accenture
View slide
This slide includes a column chart detailing investments in the European FoodTech sector by category from 2014 to 2020, emphasizing shifts in investment focus.
Investment Analysis
Agriculture & Food Production
Analyzes investment trends in the FoodTech sector, noting a shift from delivery services to more comprehensive solutions involving the entire food supply chain, focusing on sustainability and technological integration.
FoodTech, investments, trends, sustainability, technology
false
Investment Analysis
Agriculture & Food Production agriculture-and-food-production
Mixed Chart
Accenture
View slide
Slide includes icons, heavy text and a pie chart with detailed analysis of the distribution of startups within the FoodTech sector.
Investment Analysis
Agriculture & Food Production
Provides quantitative insights into the distribution of startups across various trends in the FoodTech sector.
FoodTech, startups, trends, analysis, distribution
false
Investment Analysis
Agriculture & Food Production agriculture-and-food-production
Mixed Chart
Accenture
View slide
Sectioned text blocks discussing major trends in food technology, alongside relevant imagery and bullet points.
Technology and Digital Transformation
Agriculture & Food Production
Explores the key trends driving innovation in the Swiss FoodTech industry, focusing on sustainability, transparency, and efficiency.
FoodTech, trends, innovation, sustainability, transparency
false
Technology and Digital Transformation
Agriculture & Food Production agriculture-and-food-production
Header Vertical
Accenture
View slide
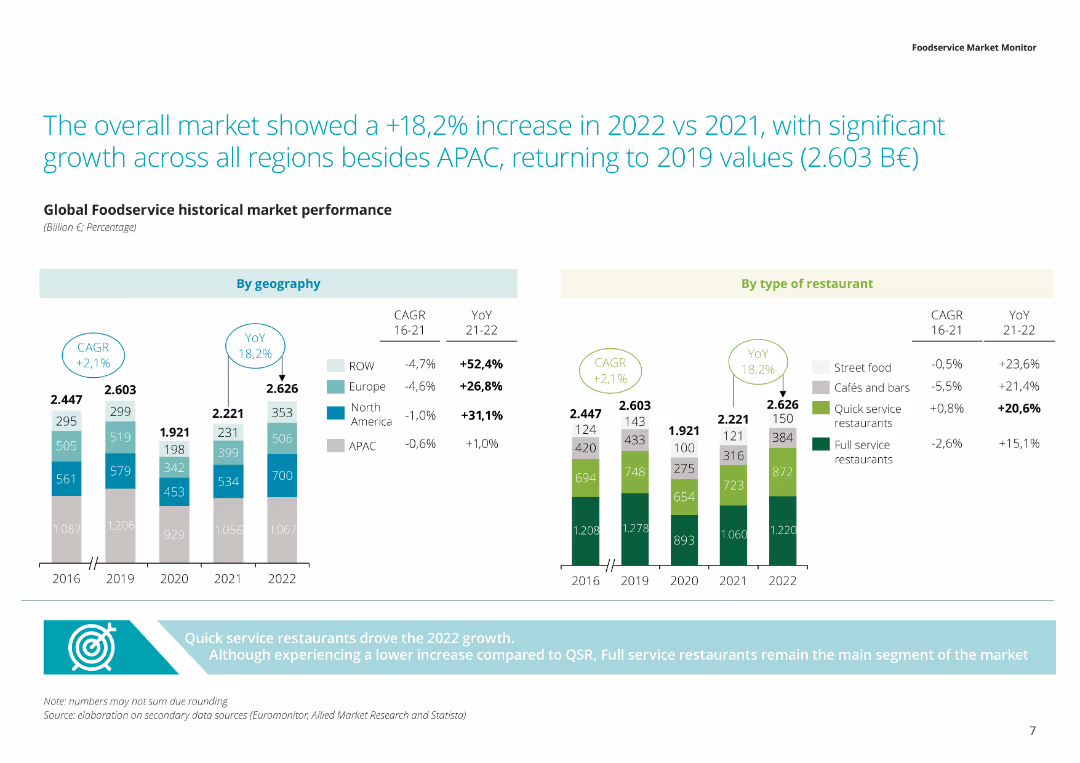
The slide includes a stacked column chart with green, gray, and blue segments representing different types of restaurants and their distribution across regions.
Market Analysis and Trends
Consumer Goods
Presents data on the global foodservice market, highlighting the distribution of various restaurant types across regions, and the overall market size in 2022.
Foodservice market, restaurant types, global distribution, market size, regional analysis
false
Market Analysis and Trends
Consumer Goods consumer-goods
Multiple Chart
Deloitte
View slide
A slide presenting an external study's findings on the F-150's status as the most American-made full-size pickup.
Product and Service Analysis
Transportation & Logistics
Discusses the significance of the Ford F-150 in the American auto industry, its sales, and its rank as an American-made vehicle.
Ford F-150, American-made, auto industry, truck sales, vehicle classification, market analysis, competitive ranking
false
Product and Service Analysis
Transportation & Logistics transportation-and-logistics
Single Chart
BCG
View slide
A split slide with textual information on the left about job impact and an image of a worker on the right.
Human Resources and Talent Management
Transportation & Logistics
Analyzes the job creation impact of the F-Series across various sectors, with a focus on multiplier effects.
Ford, F-Series, job impact
false
Human Resources and Talent Management
Transportation & Logistics transportation-and-logistics
Single Chart
BCG
View slide
A slide with a green background and four numbered images representing the report's content sections.
Financial Performance
Transportation & Logistics
Summarizes the report's content, which includes employment, GDP, manufacturing, and usage impact of the F-Series.
Ford, F-Series, report, contents, employment, GDP, manufacturing, usage
false
Financial Performance
Transportation & Logistics transportation-and-logistics
Agenda
BCG
View slide
A green and white slide detailing Ford's contribution to US GDP, including manufacturing and multiplier effects.
Financial Performance
Transportation & Logistics
Captures the overarching economic contribution of Ford to the US GDP, with a focus on manufacturing, sales, and associated multiplier effects from employee spending.
Ford, US GDP, economic contribution, manufacturing, multiplier effects, vehicle sales, after-sales service, community impact
true
Financial Performance
Transportation & Logistics transportation-and-logistics
Single Chart
BCG
View slide
Slide depicting the number of jobs supported by Ford USA, with a bar graph and a worker assembling a vehicle in the background.
Human Resources and Talent Management
Transportation & Logistics
This slide quantifies the impact of Ford USA on job creation, illustrating the multiplier effect of Ford employment on the broader economy.
Ford, employment, multiplier effect, American jobs, automotive industry, manufacturing, dealers, community impact
false
Human Resources and Talent Management
Transportation & Logistics transportation-and-logistics
Single Chart
BCG
View slide
A graph displays patent family citations in future mobility against a teal background, accompanied by statistical highlights.
Strategic Planning
Transportation & Logistics
Focuses on Ford's patents in the future of mobility sector, including AI and electric vehicles, with a high percentage of recent patents.
Ford, future of mobility, patents, autonomous, AI, electric vehicles
true
Strategic Planning
Transportation & Logistics transportation-and-logistics
Single Chart
BCG
View slide
The slide features a list layout with iconography for different industries like Aircraft monitoring and Surgical robotics.
Client Case Studies
Transportation & Logistics
Highlights Ford's patents being cited across industries from agriculture to biopharma with specific examples of applications.
Ford, innovation, patents, industries, agriculture, biopharma
false
Client Case Studies
Transportation & Logistics transportation-and-logistics
Boxed
BCG
View slide
Features a graph plotting the Average Competitive Impact™ against patent families and freshness percentage for various automotive companies, with a large arrow highlighting Ford's leading position.
Competitive Landscape
Transportation & Logistics
The slide communicates Ford's dominance in patent filings within the automotive industry, measuring both the quality and recentness of these patents, suggesting innovation and market leadership.
Ford, patents, automotive industry, innovation, competitive impact, market leadership
false
Competitive Landscape
Transportation & Logistics transportation-and-logistics
Single Chart
BCG
View slide
Graphical slide comparing Ford's patent impact and freshness to other auto manufacturers, with an image of a rugged terrain vehicle.
Technology and Digital Transformation
Transportation & Logistics
Illustrates Ford's innovative edge in the auto industry, as evidenced by the quality and recency of its patents.
Ford, patents, innovation, automotive industry, technology leadership, competitive impact, patent freshness, R&D
false
Technology and Digital Transformation
Transportation & Logistics transportation-and-logistics
Single Chart
BCG
View slide
A split diagram and bar chart display Ford's market share in commercial vocations.
Client Case Studies
Transportation & Logistics
Illustrates Ford's leading position in market share for commercial pickup trucks across various vocations.
Ford, pickup truck, commercial, vocations, market share
false
Client Case Studies
Transportation & Logistics transportation-and-logistics
Mixed Chart
BCG
View slide
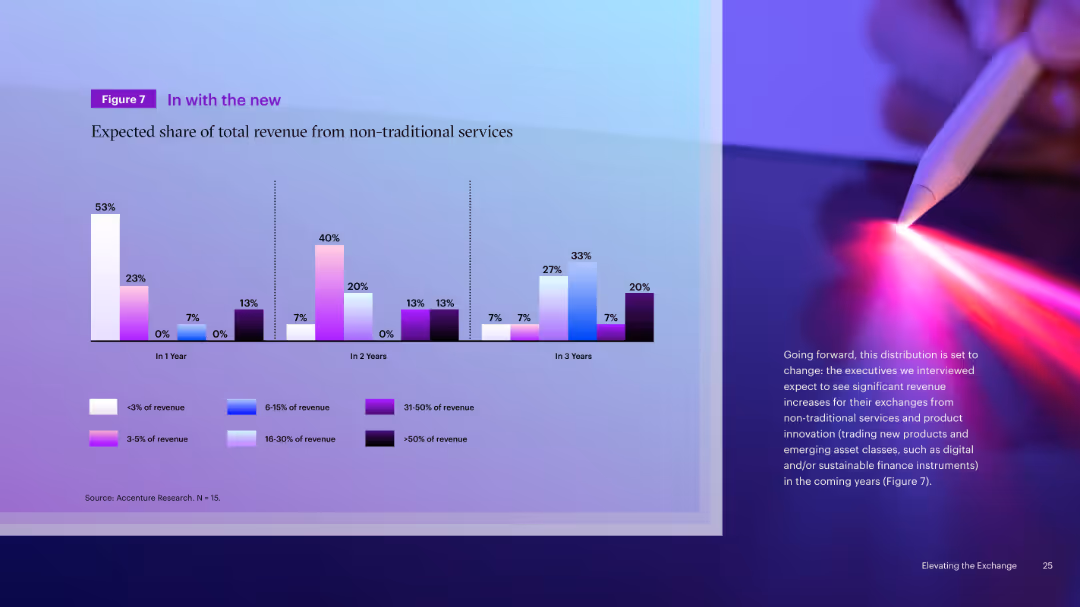
Clustered bar chart showing expected revenue shares from non-traditional services over 1, 2, and 3 years. Color-coded by revenue share range. Right image.
Strategic Planning
Financial Services
This slide forecasts increasing reliance on non-traditional services by exchanges. Executives expect significant growth in revenue from these sources, including innovations like digital asset trading and sustainable finance instruments over a 3-year horizon.
Forecast, Revenue Growth, Innovation, Non-Traditional, Exchanges, Future, Strategic Planning, Financial
false
Strategic Planning
Financial Services financial-services
Mixed Chart
Accenture
View slide
Moderate complexity with bullet points, icons, and text
Market Analysis and Trends
Environmental Services & Sustainability
This slide predicts the long-term effects of technology trends on different industries. It is useful for strategic planning and forecasting future market developments. It discusses the anticipated changes and how industries can adapt to these trends for sustainable growth.
Forecasting, Long-Term Impact, Adaptation, Market Development, Sustainability
false
Market Analysis and Trends
Environmental Services & Sustainability environmental-services-and-sustainability
Header Vertical
McKinsey
View slide
Slide includes complex elements such as key macroeconomic driver icons and a line chart comparing actual vs. model estimates of economic growth.
Operational Efficiency
Professional Services
Offers an in-depth view of Deloitte Access Economics' forecast models and their relationship with work put in place/work done in New Zealand and Australia. The slide details specific macroeconomic variables affecting forecasts and includes a visual comparison of model accuracy.
Forecasting, Macroeconomic, New Zealand, Australia, Economic Analysis, Regression Models, Accuracy, WPIP
false
Operational Efficiency
Professional Services professional-services
Mixed Chart
Deloitte
View slide
The slide shows a column chart for the years 2018, 2019, and a forecast for 2025, alongside icons representing market drivers and macroeconomic indicators.
Strategic Planning
Consumer Goods
Projects the growth of the luxury goods market to 2025, considering current trends and potential disruptions. It aims to strategize for potential market changes.
Forecasting, Macroeconomics, Market growth
false
Strategic Planning
Consumer Goods consumer-goods
Mixed Chart
Bain
View slide
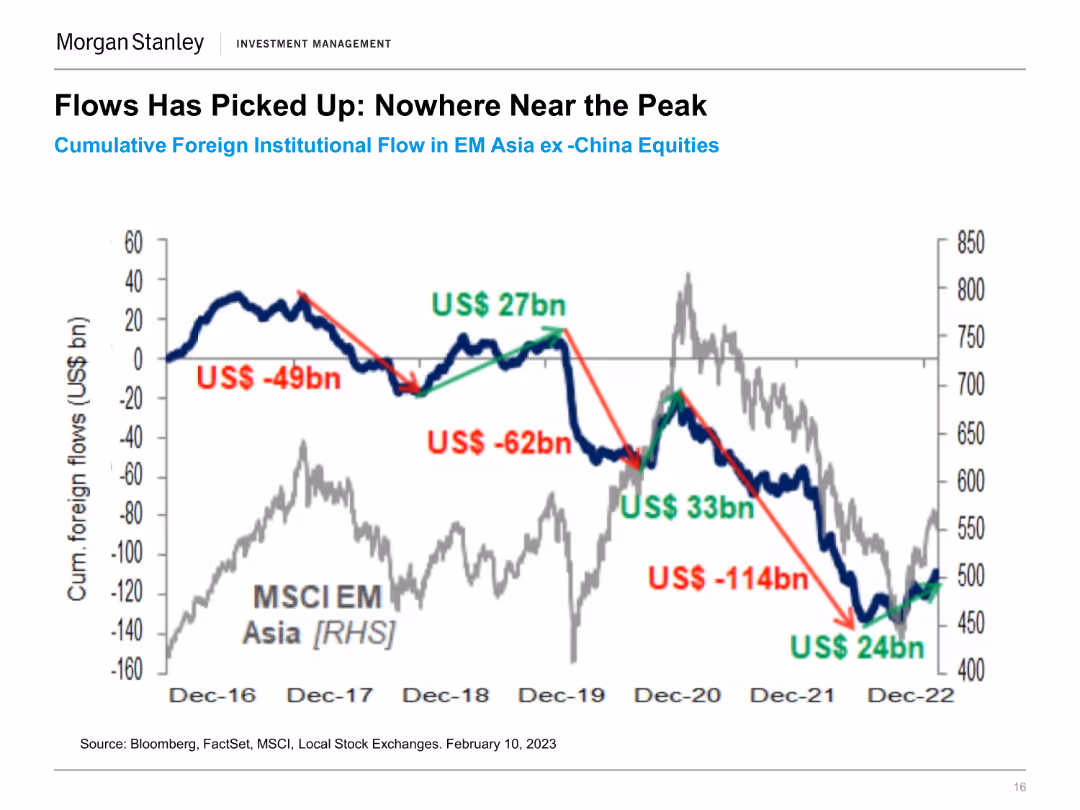
The slide includes a line chart tracking cumulative foreign institutional flow in EM Asia ex-China equities from December 2016 to February 2023. Key flow changes are highlighted.
Financial Performance
Financial Services
This slide shows the trends in foreign institutional investments in emerging market Asia, excluding China, indicating significant inflow and outflow events over the period.
Foreign Institutional Flow, EM Asia, Investment Trends, Equity Markets, Financial Performance, Market Inflows, Capital Movement, Investment Analysis
false
Financial Performance
Financial Services financial-services
Single Chart
Morgan Stanley
View slide
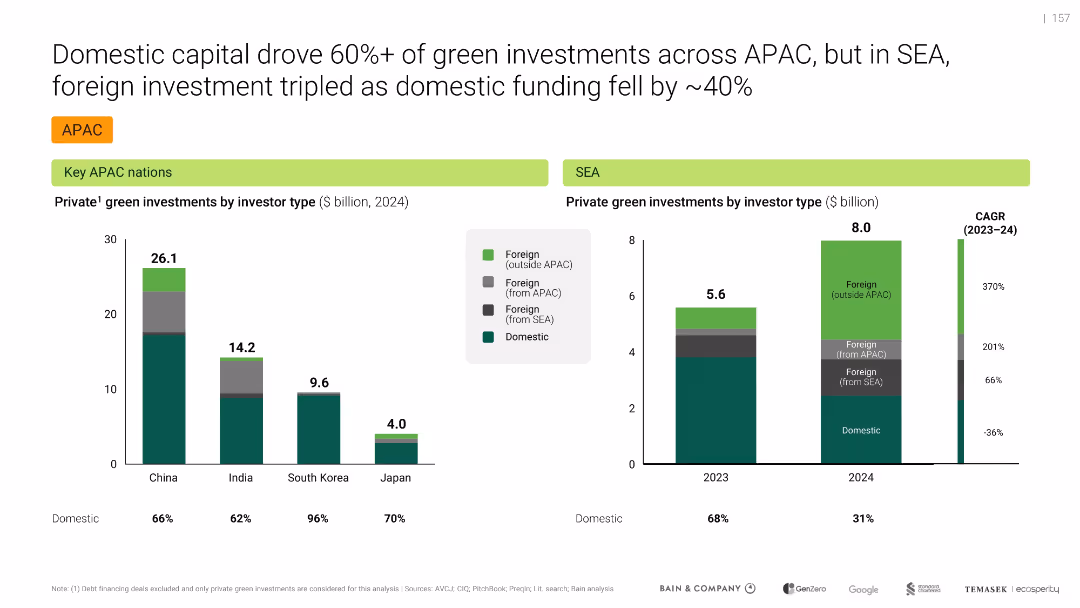
Side-by-side bar charts comparing domestic vs. foreign investment shares in APAC and SEA
Investment Analysis
Environmental Services & Sustainability
Shows a shift in SEA green investment sources: foreign capital (especially outside APAC) tripled in 2024, while domestic funding fell. Highlights domestic-heavy profiles for countries like South Korea.
Foreign investment, Domestic capital, SEA, APAC, Green funds, 2024, Capital flows, Infrastructure, Foreign vs domestic
false
Investment Analysis
Environmental Services & Sustainability environmental-services-and-sustainability
Multiple Chart
Bain
View slide
Detailed list and icons representing sectors with foreign ownership restrictions in the Philippines, structured in a clear, readable format.
Regulatory and Compliance
Government & Public Sector
Outlines foreign ownership limits in various sectors as per the Philippines' laws, providing essential information for foreign investors.
Foreign ownership, Philippines, restrictions, sectors, investment
false
Regulatory and Compliance
Government & Public Sector government-and-public-sector
Table
Deloitte
View slide
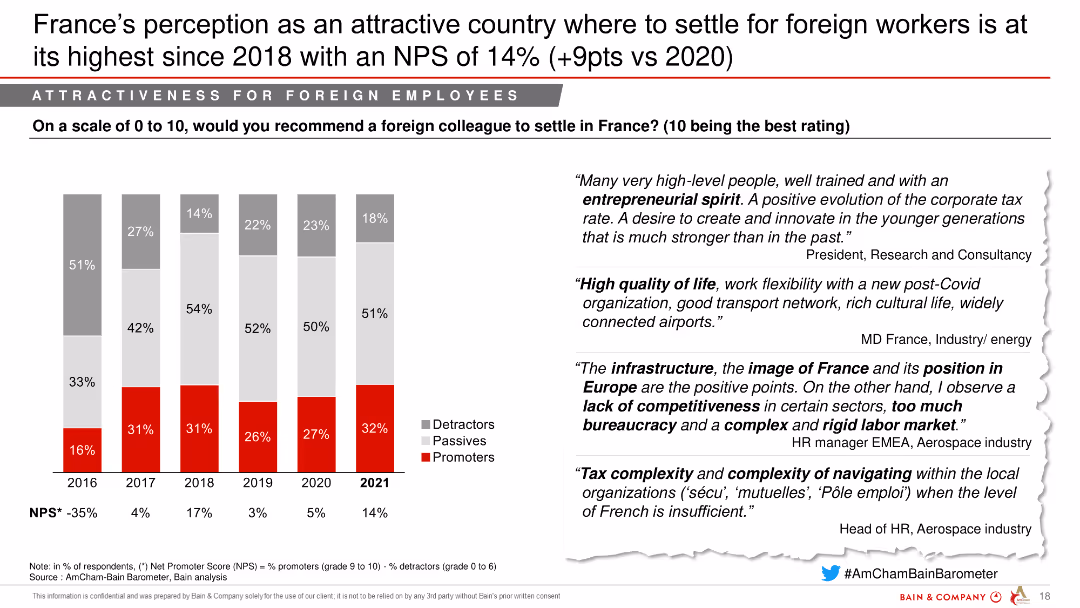
The slide features a column chart displaying the NPS of France as a destination for foreign workers from 2016 to 2021, with quotes from industry experts on the right.
Market Analysis and Trends
Government & Public Sector
This slide shows an increase in France's attractiveness for foreign workers, highlighted by a rise in its NPS score in 2021.
Foreign workers, NPS, Attractiveness, Aerospace, Defense
false
Market Analysis and Trends
Government & Public Sector government-and-public-sector
Mixed Chart
Bain
View slide
Features column charts and bullet points detailing key economic impacts and applications of Copernicus in forestry.
Industry Overview
Environmental Services & Sustainability
Explores the benefits of Earth Observation data for forestry, emphasizing improvements in forest management and economic benefits.
Forestry, Earth Observation, Management, Economic Benefits, Sustainability
false
Industry Overview
Environmental Services & Sustainability environmental-services-and-sustainability
Mixed Chart
PwC/Strategy&
View slide
Slide displays a mix of text and column chart, explaining the market impact and Copernicus applications in forestry.
Market Analysis and Trends
Environmental Services & Sustainability
Describes the historical benefits of Earth Observation for forestry, detailing how it aids in management and contributes to economic growth.
Forestry, Earth Observation, Market Impact, Economic Growth, Management
false
Market Analysis and Trends
Environmental Services & Sustainability environmental-services-and-sustainability
Mixed Chart
PwC/Strategy&
View slide
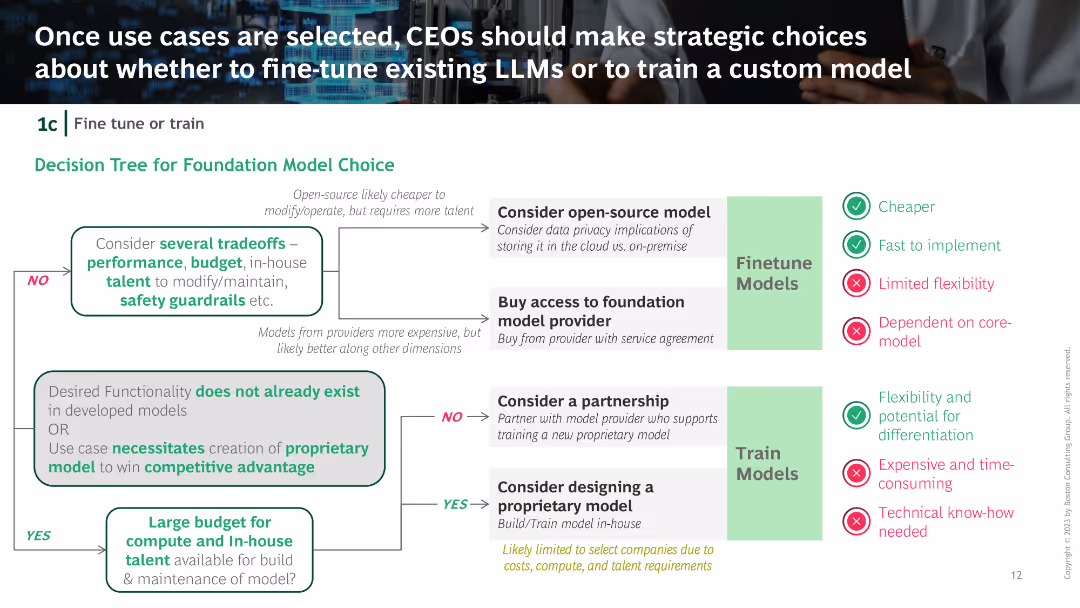
Decision tree outlining choices between open-source models, buying access, partnerships, and proprietary models, with trade-offs for each option.
Strategic Planning
Technology & Software
The slide provides a decision-making framework for selecting foundation models, weighing factors such as performance, budget, talent, and specific business needs.
Foundation model, Decision tree, Open-source, Proprietary model, Strategic choices
false
Strategic Planning
Technology & Software technology-and-software
Diagram
BCG
View slide
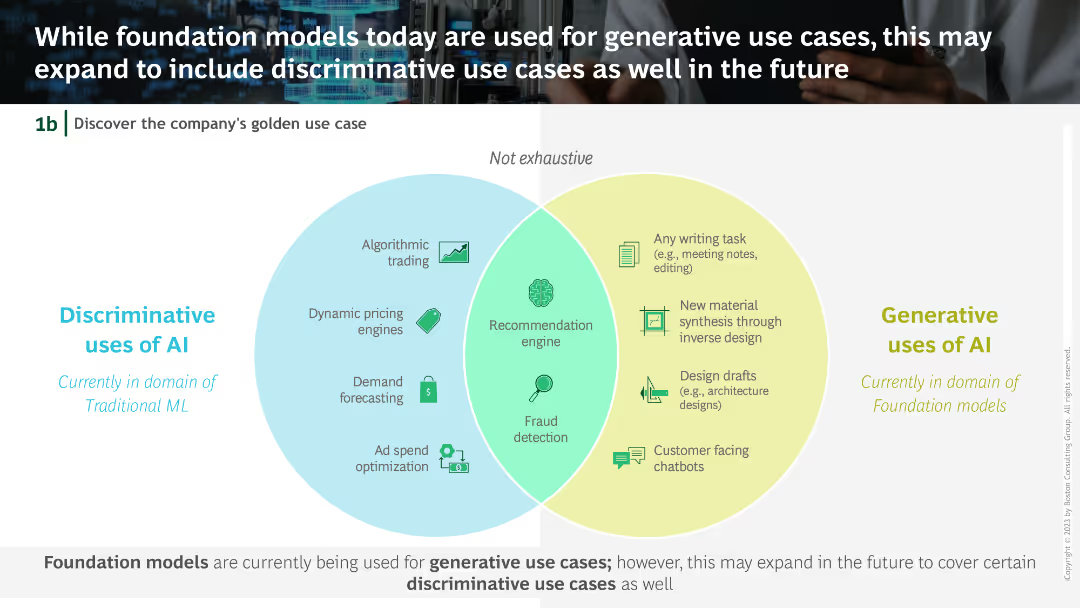
Venn diagram comparing discriminative uses of AI (Algorithmic trading, Dynamic pricing, etc.) with generative uses (Writing tasks, Material synthesis, etc.).
Technology and Digital Transformation
Technology & Software
The slide explores the potential expansion of foundation models from current generative use cases to include discriminative use cases, highlighting areas of overlap and distinction.
Foundation models, Generative AI, Discriminative uses, Venn diagram, AI applications
false
Technology and Digital Transformation
Technology & Software technology-and-software
Diagram
BCG
View slide
A two-dimensional matrix juxtaposing ‘Asset Management’ and ‘Consumer & Wealth Management’ against ‘Global Markets’ and ‘Investment Banking’.
Strategic Planning
Financial Services
Showcases the company's core areas of operation, signifying a stable and robust business structure. Useful for investor presentations or company orientation.
Foundation, Asset Management, Investment Banking, Global Markets, Wealth Management
false
Strategic Planning
Financial Services financial-services
Framework
Goldman Sachs
View slide
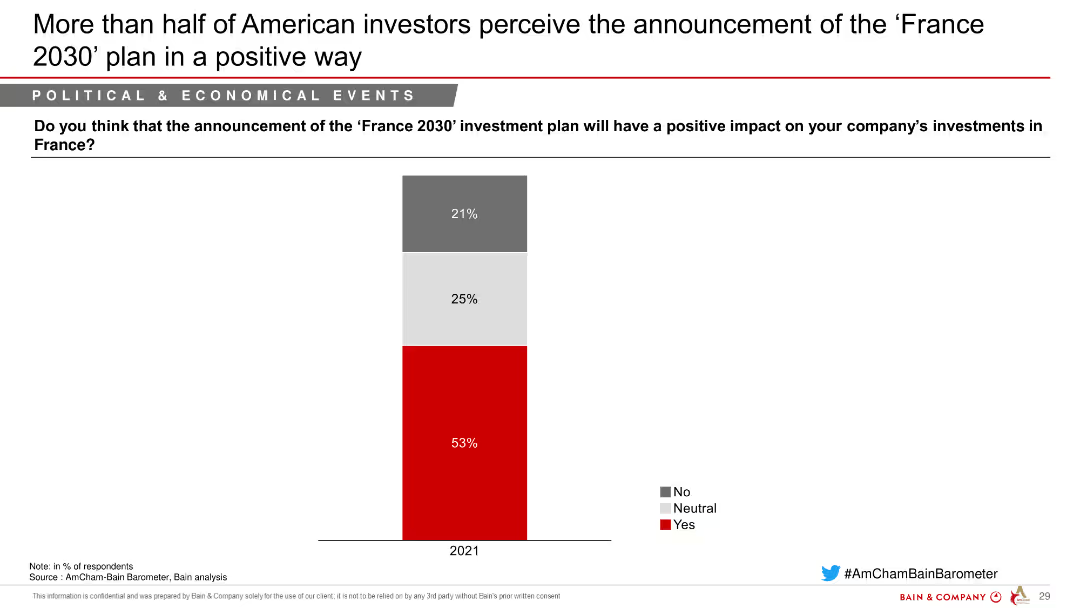
This slide features a column chart illustrating American investors' perceptions of the 'France 2030' investment plan, highlighting the percentage who view it positively, neutrally, or negatively.
Strategic Planning
Government & Public Sector
The slide presents data on American investors' views on the 'France 2030' investment plan, showing the majority see it as having a positive impact on their investments in France.
France 2030, investment plan, American investors, positive impact, strategic planning, government, public sector
false
Strategic Planning
Government & Public Sector government-and-public-sector
Single Chart
Bain
View slide
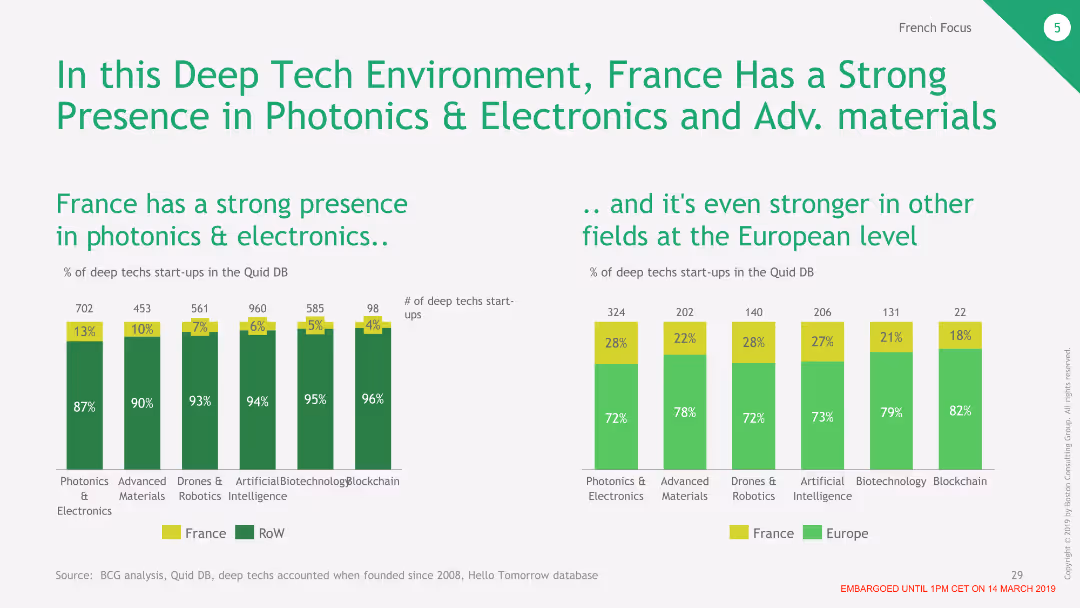
The slide features two column charts. The left chart shows the percentage of deep tech startups in France by category, and the right chart compares the percentage of startups in France versus Europe.
Market Analysis and Trends
Technology & Software
This slide illustrates France's strong presence in photonics and electronics, highlighting its competitive position in various deep tech fields compared to the rest of Europe.
France, Deep Tech, Photonics, Electronics, Comparison
false
Market Analysis and Trends
Technology & Software technology-and-software
Multiple Chart
BCG
Previous
Loading...
Hold On!
We are searching in our database
If nothing, comes up, please try different filters!
Column Chart
Heatmap
Chevron
Org Chart
Infographic
Callouts
Timeline
List
Graphic
Picture
Process Flow
Diagram
Paragraph
Map
Table
Framework
Subtitle
Takeaway Box
Icon
Other Chart
Radar Chart
Waterfall Chart
Mekko Chart
Pie Chart
Scatter Plot
Line Chart
Bar chart
Bullet points
Create a FREE account to continue browsing
Receive Instant Access to 1,000+ slides from companies like McKinsey, Google, and Goldman Sachs
First Name
Last Name
Email
Password
I agree to all
Terms & Privacy Policy
Thank you! Your submission has been received!
Oops! Something went wrong while submitting the form.
Have an account?
Sign in
Upgrade to PRO to Save slides
Advanced Search and Filters
Access to 15,000+ slides
Access to Category Pages
Save/Bookmark Slides
PowerPoint Template Library
Pick a Plan
MONTHLY
$12/month
Billed every month, Cancel anytime.
YEARLY
$9/year
Billed $108 annually, Cancel anytime.
Checkout for $12/month
Checkout for $108/yr
Secured by Stripe | AES-256 bit encryption