My Account
My Slides
Search by Category
Templates
Leave Feedback
Login
Logout
Get Started
Browse all Slides
Browse all Slides
Create a FREE Account
Instant access to 1,000+ real slides from top companies like McKinsey, BCG, Goldman Sachs, Google and many more!
First Name
Last Name
Email
Password
I agree to all
Terms & Privacy Policy
Thank you! Your submission has been received!
Oops! Something went wrong while submitting the form.
Have an account?
Sign in
📢 Ready to start building slides? Check out our new template library
VIEW TEMPLATES
Welcome,
Welcome
PRO
Show Featured Only
Checkbox 8
Companies
Mckinsey
Bain
BCG
EY
Deloitte
Accenture
PwC/Strategy&
JP Morgan
Goldman Sachs
Morgan Stanley
Citigroup
Deutsche Bank
Barclays
LEK
KPMG
Kearney
Oliver Wyman
Booz Allen Hamilton
Gartner
IPSOS
Nielsen
Slide type
Text Only
Linear Flow
Vertical Flow
Single Chart
Header Horizontal
Mixed Chart
Header Vertical
Pillar
Multiple Chart
Graphic
Agenda
Title
Table
Framework
Industry
Technology & Software
Artificial Intelligence
Financial Services
Retail & E-commerce
Consumer Goods
Industrial & Manufacturing
Transportation & Logistics
Telecommunications
Real Estate & Construction
Hospitality & Tourism
Professional Services
Education & Training
Media & Entertainment
Agriculture & Food Production
Healthcare & Pharmaceuticals
Environmental Services & Sustainability
Government & Public Sector
Use Case
Mergers and Acquisitions
Performance Metrics and KPIs
Client Case Studies
Competitive Landscape
Corporate Finance and Valuation
Product and Service Analysis
Customer and Market Segmentation
Organizational Structure and Change
Industry Overview
Regulatory and Compliance
Risk Assessment and Management
Investment Analysis
Organizational Structure and Change
Human Resources and Talent Management
Financial Performance
Market Analysis and Trends
Sales and Business Development
Human Resources and Talent Management
Clear all
Thank you! Your submission has been received!
Oops! Something went wrong while submitting the form.
Tag
View slide
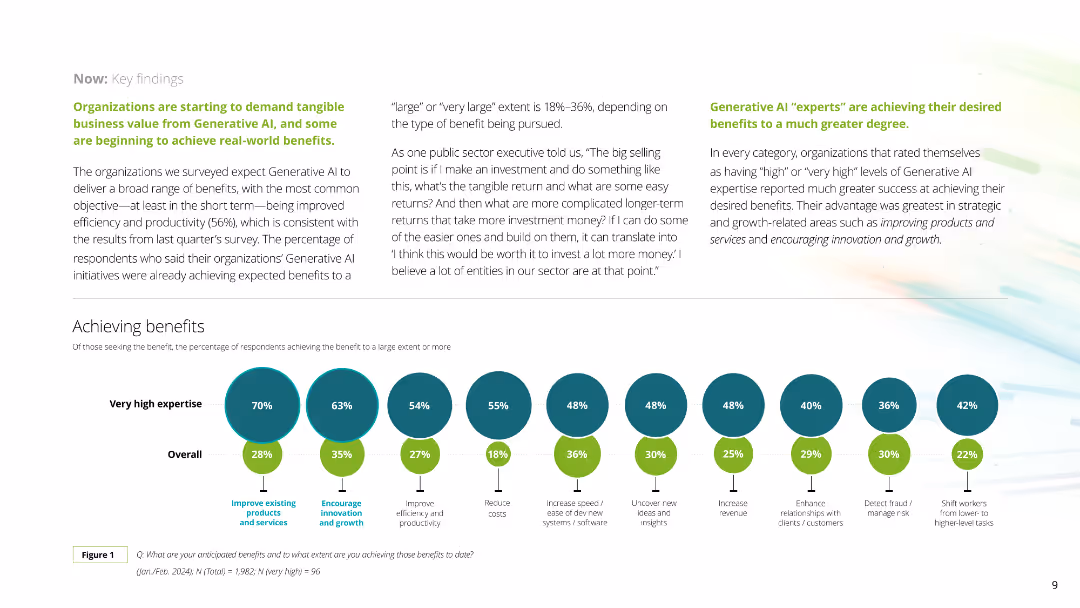
This slide includes a series of circular diagrams showing percentages of benefits achieved by companies with varying levels of expertise in Generative AI. The layout is clean with distinct colors for each expertise level.
Technology and Digital Transformation
Technology & Software
The slide details the benefits companies are achieving from Generative AI, such as improved products and services, innovation, productivity, cost reduction, and new revenue streams, categorized by expertise levels.
Generative AI, benefits, expertise, improvement, productivity
false
Technology and Digital Transformation
Technology & Software technology-and-software
Mixed Chart
Deloitte
View slide
Contains a large pie chart and three smaller ones, showing percentages of people aware of Generative AI, with demographic breakdowns (gender, income, age). Text blocks provide contextual data.
Industry Overview
Technology & Software
This slide presents data on consumer awareness of Generative AI, highlighting demographic disparities in familiarity with such technologies.
Generative AI, consumer awareness, demographic analysis, technology trends, market research
false
Industry Overview
Technology & Software technology-and-software
Multiple Chart
Deloitte
View slide
Includes column charts comparing opinions between those aware of and those who have used Generative AI, focusing on perceptions of accuracy and bias.
Market Analysis and Trends
Technology & Software
Analyzes consumer perceptions of Generative AI's accuracy and bias, revealing a significant divide in understanding its flaws.
Generative AI, consumer perceptions, accuracy, bias, technology understanding
false
Market Analysis and Trends
Technology & Software technology-and-software
Multiple Chart
Deloitte
View slide
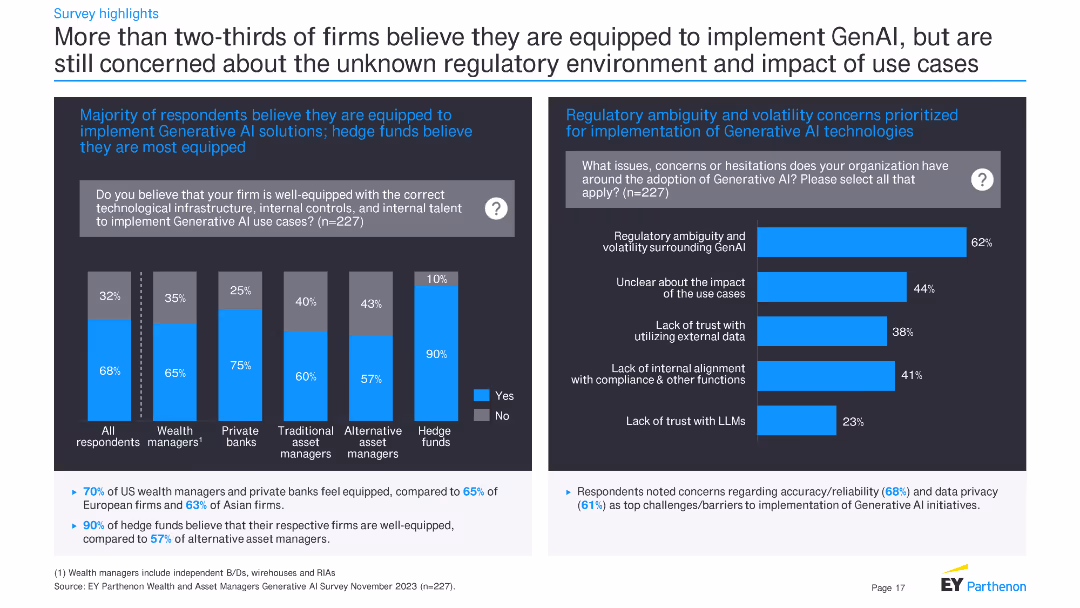
The slide features a column chart on the left and a bar chart on the right. The column chart shows the percentage of firms across different financial sectors that believe they are well-equipped to implement GenAI. The bar chart on the right highlights concerns related to regulatory ambiguity and other issues.
Risk Assessment and Management
Financial Services
The slide indicates that more than two-thirds of firms believe they are equipped to implement Generative AI, with hedge funds being the most confident. It also highlights major concerns like regulatory ambiguity, impact of use cases, and lack of trust with external data.
Generative AI, financial firms, regulatory concerns, implementation, survey results, hedge funds, technological readiness, data trust
false
Risk Assessment and Management
Financial Services financial-services
Multiple Chart
EY
View slide
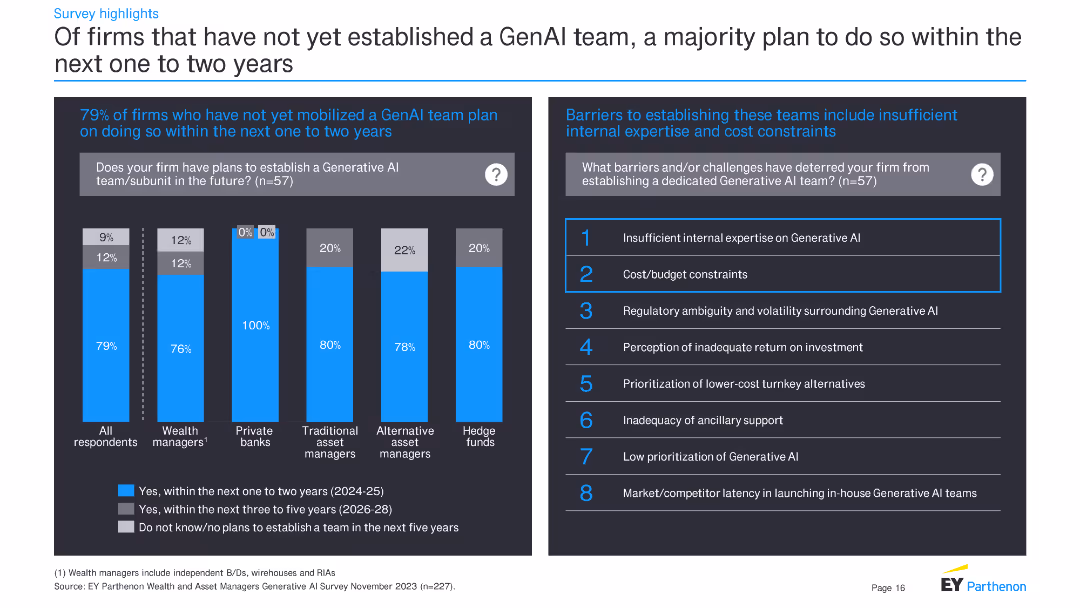
The slide is divided into two parts: a column chart on the left and a list of barriers on the right. The column chart shows responses from different types of financial firms on their plans to establish a GenAI team, with the x-axis representing firm types and the y-axis showing percentage values. The right side lists eight barriers to establishing these teams, formatted in a simple text list.
Strategic Planning
Financial Services
The slide presents survey results showing that 79% of firms plan to establish a GenAI team within the next one to two years. It also lists eight barriers preventing firms from establishing these teams, with insufficient internal expertise and cost constraints being the top reasons.
Generative AI, financial firms, survey results, barriers, expertise, cost constraints, future plans, team establishment
false
Strategic Planning
Financial Services financial-services
Mixed Chart
EY
View slide
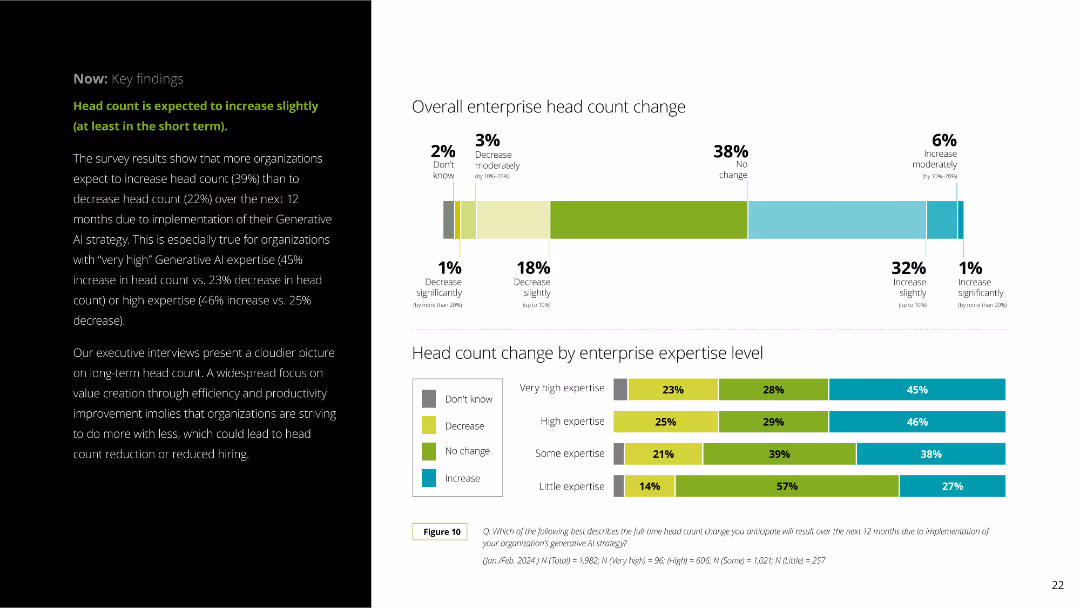
The slide includes a column chart showing enterprise head count changes segmented by expertise levels. The layout is clear with a mix of text and visual elements.
Human Resources and Talent Management
Professional Services
The slide explains anticipated changes in enterprise head count due to Generative AI, with survey results indicating slight increases. It breaks down the data by expertise level and provides detailed percentages.
Generative AI, head count, enterprise, survey results, expertise levels, workforce, HR, professional services, employee changes, AI impact
false
Human Resources and Talent Management
Professional Services professional-services
Multiple Chart
Deloitte
View slide
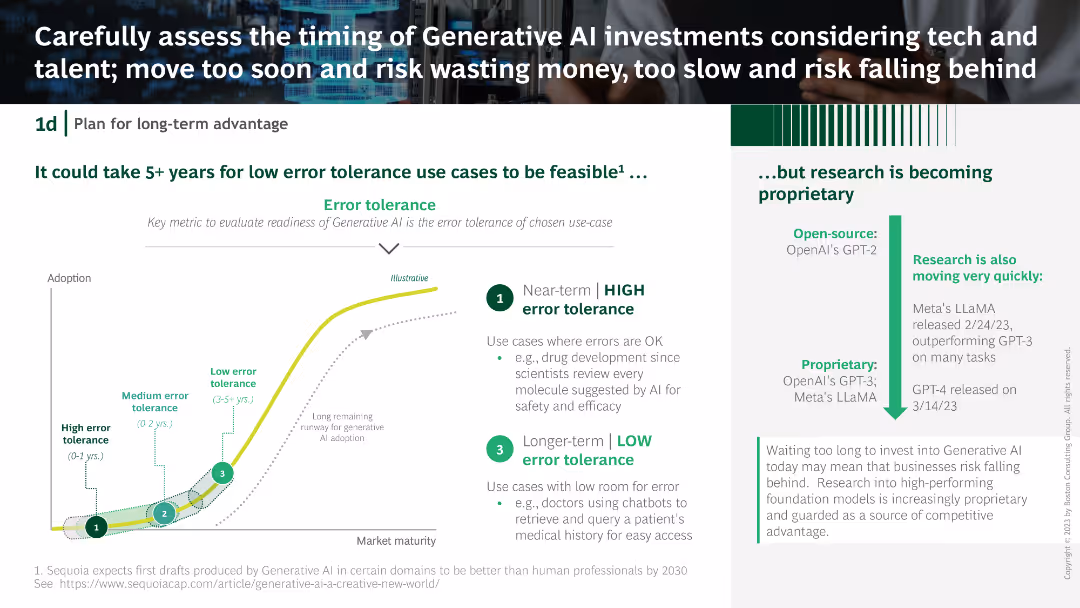
A column chart with error tolerance categories, a textual explanation on the right, and a descriptive flow chart at the bottom depicting AI adoption stages.
Strategic Planning
Technology & Software
The slide explains the error tolerance levels for generative AI use cases, emphasizing the timing for investments. It provides an analysis of short-term and long-term AI adoption strategies.
Generative AI, investment, error tolerance, AI adoption, strategic planning
false
Strategic Planning
Technology & Software technology-and-software
Mixed Chart
BCG
View slide
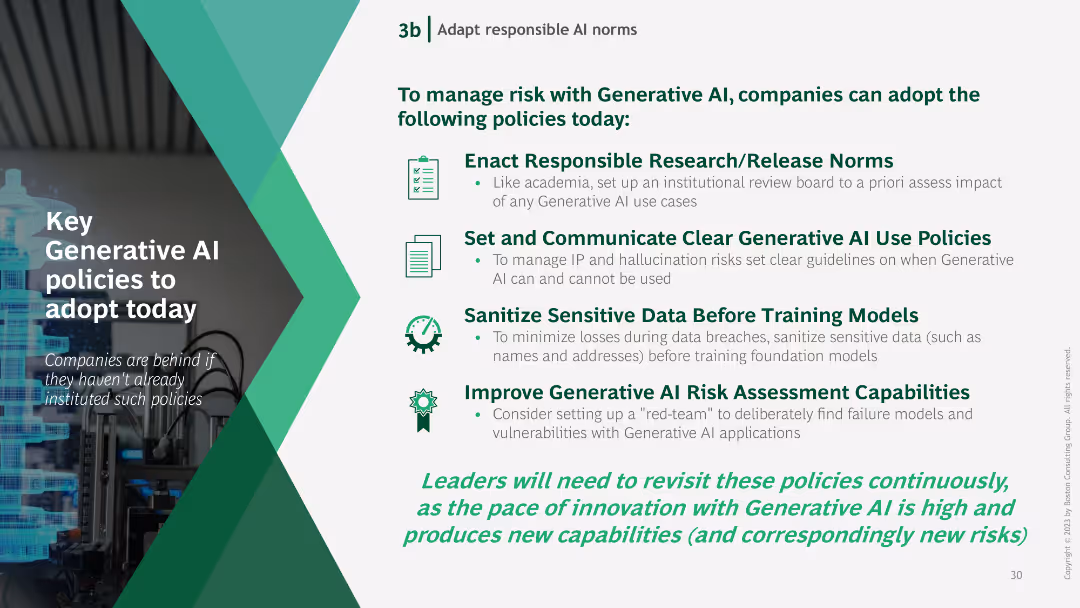
Text-based slide with bullet points outlining key policies for managing Generative AI risks, accompanied by icons representing each policy.
Regulatory and Compliance
Technology & Software
The slide lists essential policies for managing Generative AI risks, including responsible research norms, clear use policies, data sanitization, and risk assessment improvements.
Generative AI, policies, risk management, research norms, data sanitization
false
Regulatory and Compliance
Technology & Software technology-and-software
Vertical Flow
BCG
View slide
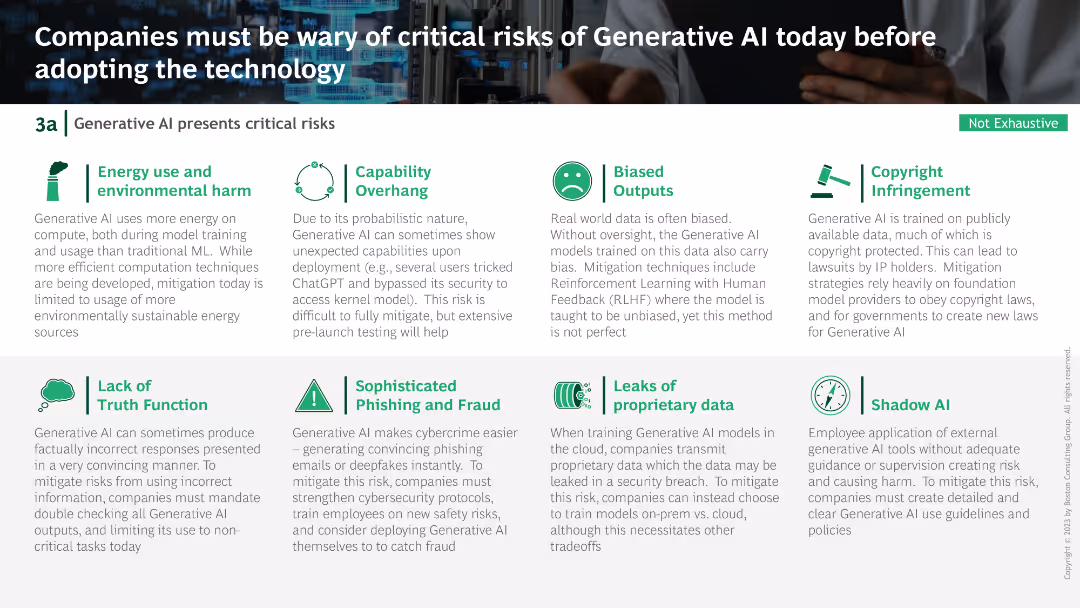
Text-based slide with icons representing various risks associated with Generative AI, such as environmental harm and capability overhang.
Risk Assessment and Management
Technology & Software
The slide discusses several critical risks of adopting Generative AI, including energy use, biased outputs, and copyright infringement, highlighting the need for mitigation.
Generative AI, risks, environmental harm, bias, copyright
false
Risk Assessment and Management
Technology & Software technology-and-software
Header Vertical
BCG
View slide
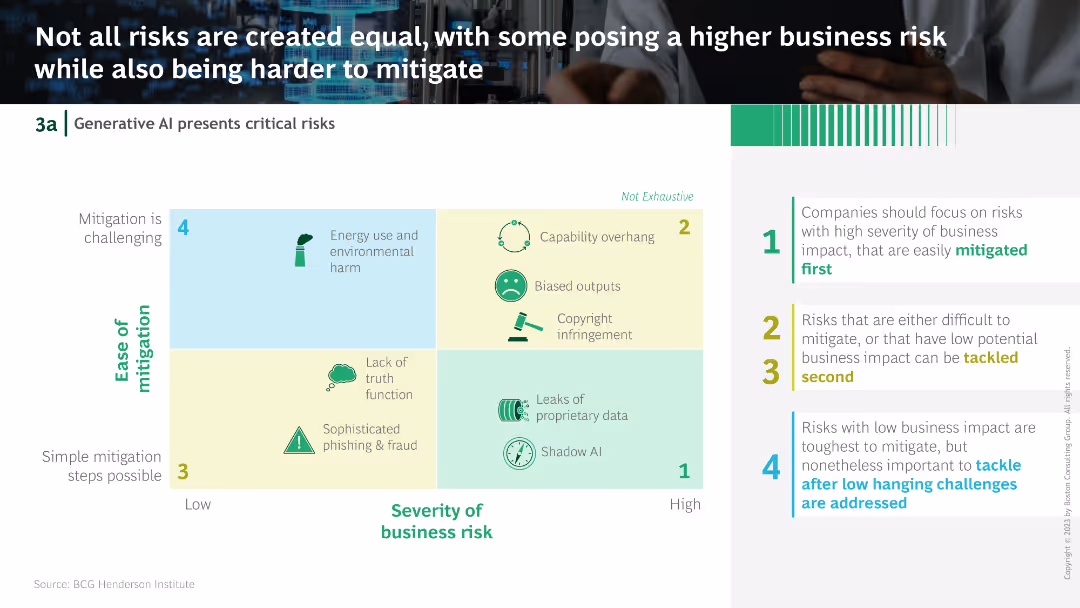
A grid comparing different risks of Generative AI in terms of ease of mitigation and severity of business impact, color-coded for clarity.
Risk Assessment and Management
Technology & Software
This slide categorizes the risks of Generative AI by their ease of mitigation and severity of business impact, suggesting a prioritization strategy for addressing these risks.
Generative AI, risks, mitigation, business impact, strategy
false
Risk Assessment and Management
Technology & Software technology-and-software
Diagram
BCG
View slide
This slide features a column chart illustrating the skills expected to rise in value due to Generative AI adoption. It uses clear color coding to distinguish between human-centered and technology-centered skills.
Human Resources and Talent Management
Professional Services
The slide focuses on the increasing value of certain skills in the AI era, with data analysis, prompt engineering, and creativity among the top skills. It presents survey results with percentages for each skill category.
Generative AI, skills, data analysis, prompt engineering, creativity, technology, human-centered, survey results, workforce, value
false
Human Resources and Talent Management
Professional Services professional-services
Mixed Chart
Deloitte
View slide
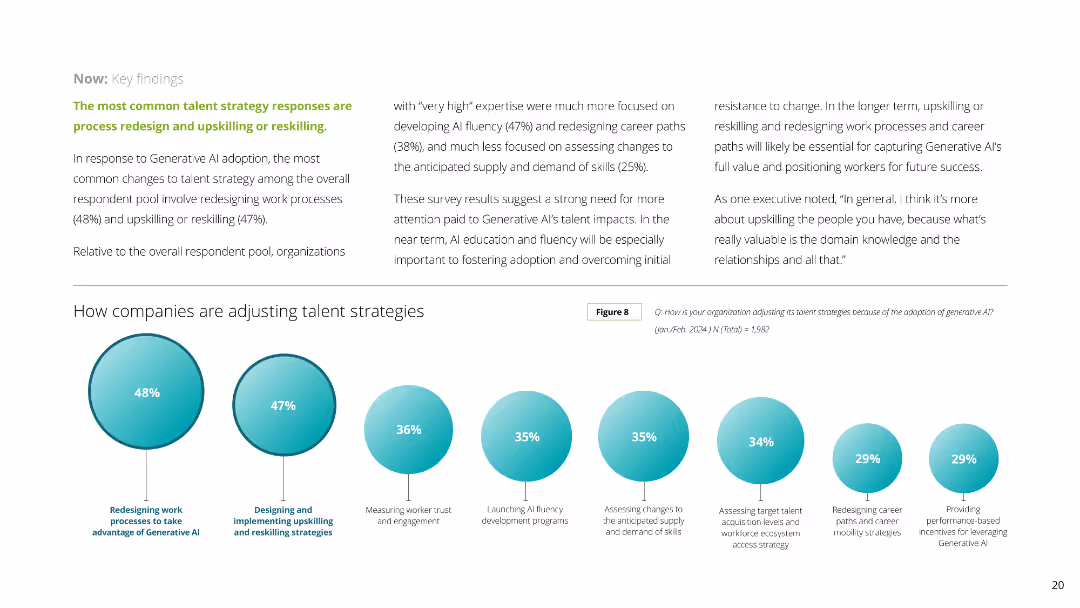
The slide contains a column chart and circular infographics displaying various percentages related to talent strategy responses. The layout is moderately complex with balanced use of visuals and text.
Human Resources and Talent Management
Professional Services
The slide discusses how companies are adjusting their talent strategies in response to Generative AI, highlighting redesigning work processes and upskilling/reskilling. It includes survey results with specific percentages for different strategies.
Generative AI, talent strategy, upskilling, reskilling, survey results, work processes, professional services, HR, workforce, engagement
false
Human Resources and Talent Management
Professional Services professional-services
Mixed Chart
Deloitte
View slide
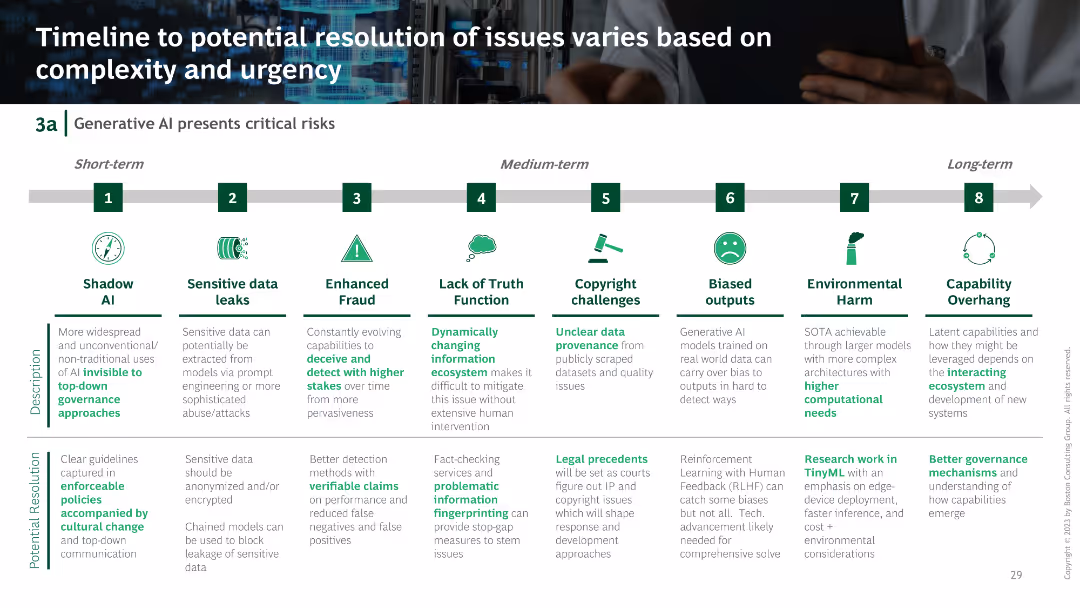
A horizontal timeline showing the short-term, medium-term, and long-term resolution of various Generative AI issues, with icons and text descriptions.
Risk Assessment and Management
Technology & Software
The slide presents a timeline for resolving different Generative AI issues, from shadow AI to capability overhang, detailing potential resolutions for each timeframe.
Generative AI, timeline, resolution, shadow AI, capability
false
Risk Assessment and Management
Technology & Software technology-and-software
Linear Flow
BCG
View slide
Contains a large pie chart detailing the frequency of Generative AI usage among users, accompanied by a bar graph showing specific usage rates from daily to less frequent.
Market Analysis and Trends
Technology & Software
Discusses the infrequent use of Generative AI tools by those who have tried them, pointing to potential usability or interest barriers.
Generative AI, usage frequency, user engagement, technology utilization, survey data
false
Market Analysis and Trends
Technology & Software technology-and-software
Mixed Chart
Deloitte
View slide
Features a large pie chart showing percentages of Generative AI tool usage among the public, with explanatory text providing additional context on usage barriers.
Market Analysis and Trends
Technology & Software
Analyzes the percentage of the population that has used Generative AI tools, emphasizing the low engagement despite high awareness.
Generative AI, usage statistics, technology adoption, market barriers, public engagement
false
Market Analysis and Trends
Technology & Software technology-and-software
Mixed Chart
Deloitte
View slide
Features a pie chart showing the percentage of people using Generative AI for work, with a bar chart for specific purposes like personal, work, and education.
Market Analysis and Trends
Technology & Software
Highlights the adoption of Generative AI tools in professional contexts, estimating the number of users and their application areas.
Generative AI, workplace adoption, professional use, technology impact, user statistics
false
Market Analysis and Trends
Technology & Software technology-and-software
Mixed Chart
Deloitte
View slide
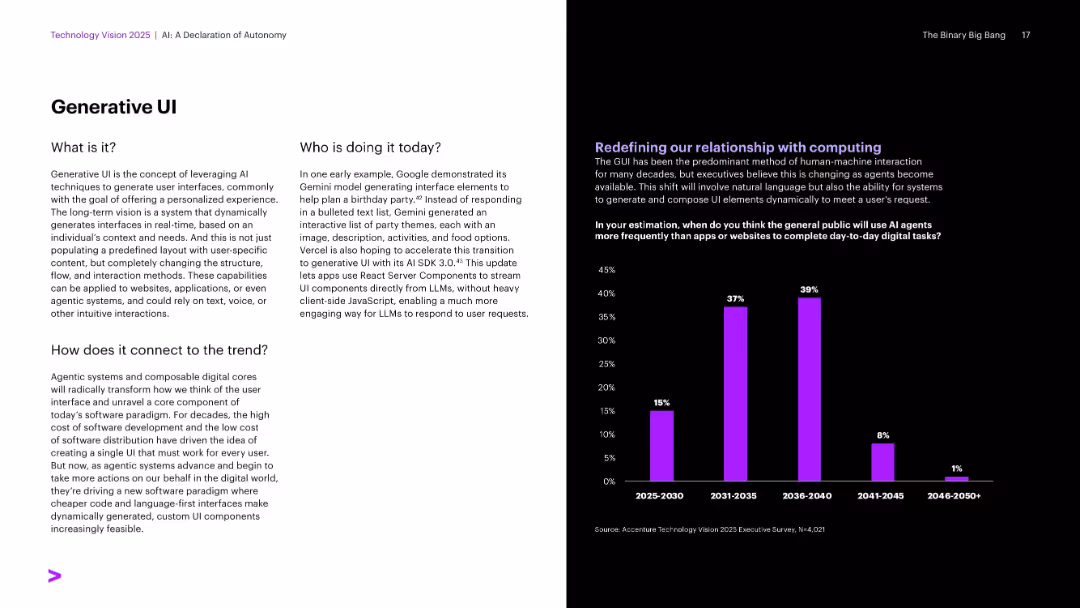
Split layout with concept explanation and examples on left; bar chart on right forecasting public adoption timeline.
Product and Service Analysis
Artificial Intelligence
Discusses generative UIs that dynamically build personalized interfaces in real-time using LLMs. Provides a future outlook on when the general public will predominantly use AI agents over traditional apps.
Generative UI, AI Agents, User Experience, Gemini, React Server, Personalized Interfaces
false
Product and Service Analysis
Artificial Intelligence artificial-intelligence
Multiple Chart
Accenture
View slide
This slide presents a world map illustrating the geographic distribution of respondents from the pulse survey. Green and blue dots of various sizes represent the number of Millennials and Gen Z participants from different regions.
Market Analysis and Trends
Media & Entertainment
The slide shows the geographical distribution of respondents from the pulse survey conducted between April and May 2020. It helps in understanding the global coverage of the survey and the regional variations in responses, providing a basis for analyzing changes in sentiment over time and the impact of the pandemic across different locations.
Geographic Distribution, Pulse Survey, Millennials, Gen Z, Map
false
Market Analysis and Trends
Media & Entertainment media-and-entertainment
Graphic
Deloitte
View slide
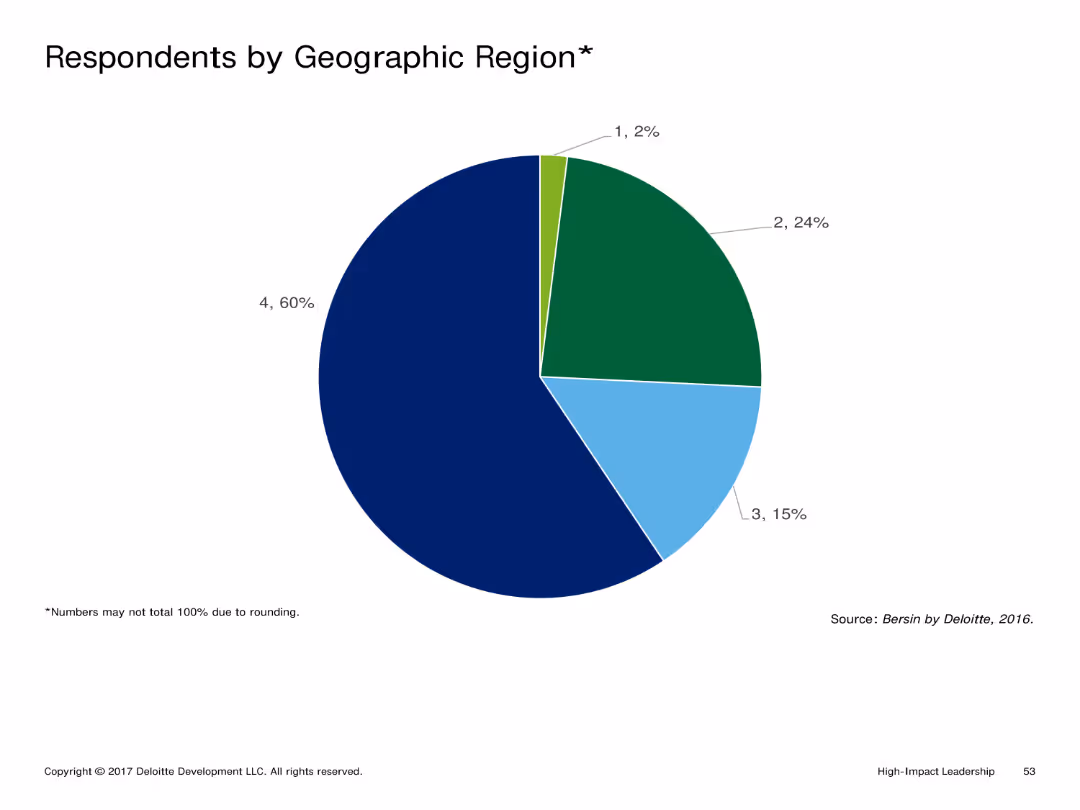
This slide shows a pie chart divided into different segments representing the percentage of respondents by geographic region. Each segment is color-coded and labeled with the corresponding percentage.
Market Analysis and Trends
Professional Services
The slide presents the distribution of survey respondents across different geographic regions. It highlights the proportion of respondents from each region, providing insights into the demographic spread of the survey participants.
Geographic Distribution, Respondents, Survey, Regions, Analysis
false
Market Analysis and Trends
Professional Services professional-services
Single Chart
Deloitte
View slide
This slide features a world map showing the geographic distribution of survey respondents. Different sizes of green and blue dots indicate the number of Millennials and Gen Z participants from various regions.
Market Analysis and Trends
Media & Entertainment
The slide visualizes the geographic distribution of respondents from the primary survey conducted between November 2019 and January 2020. It provides a clear view of the global reach of the survey, highlighting regions with the highest participation, which is useful for understanding the demographic spread and diversity of opinions.
Geographic Distribution, Survey, Millennials, Gen Z, Map
false
Market Analysis and Trends
Media & Entertainment media-and-entertainment
Graphic
Deloitte
View slide
Two pie charts showing geographic distribution of net sales and breakdown by distribution channel for Essity. Each segment is color-coded and labeled with percentages.
Market Analysis and Trends
Consumer Goods
Analyzes geographic sales distribution and distribution channels for Essity, offering insights into market penetration and sales strategy.
Geographic Sales, Distribution Channels, Market Penetration, Sales Strategy
false
Market Analysis and Trends
Consumer Goods consumer-goods
Multiple Chart
Barclays
View slide
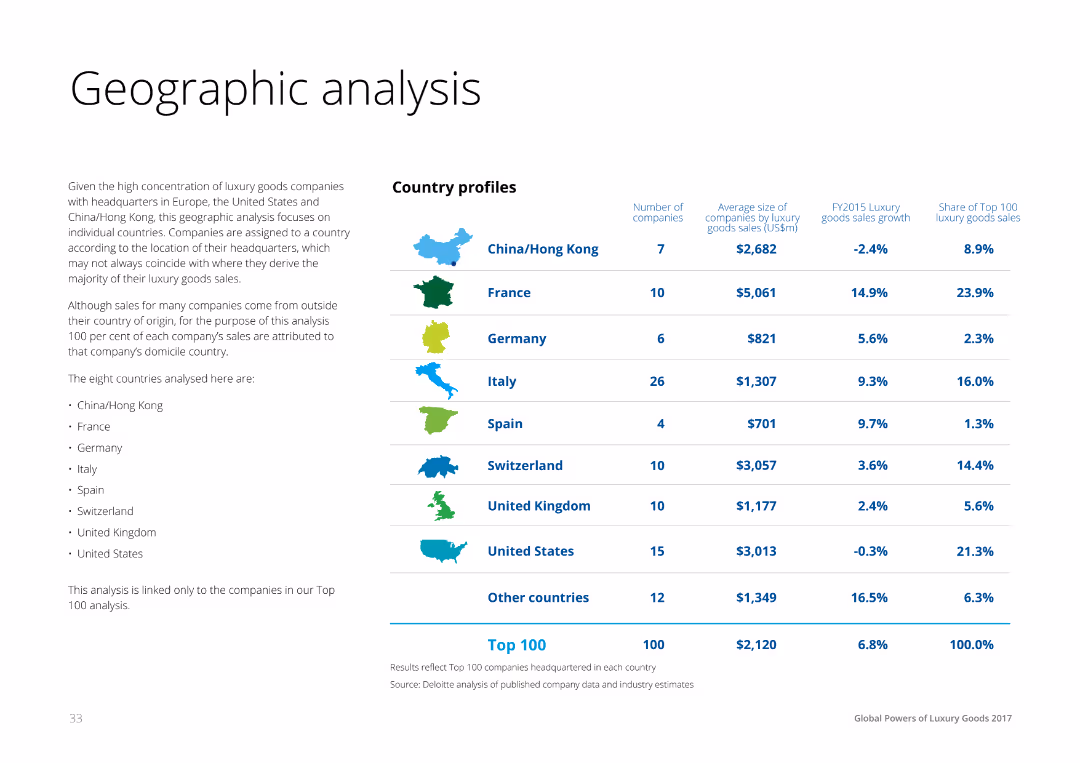
Text on the left with a table on the right showing country profiles for luxury goods markets, including the number of companies, average sales size, growth rates, and share of top 100 sales for countries like China, France, Germany, etc.
Market Analysis and Trends
Consumer Goods
This slide presents a geographic analysis of luxury goods markets, comparing countries by the number of companies, average sales size, growth rates, and market share. It provides insights into regional market dynamics and growth opportunities.
Geographic, Analysis, Luxury, Market, Countries
false
Market Analysis and Trends
Consumer Goods consumer-goods
Table
Deloitte
View slide
Three pie charts showing geographical distribution of accounts, commissions, and client equity for IBKR.
Client Case Studies
Financial Services
Highlights geographical diversity in IBKR’s client base and financials, with pie charts displaying the regional spread of accounts and assets.
Geographical Diversity, Interactive Brokers, Client Accounts, Client Equity, Pie Charts, Americas, Europe, Asia-Pacific
false
Client Case Studies
Financial Services financial-services
Multiple Chart
Goldman Sachs
View slide
The slide displays a geographical map showing various data points with different color codes and markers. It features a dark background with highlighted routes and areas, showing service ticket locations and statuses.
Operational Efficiency
Energy & Utilities
This slide demonstrates an embedded geographical map for monitoring and managing service tickets within the utility sector, providing real-time data on locations and statuses.
Geographical, Map, Service Tickets, Locations, Monitoring
false
Operational Efficiency
Energy & Utilities energy-and-utilities
Graphic
EY
View slide
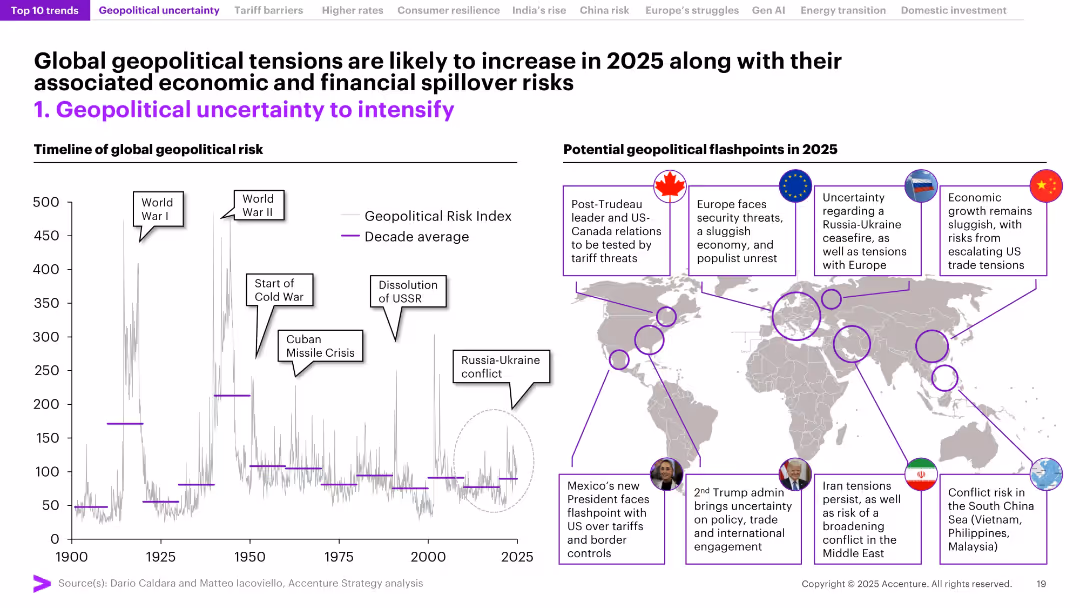
Timeline chart of geopolitical risk index on the left; world map with callouts of flashpoints on the right. High visual density with clearly labeled regions and historical context.
Risk Assessment and Management
Government & Public Sector
The slide explores rising geopolitical risks using a historical risk index graph and annotated world map pinpointing expected flashpoints in 2025 (e.g., US, Europe, China, Middle East). Emphasizes potential economic and political spillover effects from instability.
Geopolitical Risk, Flashpoints, 2025, Conflict Zones, Global Risk, Economic Spillover, War, Trade Tensions, Index
false
Risk Assessment and Management
Government & Public Sector government-and-public-sector
Mixed Chart
Accenture
View slide
Multiple pie charts and tables showing the impacts of various geopolitical risks, comparing overall, G-SIB, and non-G-SIB perspectives.
Risk Assessment and Management
Financial Services
The slide assesses geopolitical risks such as cyberattacks, global trade changes, and sanctions, highlighting their impacts on different types of financial institutions.
Geopolitical Risks, Cyberattacks, Global Trade, Sanctions, Impacts
false
Risk Assessment and Management
Financial Services financial-services
Multiple Chart
EY
View slide
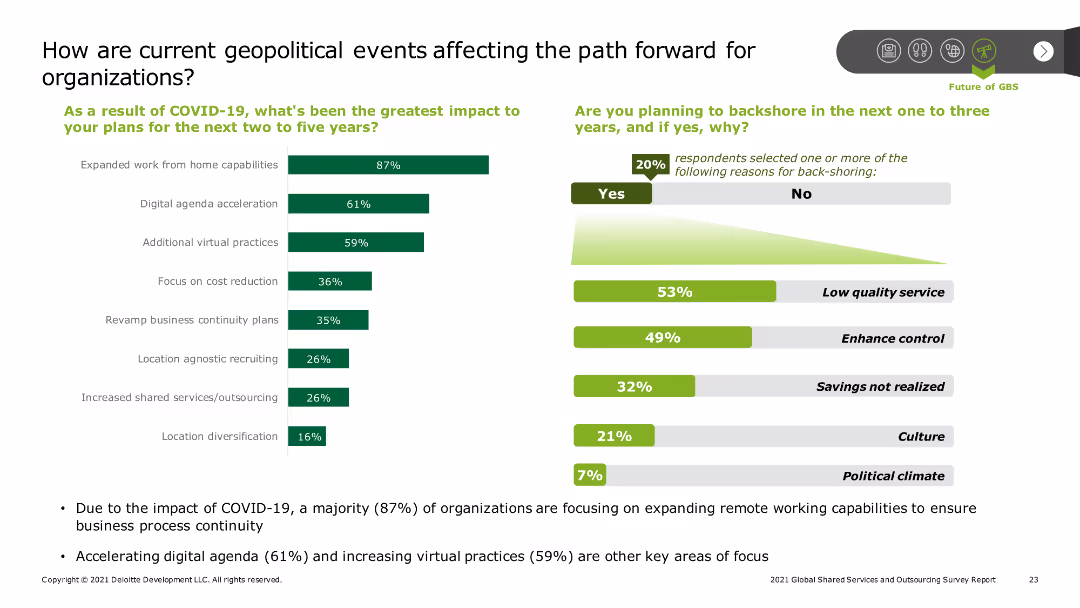
The slide includes a bar chart showing the greatest impacts of COVID-19 on organizational plans, such as expanded remote work and digital acceleration. Additional text covers backshoring plans and reasons, with key statistics highlighted.
Risk Assessment and Management
Professional Services
The slide explores how geopolitical events, particularly COVID-19, have impacted organizational strategies, emphasizing remote work capabilities and digital acceleration, as well as the rationale behind potential backshoring decisions.
Geopolitical impact, COVID-19, remote work, digital acceleration, backshoring
false
Risk Assessment and Management
Professional Services professional-services
Multiple Chart
Deloitte
View slide
Text-dominant slide with a professional layout, utilizing bold headers and bullet points to delineate sections and present complex information in a digestible format.
Technology and Digital Transformation
Energy & Utilities
The slide discusses the uncertainties and potential impacts of the conflict in Ukraine on the global energy transition and decarbonization paths. It outlines various scenarios and raises questions regarding government policies, consumer responses, and the broader implications for GDP and energy supply and demand. This slide aims to provoke thought and discussion on how current geopolitical events may shape the future of energy and environmental policy.
Geopolitical, Energy Transition, Ukraine, Decarbonization
false
Technology and Digital Transformation
Energy & Utilities energy-and-utilities
Header Horizontal
McKinsey
View slide
Features bar charts, pie charts, and maps, providing a complex overview of geopolitical shifts and resource distribution.
Risk Assessment and Management
Financial Services
Discusses the changing geopolitical landscape and its impact on resource allocation, crucial for strategic planning and geopolitical risk assessment.
Geopolitics, Resource Management, Strategic Planning, Global Shifts, Risk Assessment
false
Risk Assessment and Management
Financial Services financial-services
Multiple Chart
PwC/Strategy&
View slide
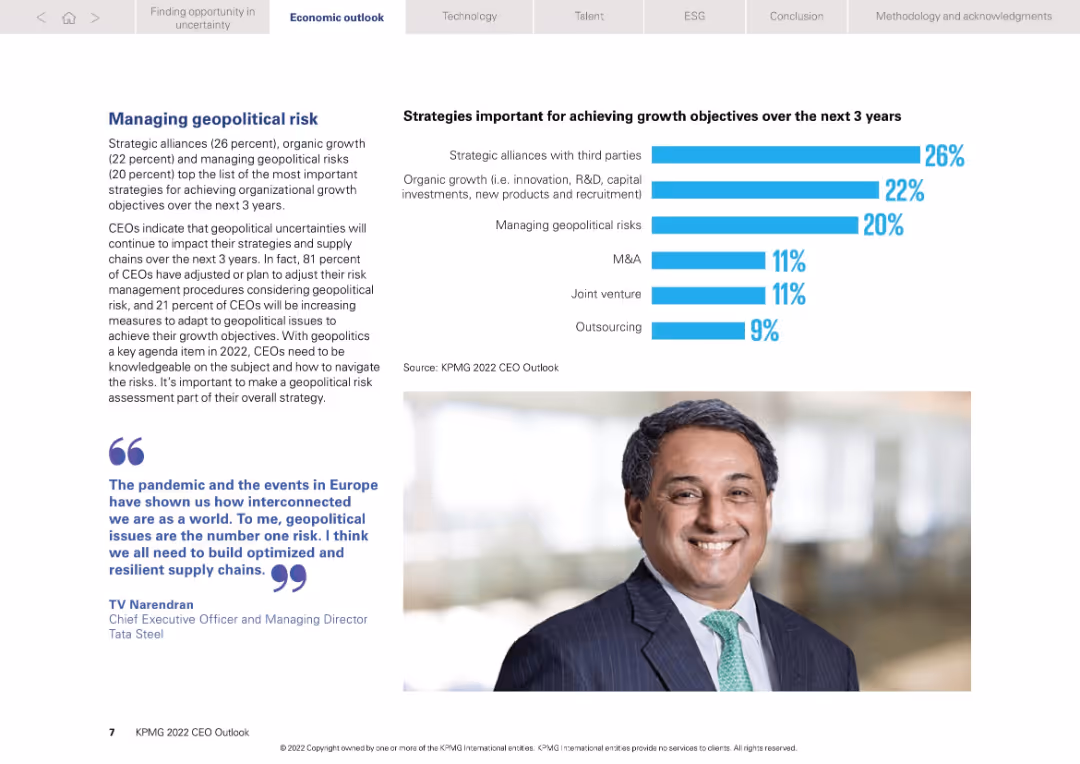
Two-column layout: textual insights on left and bar chart on right showing strategic priorities
Risk Assessment and Management
Professional Services
Focuses on geopolitical risk as a top concern for CEOs. 81% adjusted strategies to mitigate risks. Key growth strategies include alliances, organic growth, and risk management. Quote and image add credibility and personal insight.
Geopolitics, risk strategy, CEO insights, alliances, growth priorities
false
Risk Assessment and Management
Professional Services professional-services
Mixed Chart
KPMG
Previous
Loading...
Hold On!
We are searching in our database
If nothing, comes up, please try different filters!
Column Chart
Heatmap
Chevron
Org Chart
Infographic
Callouts
Timeline
List
Graphic
Picture
Process Flow
Diagram
Paragraph
Map
Table
Framework
Subtitle
Takeaway Box
Icon
Other Chart
Radar Chart
Waterfall Chart
Mekko Chart
Pie Chart
Scatter Plot
Line Chart
Bar chart
Bullet points
Create a FREE account to continue browsing
Receive Instant Access to 1,000+ slides from companies like McKinsey, Google, and Goldman Sachs
First Name
Last Name
Email
Password
I agree to all
Terms & Privacy Policy
Thank you! Your submission has been received!
Oops! Something went wrong while submitting the form.
Have an account?
Sign in
Upgrade to PRO to Save slides
Advanced Search and Filters
Access to 15,000+ slides
Access to Category Pages
Save/Bookmark Slides
PowerPoint Template Library
Pick a Plan
MONTHLY
$12/month
Billed every month, Cancel anytime.
YEARLY
$9/year
Billed $108 annually, Cancel anytime.
Checkout for $12/month
Checkout for $108/yr
Secured by Stripe | AES-256 bit encryption