My Account
My Slides
Search by Category
Templates
View All Templates
Download Template Slides
Leave Feedback
Login
Logout
Get Started
Browse all Slides
Browse all Slides
Create a FREE Account
Instant access to 1,000+ real slides from top companies like McKinsey, BCG, Goldman Sachs, Google and many more!
First Name
Last Name
Email
Password
I agree to all
Terms & Privacy Policy
Thank you! Your submission has been received!
Oops! Something went wrong while submitting the form.
Have an account?
Sign in
Spark Your Next Big Idea with New Presentation Templates
VIEW ALL Templates
Welcome,
Welcome
PRO
Show Featured Only
Checkbox 8
Companies
Mckinsey
Bain
BCG
EY
Deloitte
Accenture
PwC/Strategy&
JP Morgan
Goldman Sachs
Morgan Stanley
Citigroup
Deutsche Bank
Barclays
LEK
KPMG
Kearney
Oliver Wyman
Booz Allen Hamilton
Gartner
IPSOS
Nielsen
Slide type
Text Only
Linear Flow
Vertical Flow
Single Chart
Header Horizontal
Mixed Chart
Header Vertical
Pillar
Multiple Chart
Graphic
Agenda
Title
Table
Framework
Industry
Technology & Software
Artificial Intelligence
Financial Services
Retail & E-commerce
Consumer Goods
Industrial & Manufacturing
Transportation & Logistics
Telecommunications
Real Estate & Construction
Hospitality & Tourism
Professional Services
Education & Training
Media & Entertainment
Agriculture & Food Production
Healthcare & Pharmaceuticals
Environmental Services & Sustainability
Government & Public Sector
Use Case
Mergers and Acquisitions
Performance Metrics and KPIs
Client Case Studies
Competitive Landscape
Corporate Finance and Valuation
Product and Service Analysis
Customer and Market Segmentation
Organizational Structure and Change
Industry Overview
Regulatory and Compliance
Risk Assessment and Management
Investment Analysis
Organizational Structure and Change
Human Resources and Talent Management
Financial Performance
Market Analysis and Trends
Sales and Business Development
Human Resources and Talent Management
Clear all
Thank you! Your submission has been received!
Oops! Something went wrong while submitting the form.
Tag
View slide
Features a split layout with pie charts and text, presenting global opinions on AI within the workplace, highlighting geographic variations in optimism and concern.
Market Analysis and Trends
Technology & Software
Offers a global overview of attitudes towards AI in the workplace, essential for international strategy planning and market entry decisions.
AI attitudes, international strategy, market analysis, geographic variation, workplace impact
false
Market Analysis and Trends
Technology & Software technology-and-software
Multiple Chart
BCG
View slide
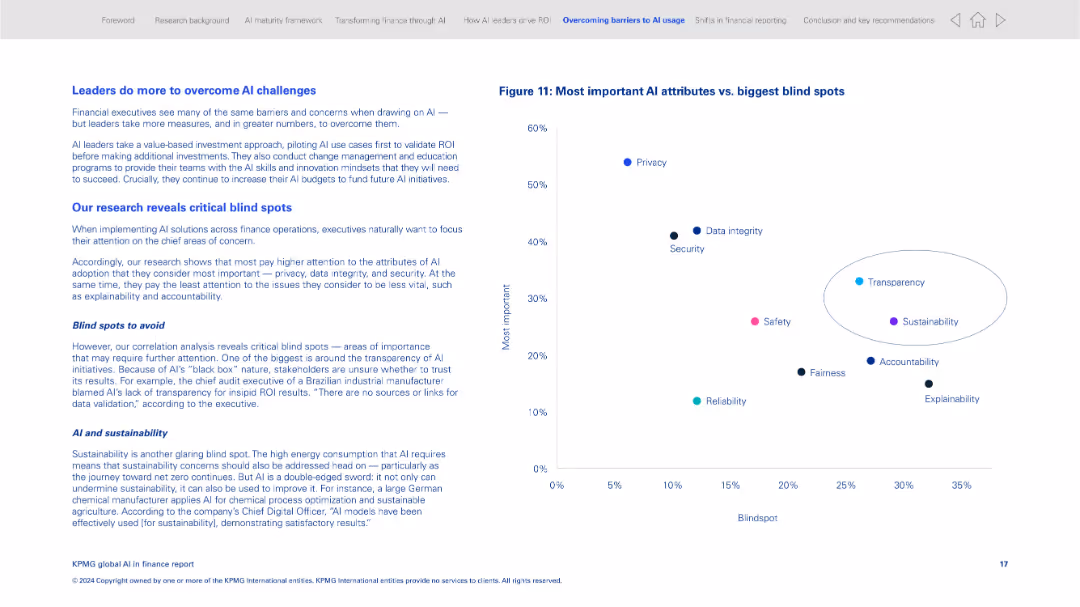
Text on left and a quadrant-style scatter plot on the right; white background with blue and purple accents
Risk Assessment and Management
Financial Services
The slide presents research findings on AI adoption in finance, focusing on which AI attributes executives prioritize (e.g., privacy, security) and which ones they tend to overlook (e.g., transparency, sustainability). The plot visualizes importance versus blind spot percentage.
AI attributes, blind spots, transparency, sustainability, finance risk, executive perception, scatter plot
false
Risk Assessment and Management
Financial Services financial-services
Mixed Chart
KPMG
View slide
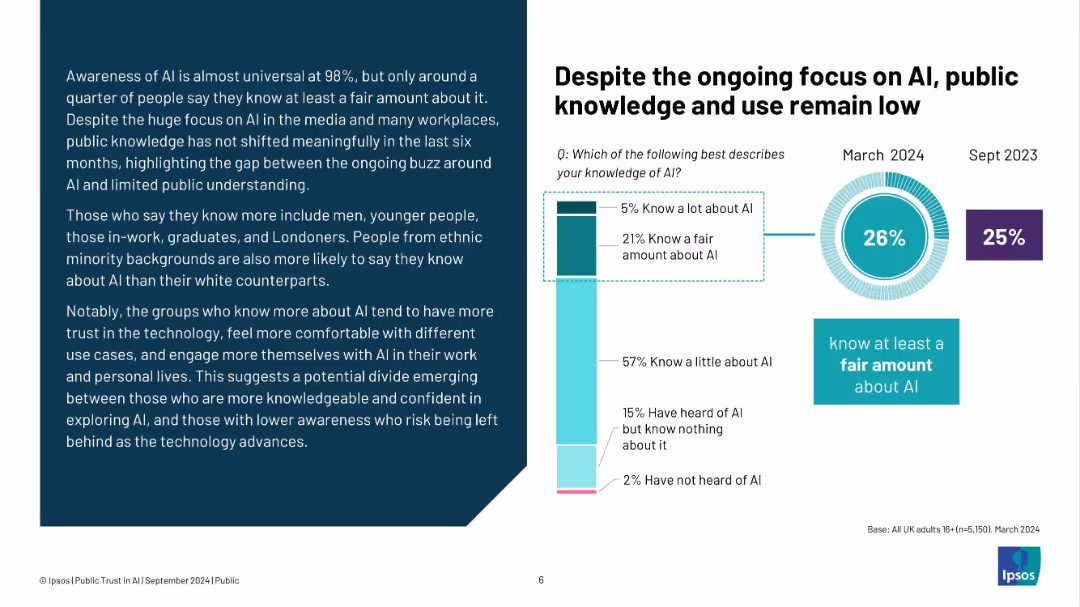
Left: paragraph on AI awareness; right: bar and donut charts on AI knowledge by March 2024 vs Sept 2023
Market Analysis and Trends
Artificial Intelligence
Although awareness of AI is high (98%), only 26% of people know a fair amount or more. The slide highlights demographic disparities in AI knowledge and implies a knowledge divide which affects engagement and trust levels with AI.
AI awareness, public knowledge, demographics, Ipsos, UK, statistics, engagement, trust, education
false
Market Analysis and Trends
Artificial Intelligence artificial-intelligence
Multiple Chart
IPSOS
View slide
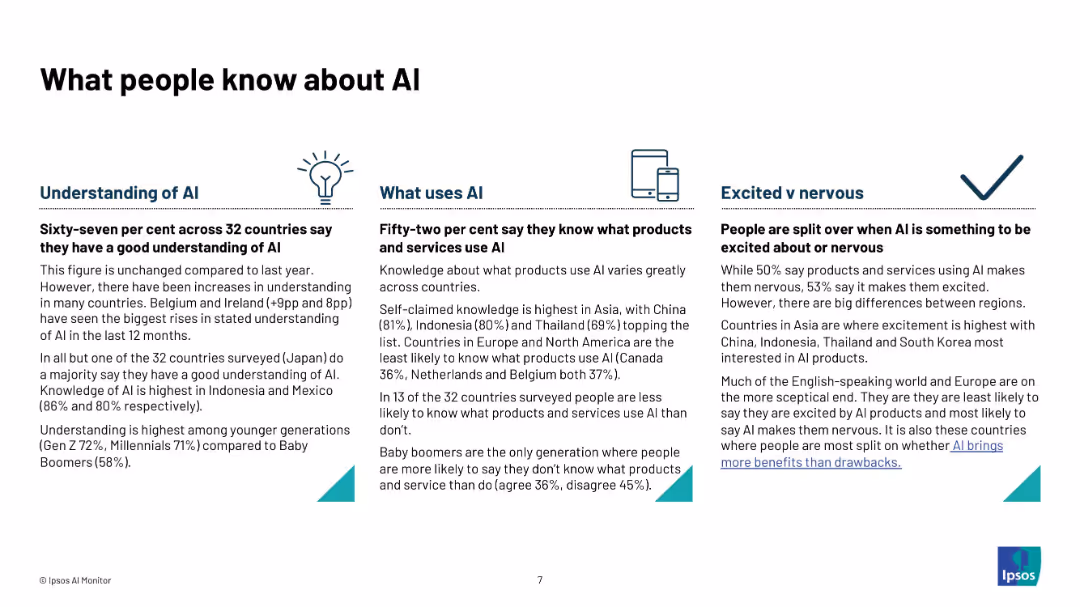
Three-column layout with icons and text under headings: "Understanding of AI", "What Uses AI", and "Excited vs Nervous".
Technology and Digital Transformation
Artificial Intelligence
Describes public knowledge about AI across 32 countries. Details include understanding levels, awareness of AI products, and emotional responses (excited vs nervous). Highlights generational and regional differences in knowledge and comfort levels.
AI awareness, public understanding, product knowledge, excitement, nervousness, generational gap, global survey, Ipsos, infographic
false
Technology and Digital Transformation
Artificial Intelligence artificial-intelligence
Pillar
IPSOS
View slide
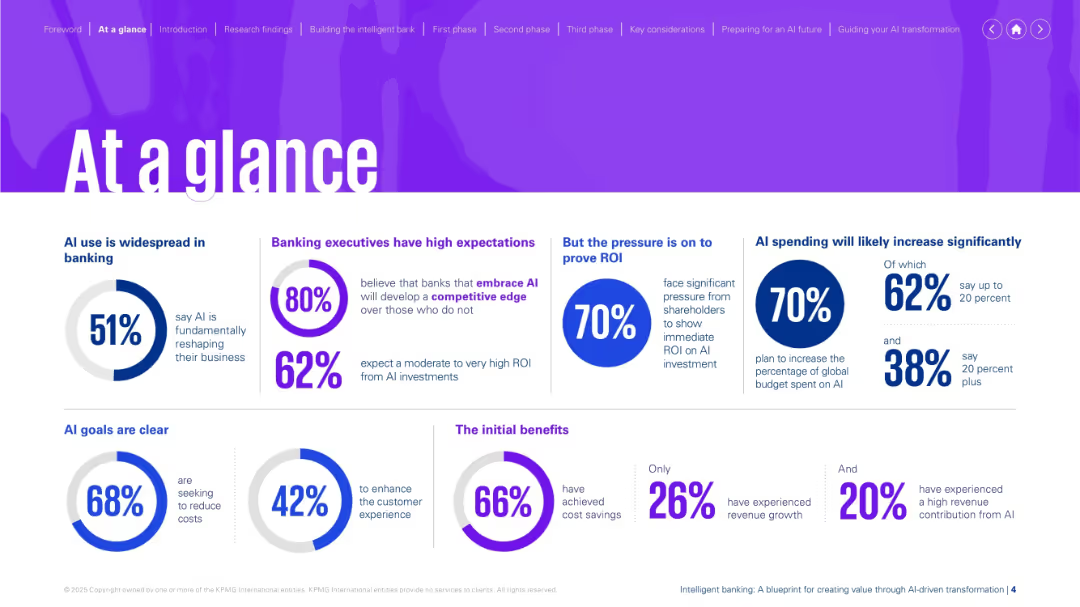
Bright purple theme with multiple infographic elements (pie charts, percent stats, segment boxes).
Strategic Planning
Financial Services
Provides a snapshot of AI's growing role in banking—expectations, spending trends, ROI pressure, and benefits. Highlights that AI is reshaping the sector, with clear goals around cost reduction and customer experience.
AI banking, ROI pressure, spending, cost reduction, customer experience, digital transformation
false
Strategic Planning
Financial Services financial-services
Single Chart
KPMG
View slide
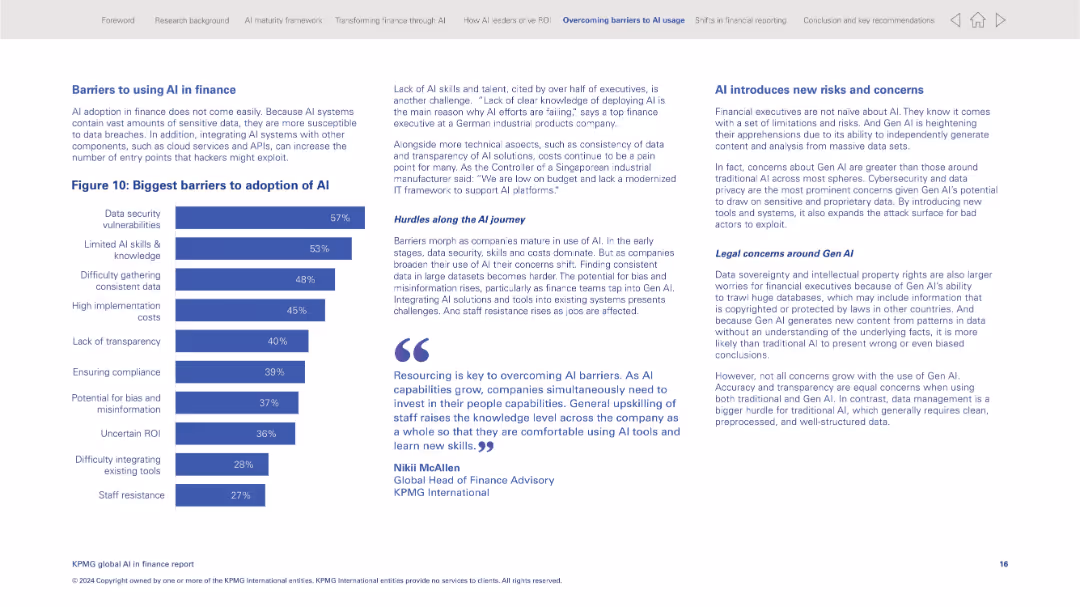
Left-heavy layout with a horizontal bar chart listing top barriers; narrative and quotes on the right
Risk Assessment and Management
Financial Services
This slide outlines the primary challenges to adopting AI in finance, with data security, lack of skills, and data consistency as top concerns. It includes executive commentary and highlights new risks posed by Gen AI, including legal and ethical issues.
AI barriers, data security, Gen AI risks, finance technology, implementation challenges, compliance, staff resistance
false
Risk Assessment and Management
Financial Services financial-services
Mixed Chart
KPMG
View slide
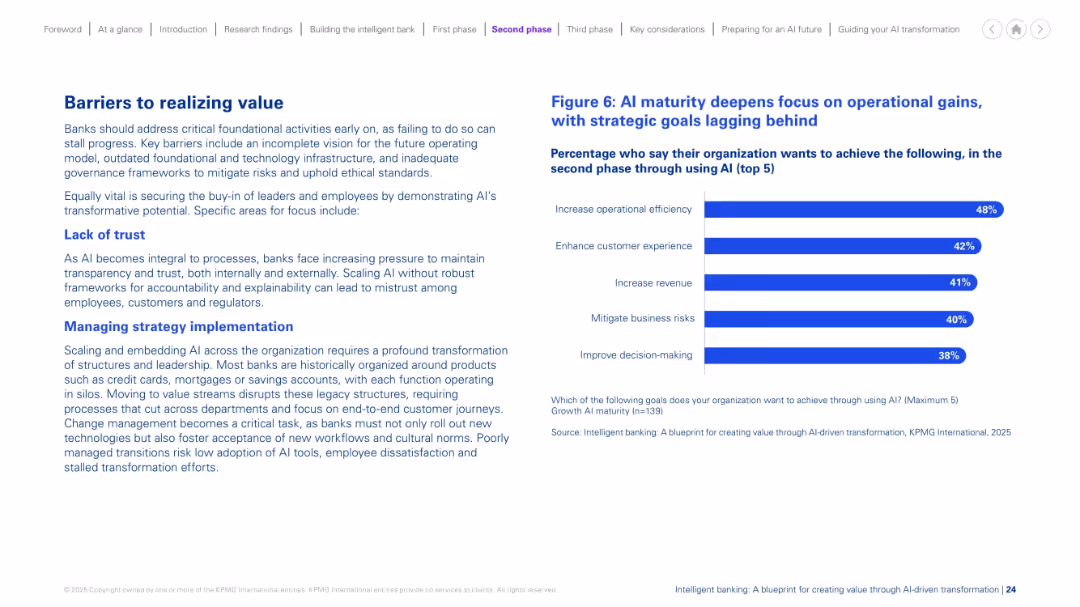
Left-aligned paragraphs describe challenges. Right side has a bar chart listing top AI goals. Balanced layout with headers in blue and clean structure.
Risk Assessment and Management
Financial Services
This slide discusses key obstacles banks face in AI scaling, such as lack of trust and difficulty managing strategic change. It emphasizes transparency, leadership alignment, and breaking down legacy silos. A chart shows the main goals during AI maturity, with a continued focus on efficiency, experience, and revenue.
AI barriers, strategy, trust, legacy systems, maturity, change management
false
Risk Assessment and Management
Financial Services financial-services
Mixed Chart
KPMG
View slide
The slide offers a visual summary of executive opinions on AI and Cloud benefits through infographics and percentage statistics, with a distinct purple and white color scheme for clarity.
Strategic Planning
Technology & Software
The slide outlines the perceived benefits and untapped potential of AI and Cloud investments among High Tech executives. It acknowledges the pivotal role of Cloud during the pandemic and the need for a clearer cloud strategy to fully unlock its potential.
AI benefits, Cloud potential, High Tech, cost efficiencies, revenue growth, IT modernization, improved productivity, strategic challenges, cloud adoption
false
Strategic Planning
Technology & Software technology-and-software
Multiple Chart
Accenture
View slide
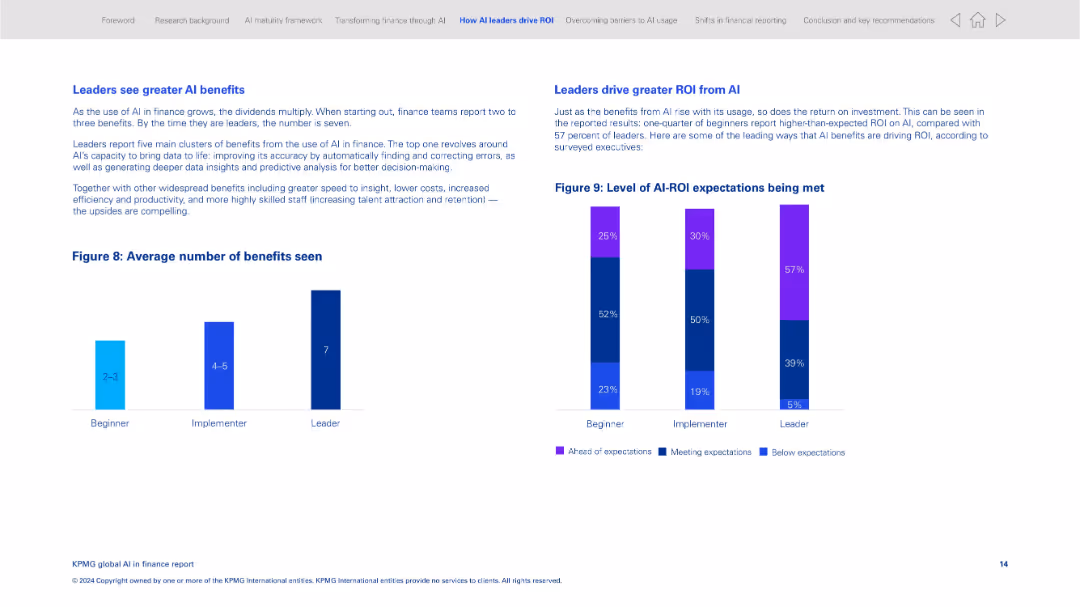
Side-by-side charts and text boxes; minimal layout with bar graph and stacked columns
Performance Metrics and KPIs
Financial Services
The slide compares the average number of benefits seen from AI across beginner, implementer, and leader organizations. It emphasizes how leaders derive greater ROI and more significant benefits from AI implementation, including faster insights and talent retention.
AI benefits, ROI, implementation stages, performance, insights, finance leaders, benchmarking
false
Performance Metrics and KPIs
Financial Services financial-services
Multiple Chart
KPMG
View slide
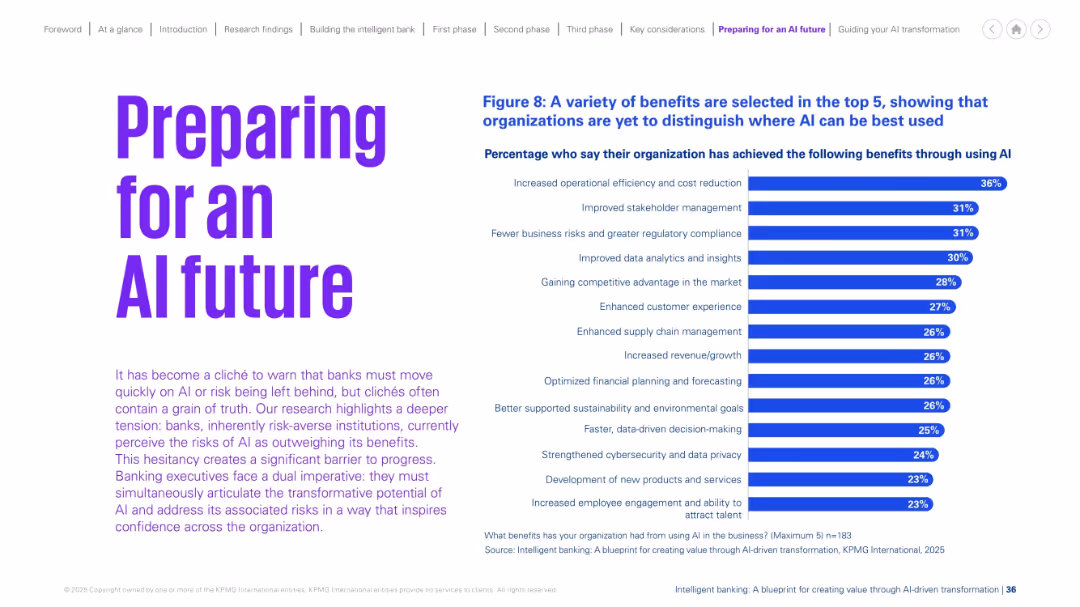
Left-aligned bold heading with a paragraph of explanatory text and a right-aligned bar chart showing benefits of AI.
Technology and Digital Transformation
Financial Services
Highlights benefits achieved through AI such as efficiency, stakeholder management, compliance, and analytics. The data implies organizations are still unclear on where AI yields the greatest value.
AI benefits, operational efficiency, stakeholder management, cost reduction, analytics, transformation, financial planning, sustainability
false
Technology and Digital Transformation
Financial Services financial-services
Mixed Chart
KPMG
View slide
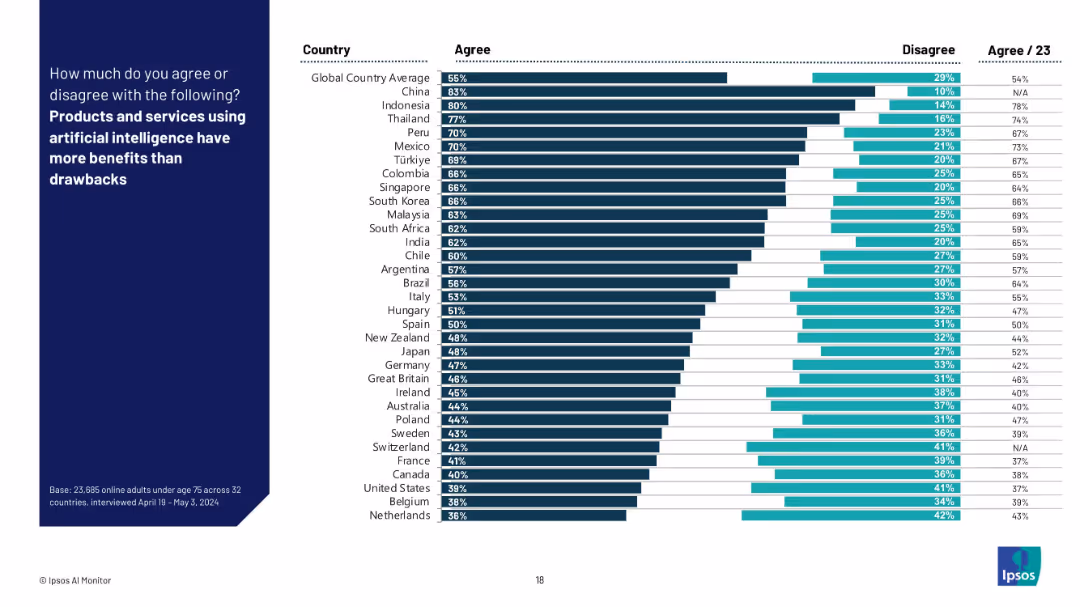
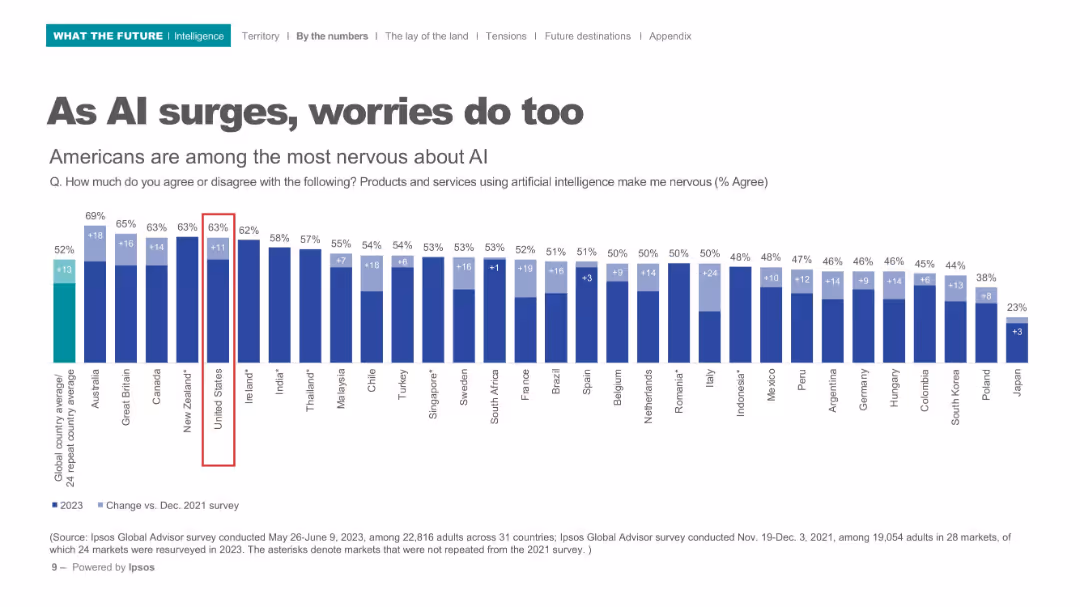
Bar chart format showing % “Agree” and “Disagree” by country with global averages; sorted in descending order of agreement.
Technology and Digital Transformation
Artificial Intelligence
The slide shows the percentage of respondents in each country who believe AI’s benefits outweigh its drawbacks. It reflects overall optimism or skepticism towards AI's societal value and utility.
AI benefits, technology value, opinion survey, Ipsos, optimism, tradeoffs, international data, AI perception, public confidence
false
Technology and Digital Transformation
Artificial Intelligence artificial-intelligence
Mixed Chart
IPSOS
View slide
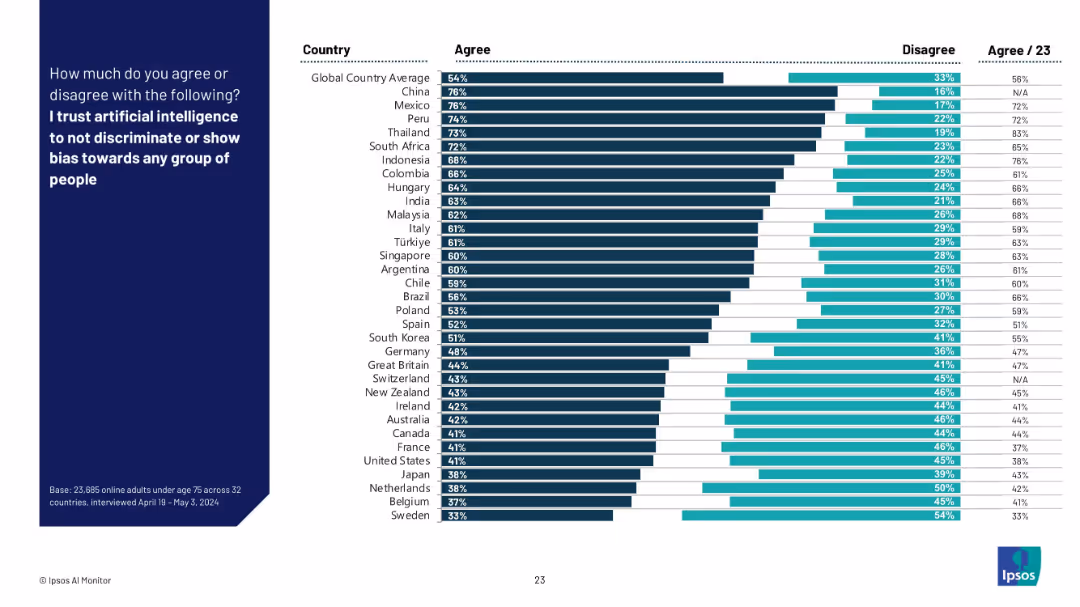
Bar chart by country with % agree and disagree; countries sorted by trust in AI to be unbiased.
Regulatory and Compliance
Artificial Intelligence
This slide presents how much respondents across countries trust AI systems to avoid discrimination or bias. It highlights global perceptions of fairness in AI and potential ethical concerns.
AI bias, fairness, discrimination, trust in AI, ethics, global comparison, Ipsos, regulation, responsible AI
false
Regulatory and Compliance
Artificial Intelligence artificial-intelligence
Mixed Chart
IPSOS
View slide
Contains a list of US proprietary data assets and their uses, paired with textual descriptions of AI advantages in Equifax’s operations, emphasizing the integration of AI technologies and data assets.
Technology and Digital Transformation
Technology & Software
The slide provides an overview of how Equifax leverages its proprietary data alongside advanced AI capabilities to enhance decision-making processes and product development, highlighting the strategic use of technology in business.
AI capabilities, proprietary data, technology, Equifax
false
Technology and Digital Transformation
Technology & Software technology-and-software
Header Horizontal
Barclays
View slide
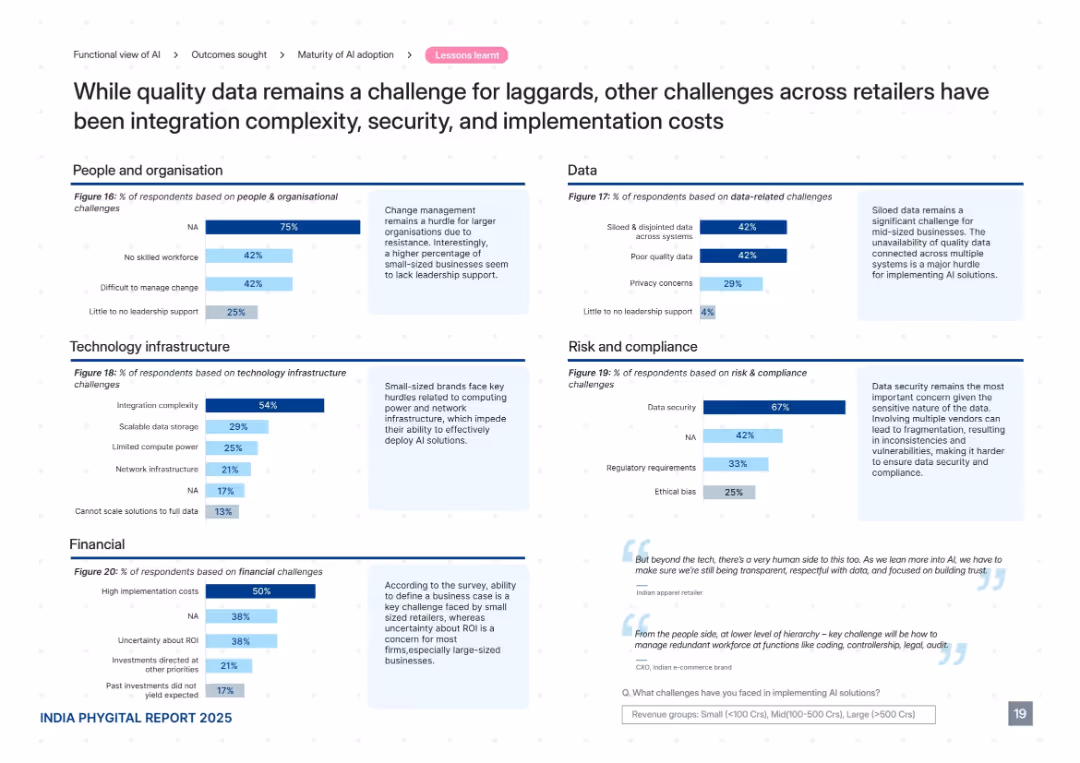
Grid of five charts across categories: People, Tech, Data, Risk, Financial. Each includes horizontal bar graphs with accompanying contextual notes. Soft blue color palette with sectioned layout.
Risk Assessment and Management
Retail & E-commerce
This slide presents challenges to AI adoption among retailers, including data fragmentation, poor quality, integration complexity, high costs, lack of leadership, and ethical concerns. It segments these barriers into five core domains and provides insight into how small and mid-sized businesses especially struggle with foundational AI readiness factors.
AI challenges, data issues, integration, security, cost, leadership, ethics
false
Risk Assessment and Management
Retail & E-commerce retail-and-e-commerce
Mixed Chart
PwC/Strategy&
View slide
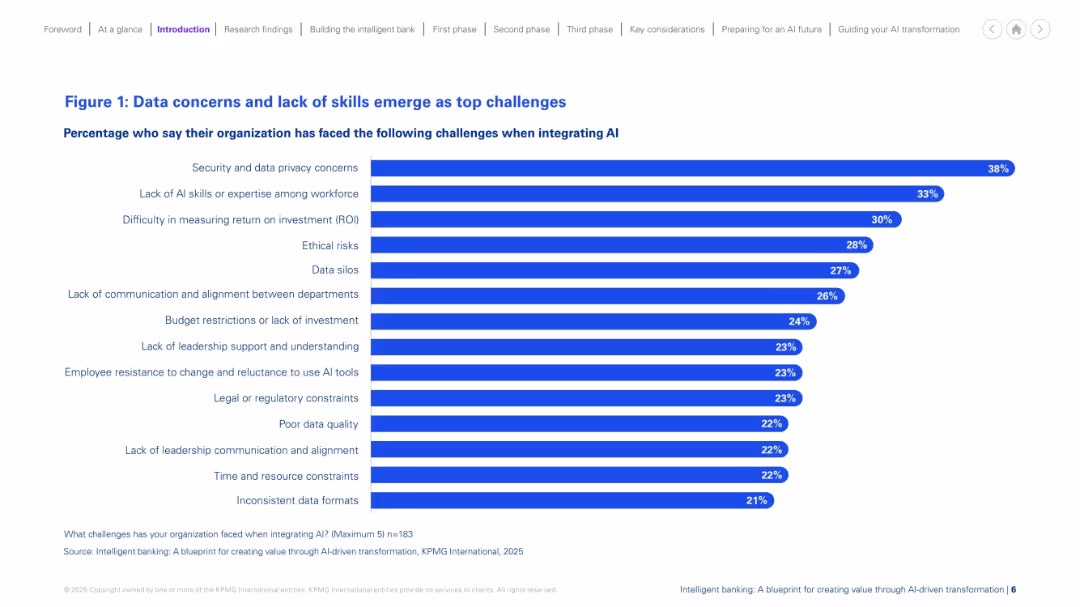
Horizontal bar chart layout on a white background, with bold blue bars and percentage values aligned to the right. Title and subtitle in blue, legend and source at bottom. Clean, structured, minimal visuals.
Risk Assessment and Management
Financial Services
The slide presents the top challenges organizations face when integrating AI. Security and data privacy concerns top the list, followed by lack of AI expertise, and difficulty measuring ROI. Additional barriers include ethical risks, data silos, and lack of leadership support. The data highlights common obstacles that hinder successful AI adoption in financial services.
AI challenges, data privacy, ROI, skills gap, risk, silos, investment, resistance
false
Risk Assessment and Management
Financial Services financial-services
Single Chart
KPMG
View slide
Features multiple bubble charts overlaid on a light blue background. Each bubble represents a different challenge or inefficiency in AI implementation, with varying sizes indicating prevalence. The layout is uncluttered, focusing on the visual data representation.
Technology and Digital Transformation
Technology & Software
This slide highlights the various challenges and inefficiencies faced by organizations in scaling AI initiatives. It is useful for understanding barriers to technology adoption and strategizing on overcoming these challenges.
AI challenges, inefficiencies, technology adoption, scaling AI, barriers, strategic planning, technology implementation
false
Technology and Digital Transformation
Technology & Software technology-and-software
Multiple Chart
Deloitte
View slide
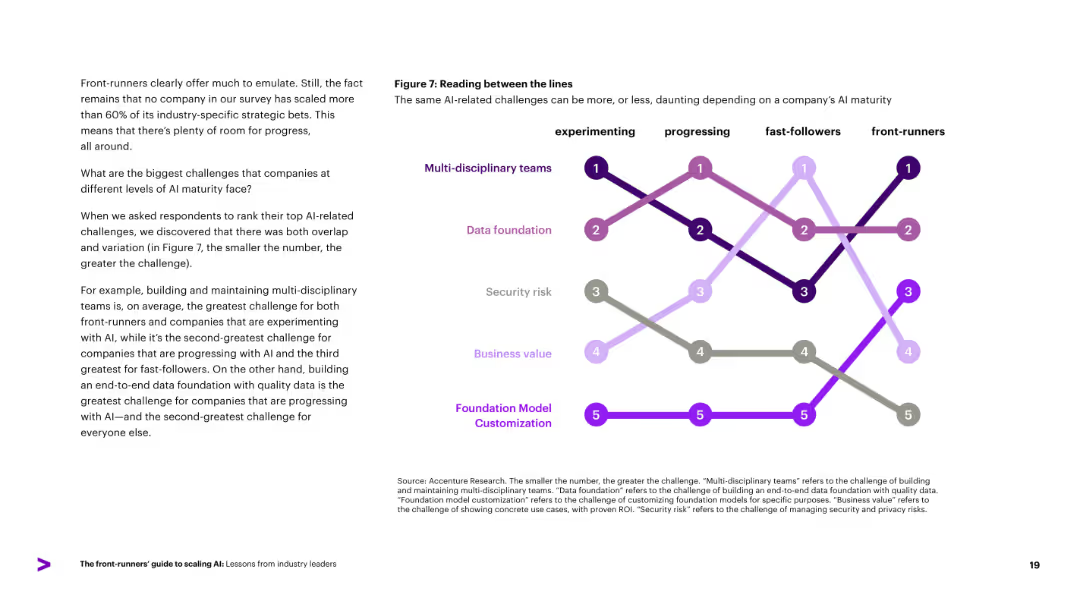
Line chart ranking AI-related challenges (e.g., multi-disciplinary teams, data foundation) across AI maturity levels. Left-aligned explanatory text.
Risk Assessment and Management
Artificial Intelligence
Identifies top AI-related challenges companies face at different maturity levels. Multi-disciplinary teams are the greatest challenge across most groups, followed by data foundation and security risk. Reinforces the idea that challenges evolve as companies mature in AI adoption.
AI challenges, maturity, data foundation, security, cross-functional
false
Risk Assessment and Management
Artificial Intelligence artificial-intelligence
Diagram
Accenture
View slide
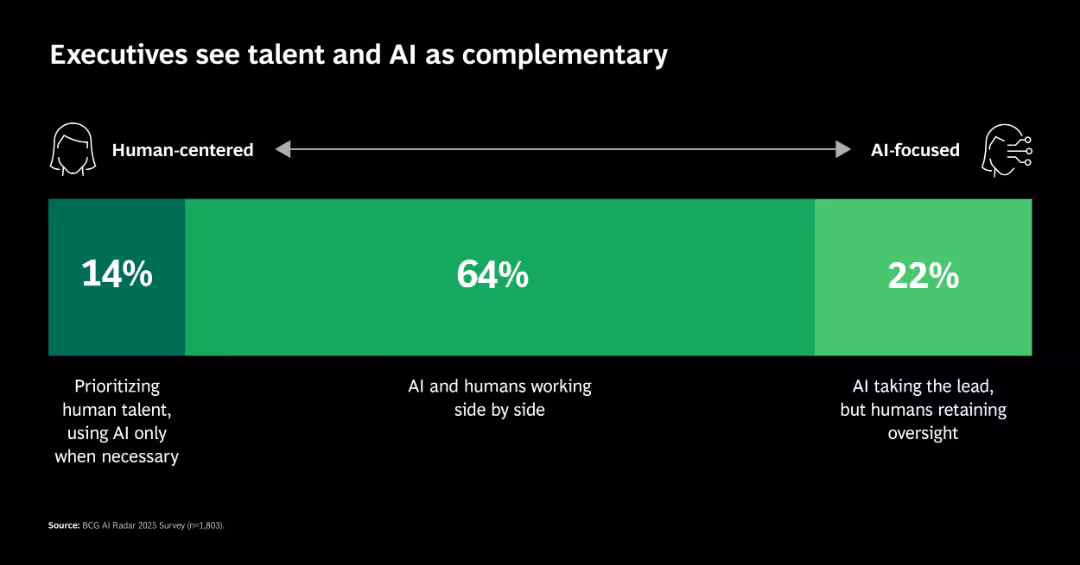
Single segmented horizontal bar showing distribution across a continuum: human-centered, hybrid, and AI-focused approaches.
Human Resources and Talent Management
Artificial Intelligence
Shows that 64% of executives prefer AI-human collaboration, with fewer choosing either extreme (AI-led or human-led). This reflects a trend toward integration rather than substitution.
AI collaboration, workforce, leadership, hybrid roles, talent strategy
false
Human Resources and Talent Management
Artificial Intelligence artificial-intelligence
Single Chart
BCG
View slide
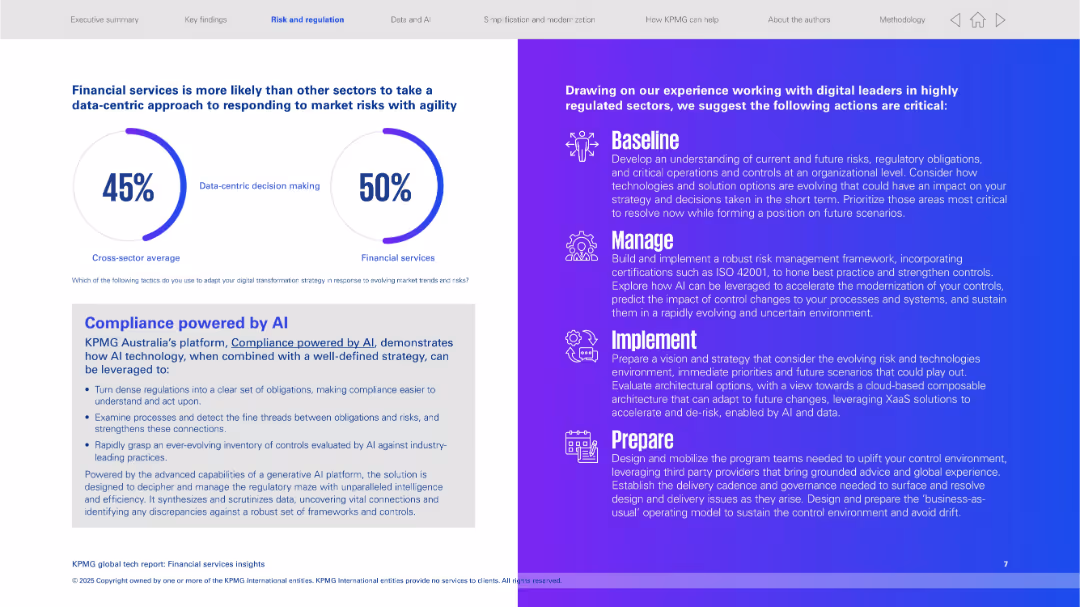
Split layout: left side uses pie-style progress indicators and a text box; right side uses a gradient purple background with white icons and bold headings for 4 steps (Baseline, Manage, Implement, Prepare).
Risk Assessment and Management
Financial Services
The slide highlights the financial services sector's tendency toward data-centric risk responses. It introduces KPMG Australia's AI compliance platform and outlines key strategies for regulated sectors to manage digital transformation, with a strong focus on AI-driven regulatory response and risk framework evolution.
AI compliance, risk management, data-centric, KPMG, regulated sectors, baseline, manage, implement, prepare
false
Risk Assessment and Management
Financial Services financial-services
Mixed Chart
KPMG
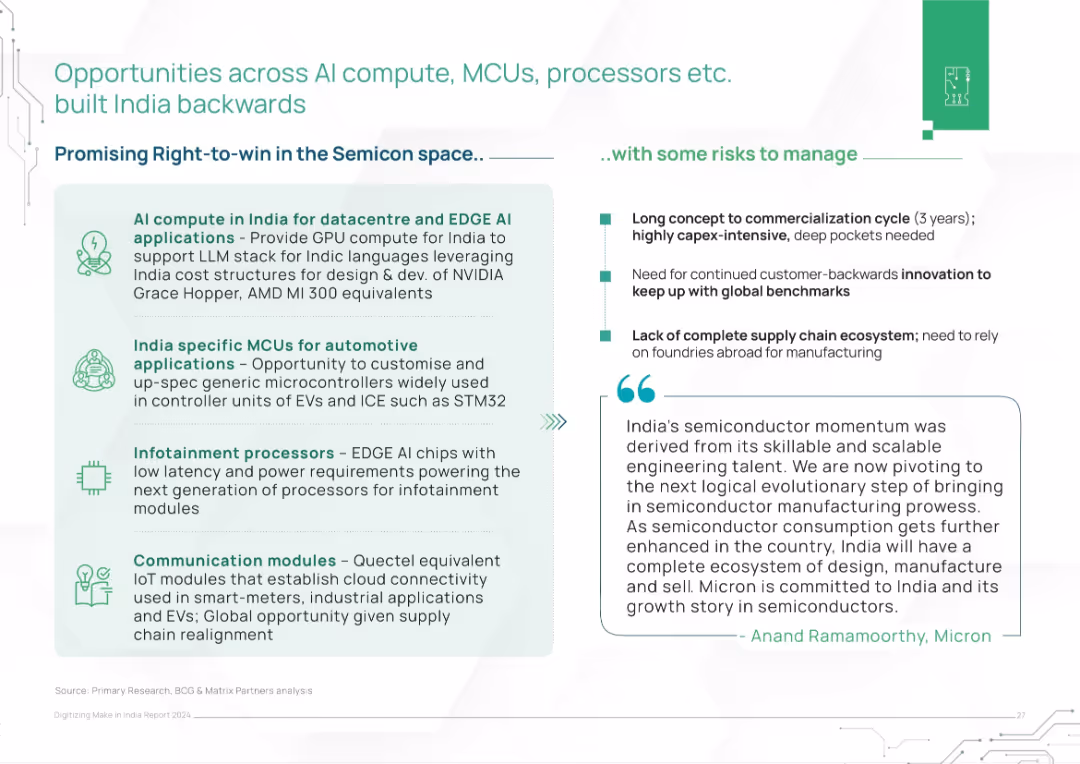
View slide
Two-column layout with opportunity areas (left) and risks (right). Includes a quote from Micron executive at the bottom.
Strategic Planning
Artificial Intelligence
The slide identifies semiconductor opportunities in AI compute, automotive MCUs, infotainment processors, and IoT modules. It balances this with risks like long commercialization cycles and supply chain gaps, stressing India's strategic positioning.
AI compute, MCUs, processors, semiconductors, India, risks, IoT, data centers, automotive, supply chain
false
Strategic Planning
Artificial Intelligence artificial-intelligence
Header Horizontal
BCG
View slide
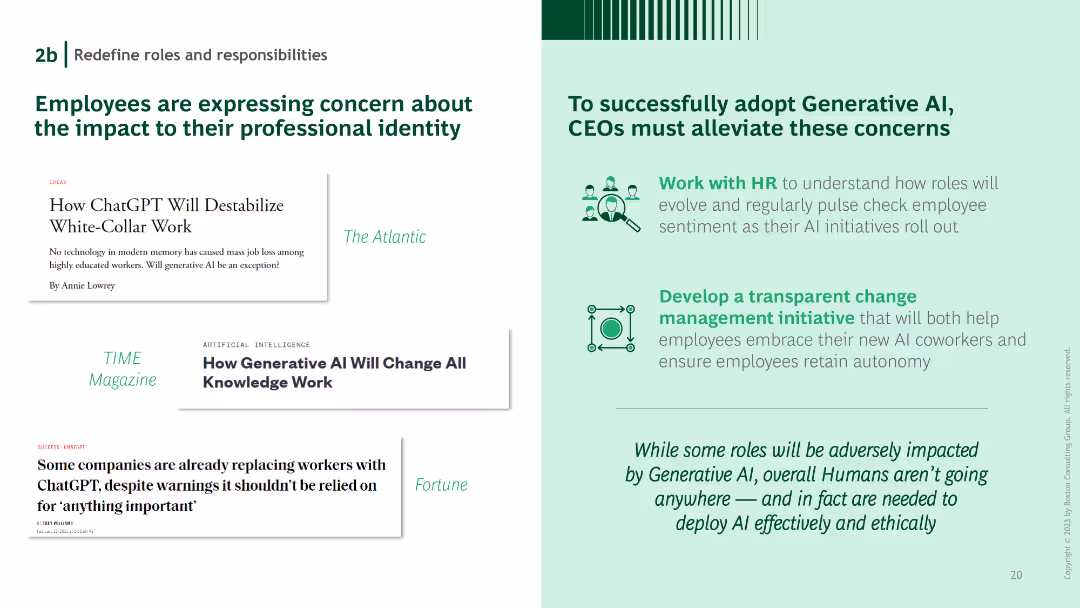
Headlines from major publications on the left, a list of CEO action items on the right. Green text and icons emphasize the points made.
Organizational Structure and Change
Technology & Software
Highlights concerns employees have about AI's impact on professional identity and suggests actions CEOs can take to address these concerns.
AI concerns, professional identity, CEO actions, employee sentiment, organizational change
false
Organizational Structure and Change
Technology & Software technology-and-software
Boxed
BCG
View slide
Horizontal bar chart with comparison of global nervousness about AI products/services; dark blue bars on white background.
Risk Assessment and Management
Artificial Intelligence
Depicts nervousness levels around AI across 31 countries, highlighting the U.S. as one of the most apprehensive. Bar chart includes percentage increase from 2021 to 2023.
AI concerns, public perception, international comparison, nervousness, Ipsos, technology anxiety, 2023 survey
false
Risk Assessment and Management
Artificial Intelligence artificial-intelligence
Single Chart
IPSOS
View slide
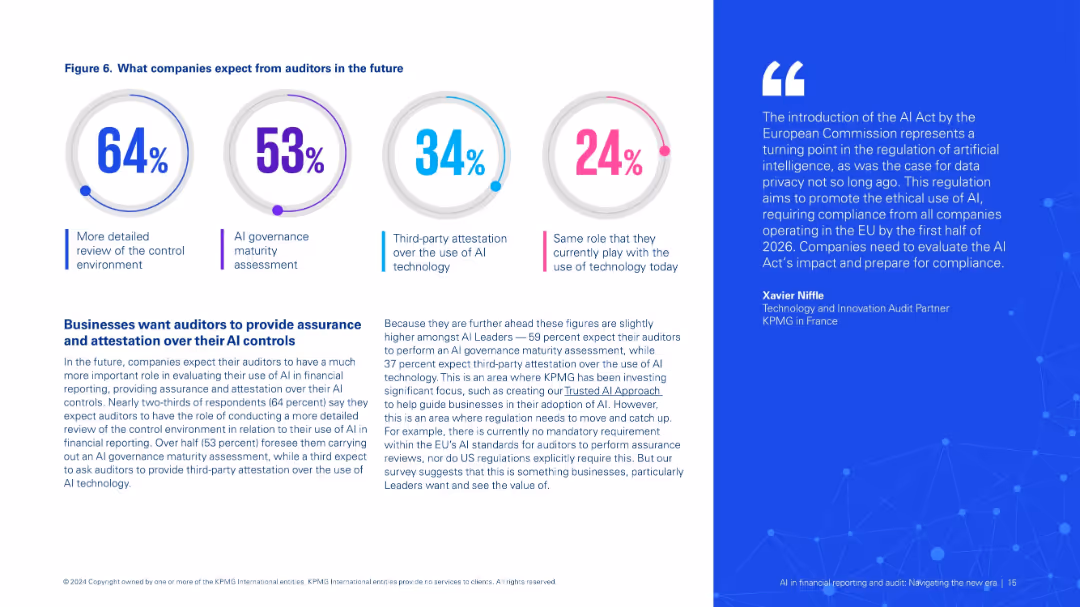
Circular infographic with four expectations, paired with detailed explanation and expert quote on AI auditing trends.
Regulatory and Compliance
Financial Services
Shows what companies expect from auditors regarding AI controls, including more thorough reviews, governance assessments, and attestation roles. Discusses gaps in current regulatory frameworks and future compliance needs.
AI controls, auditing, governance, compliance, EU AI Act, assurance, risk
false
Regulatory and Compliance
Financial Services financial-services
Mixed Chart
KPMG
View slide
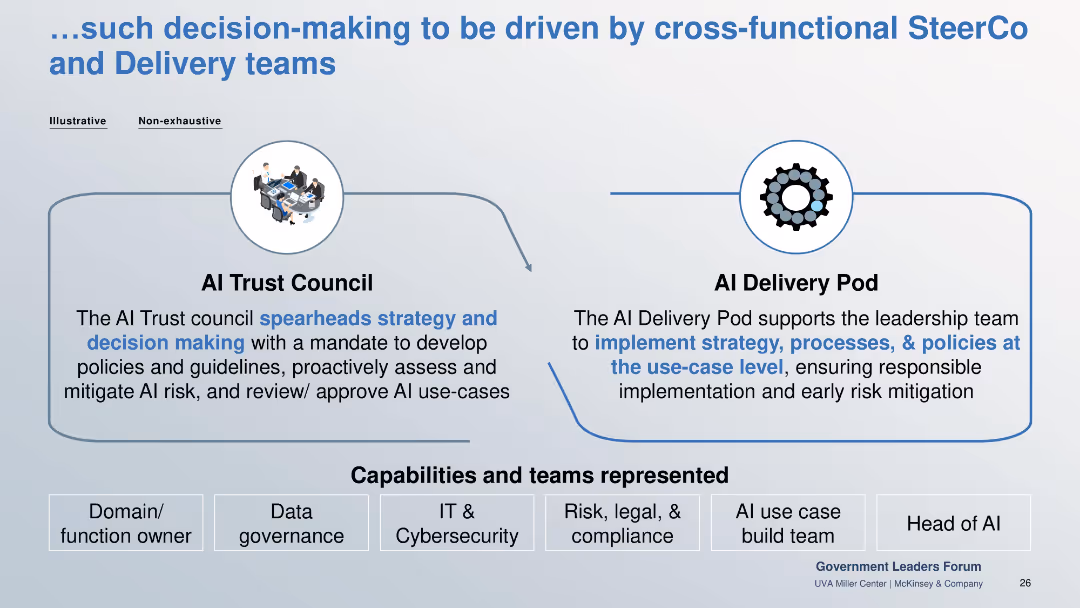
Two-box structure for AI Trust Council and AI Delivery Pod. Capabilities listed below include cybersecurity, legal, and AI use case teams.
Organizational Structure and Change
Government & Public Sector
Describes decision-making structure for responsible AI: a strategy-setting AI Trust Council and execution-focused AI Delivery Pod, backed by multidisciplinary teams.
AI council, delivery pod, cross-functional, risk mitigation, governance, compliance
false
Organizational Structure and Change
Government & Public Sector government-and-public-sector
Linear Flow
McKinsey
View slide
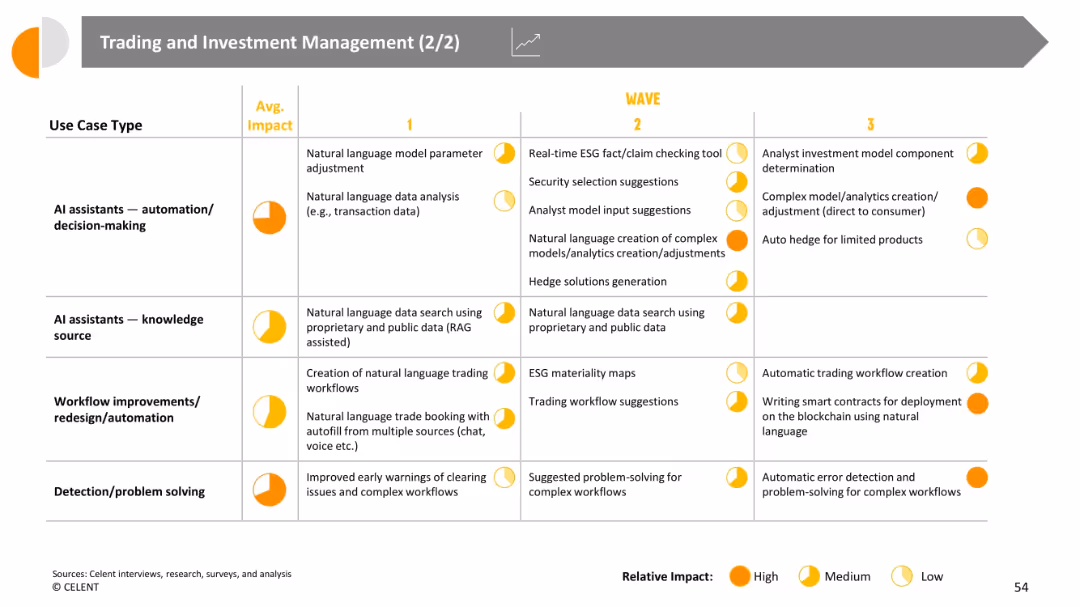
Continuation of tabular matrix; more technical/decision-making AI use types; average impact highlighted for each use case
Risk Assessment and Management
Financial Services
Shows advanced AI use cases including automation/decision-making, workflow redesign, and error/problem detection. Highlights advanced automation of trading logic, smart contracts, and risk management processes across three waves.
AI decision-making, risk models, workflow automation, smart contracts, GenAI in trading
false
Risk Assessment and Management
Financial Services financial-services
Single Chart
Oliver Wyman
View slide
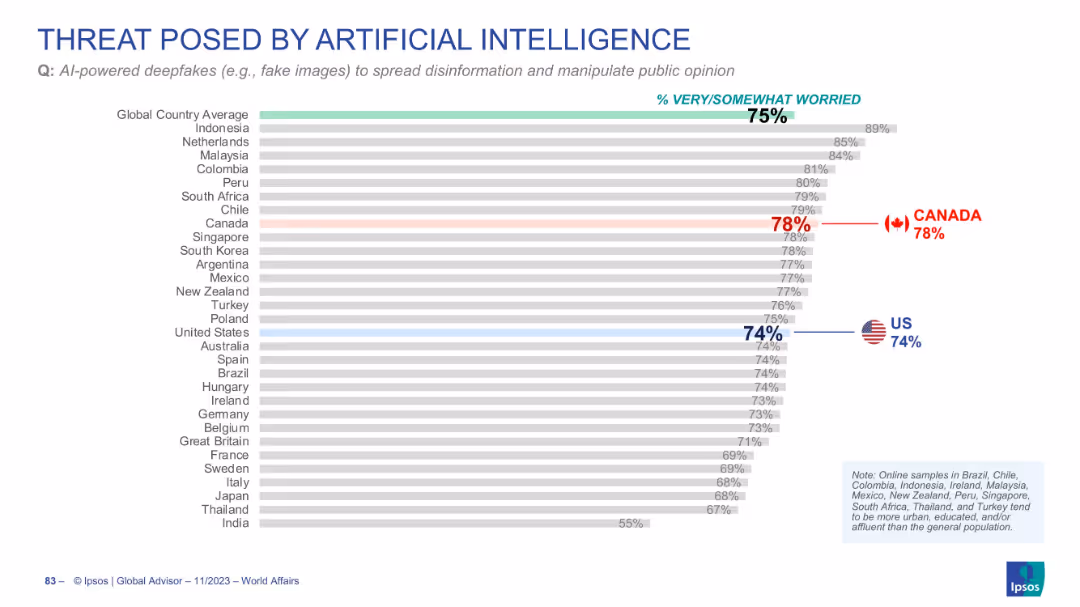
Horizontal bar chart displaying concern over AI-powered deepfakes
Risk Assessment and Management
Artificial Intelligence
Public concern about deepfakes as a tool for disinformation is high globally (75%). Canada (78%) and the US (74%) also show significant concern on this issue.
AI deepfakes, disinformation, public opinion, global perception, misinformation
false
Risk Assessment and Management
Artificial Intelligence artificial-intelligence
Single Chart
IPSOS
View slide
This slide features a large pie chart, presented in a green and white color scheme for clear differentiation of data points. The layout is clean and focuses on the main data visualization elements.
Technology and Digital Transformation
Technology & Software
Analyzes trends in AI deployment and investment, showing a significant increase in AI applications and investment plans. It is relevant for discussions on technology budgeting and strategic investment in the tech industry.
AI deployment, investment trends, technology, strategic investment, tech industry, application increase, budgeting
false
Technology and Digital Transformation
Technology & Software technology-and-software
Mixed Chart
Deloitte
View slide
Contains four numbered sections, each describing a different strategy for overcoming AI deployment challenges, presented in a clear and structured manner. The use of icons and minimal text helps emphasize the strategies effectively.
Technology and Digital Transformation
Technology & Software
Offers strategies for optimizing AI deployment, including investing in culture and leadership, transforming operations, and orchestrating tech and talent. This slide is ideal for strategic planning sessions in technology sectors.
AI deployment, strategies, culture investment, operations transformation, tech orchestration, strategic planning
false
Technology and Digital Transformation
Technology & Software technology-and-software
Linear Flow
Deloitte
View slide
Contains lists, bold headers, and a central illustrative panel showing a group discussion around a table, signifying collaboration and strategy in AI implementation.
Technology and Digital Transformation
Technology & Software
Advocates for a strategic approach to AI ecosystems, emphasizing the need for collaboration, data access, and careful partner selection to optimize AI technologies and cost efficiency.
AI ecosystem, collaboration, data access, strategic planning, cost management
false
Technology and Digital Transformation
Technology & Software technology-and-software
Header Vertical
BCG
View slide
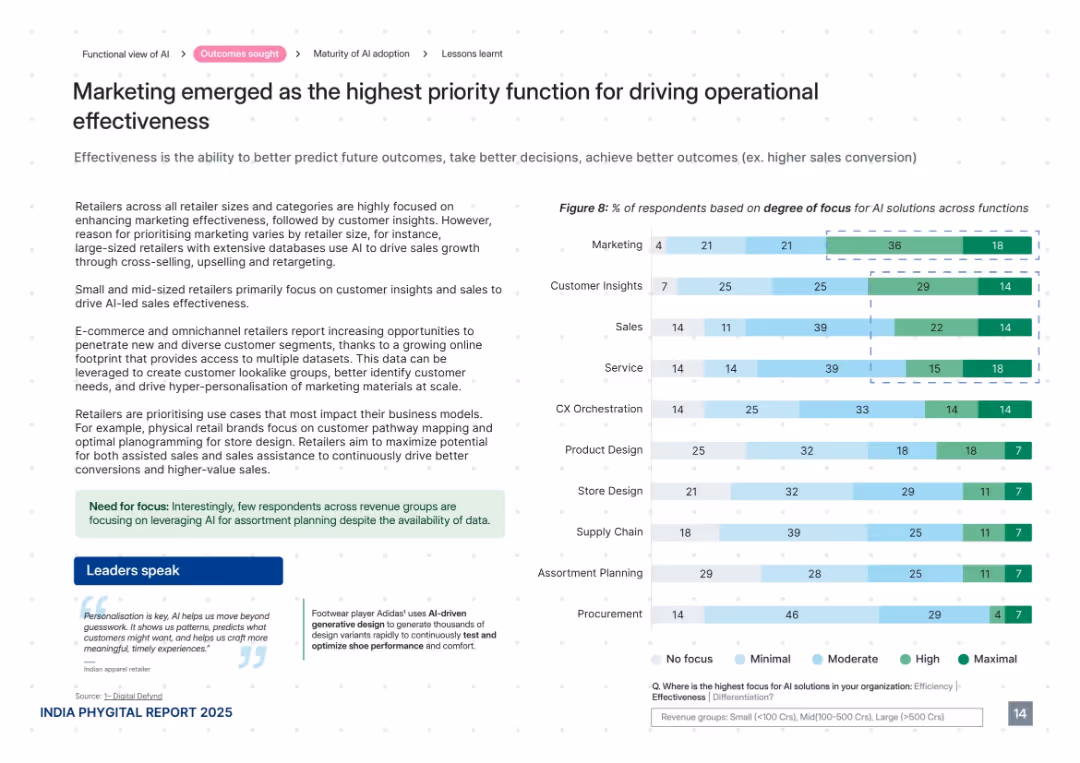
Clear, structured layout with explanatory text, bar graph on right, and quotes below. Uses light greens and blues with white space.
Performance Metrics and KPIs
Retail & E-commerce
This slide shows that marketing is the most focused AI function for driving effectiveness in retail. It outlines how AI is used to predict outcomes and enable data-driven decision-making, with small and mid-sized retailers focused on customer insights and sales. It also mentions the rise of omnichannel approaches and use of customer lookalike models.
AI effectiveness, marketing, customer insights, personalization, retail analytics, targeting, KPIs, sales conversion
false
Performance Metrics and KPIs
Retail & E-commerce retail-and-e-commerce
Mixed Chart
PwC/Strategy&
Previous
Loading...
Hold On!
We are searching in our database
If nothing, comes up, please try different filters!
Column Chart
Heatmap
Chevron
Org Chart
Infographic
Callouts
Timeline
List
Graphic
Picture
Process Flow
Diagram
Paragraph
Map
Table
Framework
Subtitle
Takeaway Box
Icon
Other Chart
Radar Chart
Waterfall Chart
Mekko Chart
Pie Chart
Scatter Plot
Line Chart
Bar chart
Bullet points
Create a FREE account to continue browsing
Receive Instant Access to 1,000+ slides from companies like McKinsey, Google, and Goldman Sachs
First Name
Last Name
Email
Password
I agree to all
Terms & Privacy Policy
Thank you! Your submission has been received!
Oops! Something went wrong while submitting the form.
Have an account?
Sign in
Upgrade to PRO to Save slides
Advanced Search and Filters
Access to 15,000+ slides
Access to Category Pages
Save/Bookmark Slides
PowerPoint Template Library
Pick a Plan
MONTHLY
$12/month
Billed every month, Cancel anytime.
YEARLY
$9/year
Billed $108 annually, Cancel anytime.
Checkout for $12/month
Checkout for $108/yr
Secured by Stripe | AES-256 bit encryption