My Account
My Slides
Search by Category
Templates
View All Templates
Download Template Slides
Leave Feedback
Login
Logout
Get Started
Browse all Slides
Browse all Slides
Create a FREE Account
Instant access to 1,000+ real slides from top companies like McKinsey, BCG, Goldman Sachs, Google and many more!
First Name
Last Name
Email
Password
I agree to all
Terms & Privacy Policy
Thank you! Your submission has been received!
Oops! Something went wrong while submitting the form.
Have an account?
Sign in
Spark Your Next Big Idea with New Presentation Templates
VIEW ALL Templates
Welcome,
Welcome
PRO
Show Featured Only
Checkbox 8
Companies
Mckinsey
Bain
BCG
EY
Deloitte
Accenture
PwC/Strategy&
JP Morgan
Goldman Sachs
Morgan Stanley
Citigroup
Deutsche Bank
Barclays
LEK
KPMG
Kearney
Oliver Wyman
Booz Allen Hamilton
Gartner
IPSOS
Nielsen
Slide type
Text Only
Linear Flow
Vertical Flow
Single Chart
Header Horizontal
Mixed Chart
Header Vertical
Pillar
Multiple Chart
Graphic
Agenda
Title
Table
Framework
Industry
Technology & Software
Artificial Intelligence
Financial Services
Retail & E-commerce
Consumer Goods
Industrial & Manufacturing
Transportation & Logistics
Telecommunications
Real Estate & Construction
Hospitality & Tourism
Professional Services
Education & Training
Media & Entertainment
Agriculture & Food Production
Healthcare & Pharmaceuticals
Environmental Services & Sustainability
Government & Public Sector
Use Case
Mergers and Acquisitions
Performance Metrics and KPIs
Client Case Studies
Competitive Landscape
Corporate Finance and Valuation
Product and Service Analysis
Customer and Market Segmentation
Organizational Structure and Change
Industry Overview
Regulatory and Compliance
Risk Assessment and Management
Investment Analysis
Organizational Structure and Change
Human Resources and Talent Management
Financial Performance
Market Analysis and Trends
Sales and Business Development
Human Resources and Talent Management
Clear all
Thank you! Your submission has been received!
Oops! Something went wrong while submitting the form.
Tag
View slide
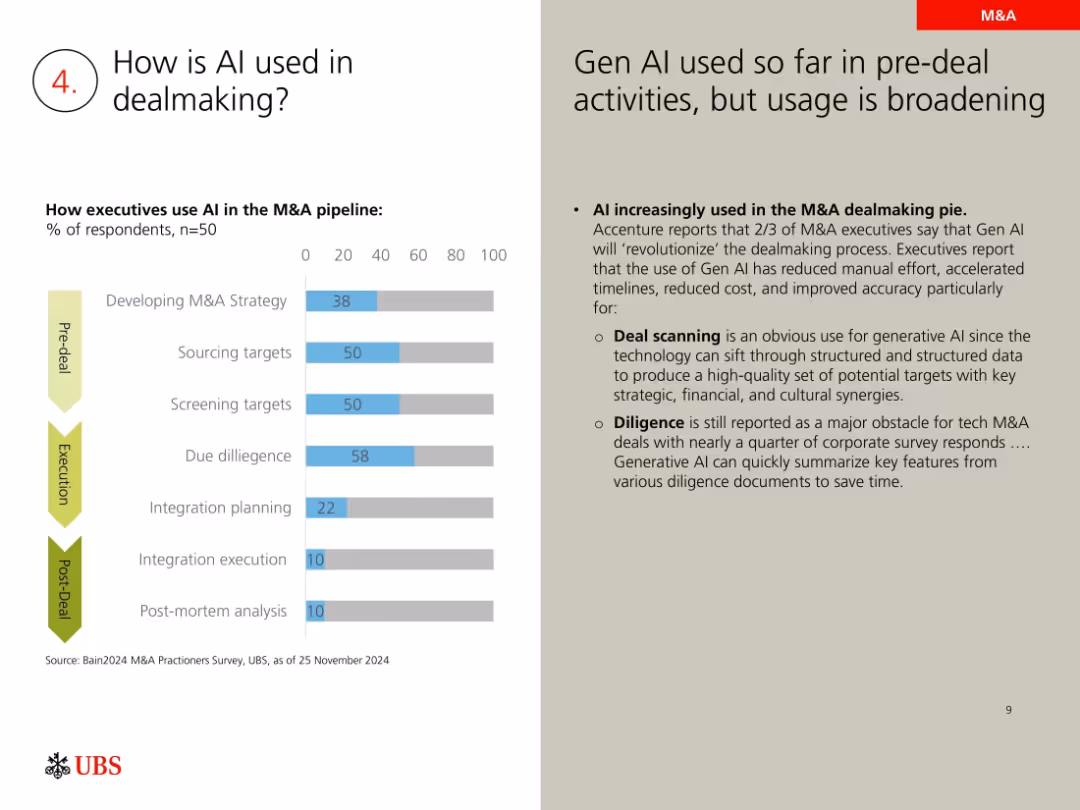
Bar chart on executive AI use across M&A phases; right column text explanation
Technology and Digital Transformation
Artificial Intelligence
Describes how AI is being integrated into various stages of M&A, from strategy development to due diligence. Most usage is in early stages (pre-deal) but is expanding. Gen AI is credited with improving speed, cost, and accuracy.
AI in M&A, due diligence, sourcing targets, generative AI, integration, survey, automation
false
Technology and Digital Transformation
Artificial Intelligence artificial-intelligence
Mixed Chart
UBS
View slide
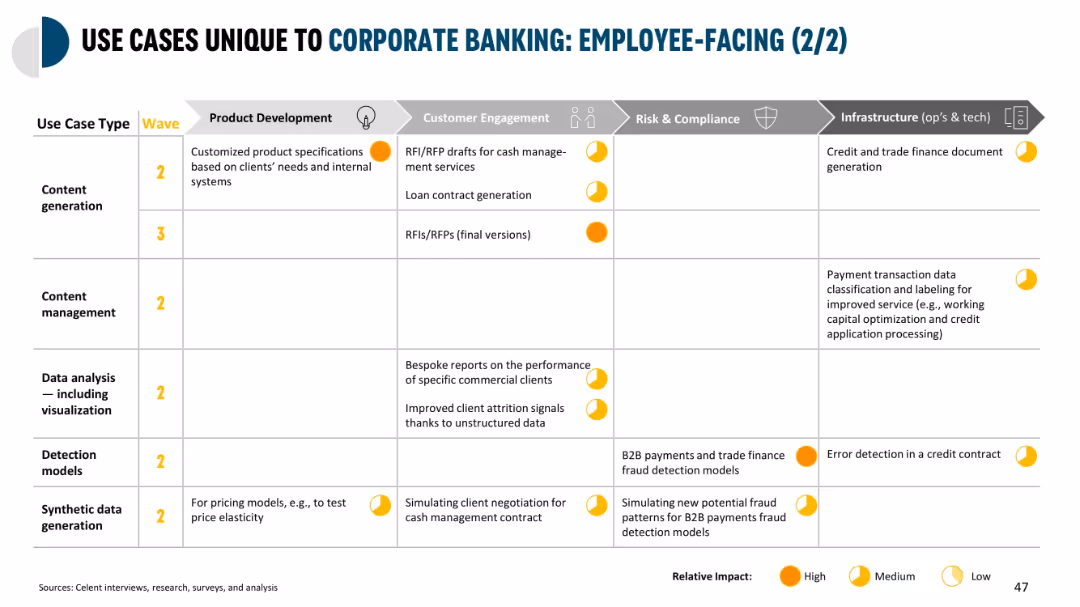
Grid layout table with colored impact indicators (high, medium, low); 5 columns for business functions; categorized by use case type; minimal illustrations
Operational Efficiency
Financial Services
Details AI-enabled employee-facing use cases in corporate banking across five categories—product development, customer engagement, risk & compliance, and infrastructure. Focuses on areas like content generation, detection models, synthetic data use, and improved analysis.
AI in banking, employee tools, risk detection, synthetic data, infrastructure
false
Operational Efficiency
Financial Services financial-services
Single Chart
Oliver Wyman
View slide
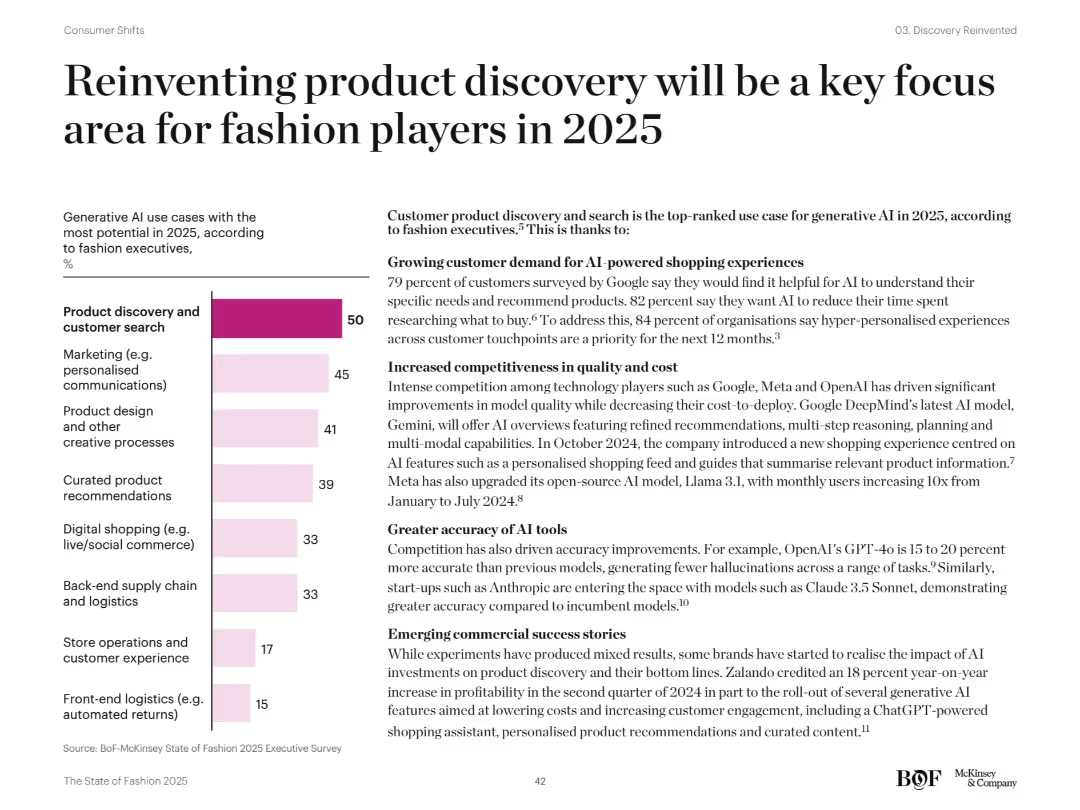
Two-column layout with left bar chart and right-aligned text. Uses black and pastel colors. Bar chart ranks AI use cases by importance. Right side includes detailed bullet points with bolded subheadings.
Technology and Digital Transformation
Retail & E-commerce
Discusses AI use cases in fashion, highlighting "product discovery and customer search" as the top priority. Explains customer demand, AI improvements, competitive tech developments, and emerging commercial success stories for 2025.
AI in fashion, product discovery, personalization, generative AI, Gemini, Claude, GPT-4o
false
Technology and Digital Transformation
Retail & E-commerce retail-and-e-commerce
Mixed Chart
McKinsey
View slide
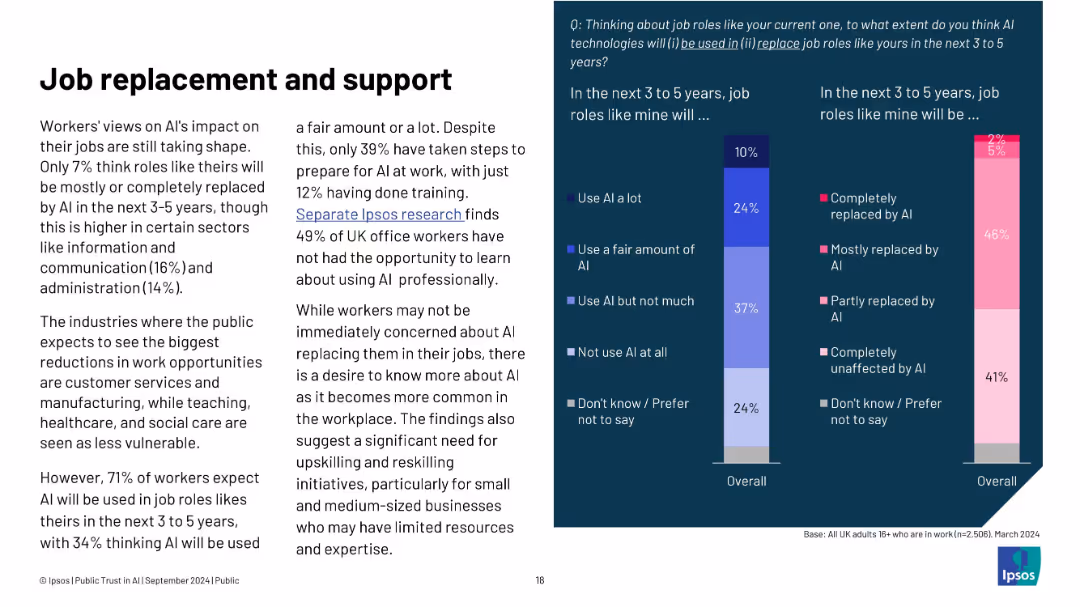
Left: summary of worker sentiment and expectations; right: bar charts on AI job use and replacement
Human Resources and Talent Management
Artificial Intelligence
Most workers don’t believe AI will fully replace their jobs in the near term, but many expect it to be used in their roles. Still, few are taking steps to prepare. The slide stresses the need for reskilling, especially in sectors likely to be most affected by AI.
AI in work, job replacement, Ipsos, upskilling, training, worker sentiment, automation, career support
false
Human Resources and Talent Management
Artificial Intelligence artificial-intelligence
Mixed Chart
IPSOS
View slide
Slide with a dark background and a color-coded horizontal bar graph examining the introduction of AI initiatives in various regions.
Regulatory and Compliance
Technology & Software
Investigates the adoption of AI initiatives across global regions, reflecting on current business practices and future trends.
AI initiatives, global trends, CEO survey, regional adoption, business practices, technology integration, market analysis, future planning
false
Regulatory and Compliance
Technology & Software technology-and-software
Single Chart
PwC/Strategy&
View slide
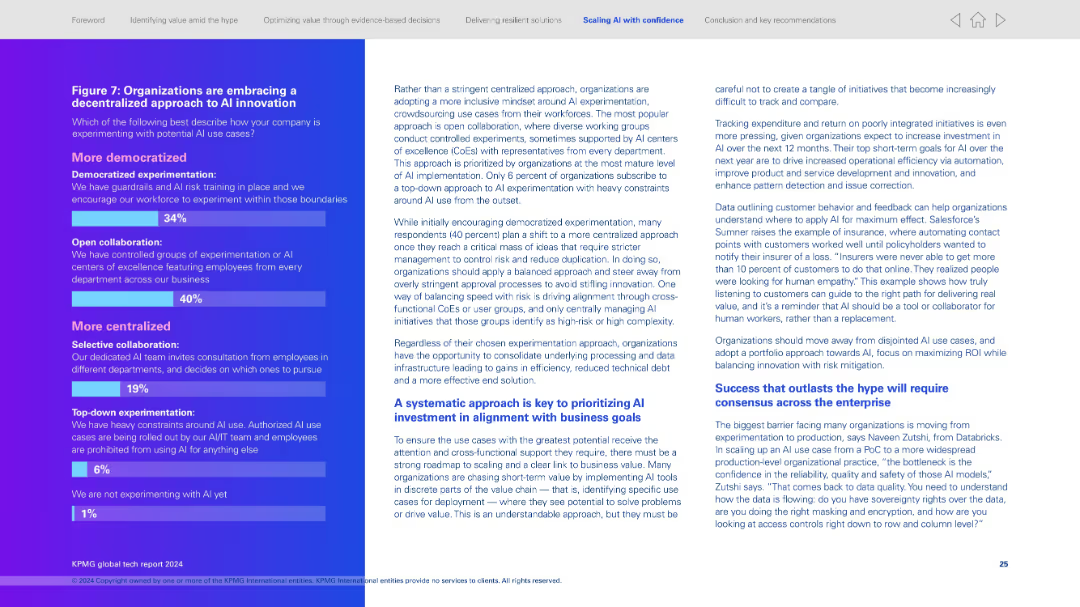
Left side presents a survey result in gradient bar chart format; right side contains detailed explanatory text on experimentation strategies.
Technology and Digital Transformation
Artificial Intelligence
Highlights shift from centralized to decentralized AI experimentation. Shows most organizations prefer open collaboration (40%) or democratized approaches (34%). Right panel elaborates on balanced experimentation models and aligning AI with business outcomes.
AI innovation, decentralized experimentation, collaboration, democratized AI, strategic alignment, innovation culture, organizational maturity
false
Technology and Digital Transformation
Artificial Intelligence artificial-intelligence
Mixed Chart
KPMG
View slide
Contains a simple, clear layout with purple headers and subheaders over a white background. It outlines steps such as "Gen AI in Your Enterprise" and "Scale AI Responsibly" with concise bullet points under each section.
Operational Efficiency
Technology & Software
Provides a structured plan for incorporating AI into business practices, focusing on scalability, workforce transformation, and ethical considerations.
AI integration, business strategy, scalability, ethical AI, workforce transformation, leadership, digital transformation, operational efficiency, AI roadmap
false
Operational Efficiency
Technology & Software technology-and-software
Header Vertical
Accenture
View slide
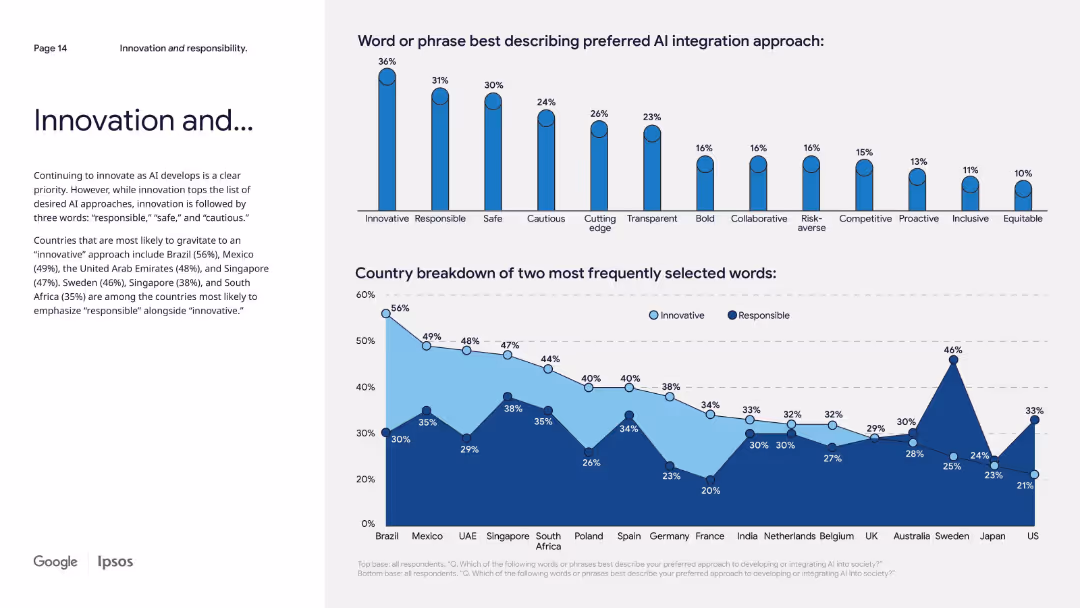
Two-part layout: left narrative and two bar charts on the right—top for integration terms, bottom for country preferences.
Technology and Digital Transformation
Artificial Intelligence
This slide explores preferred values for AI integration, with "innovative" topping the list globally. Many also emphasize “responsible,” “safe,” and “cautious,” showing the tension between progress and regulation. Country-level data shows how cultural values shape attitudes.
AI integration, responsible innovation, global preferences, terminology, country trends, public values
false
Technology and Digital Transformation
Artificial Intelligence artificial-intelligence
Multiple Chart
IPSOS
View slide
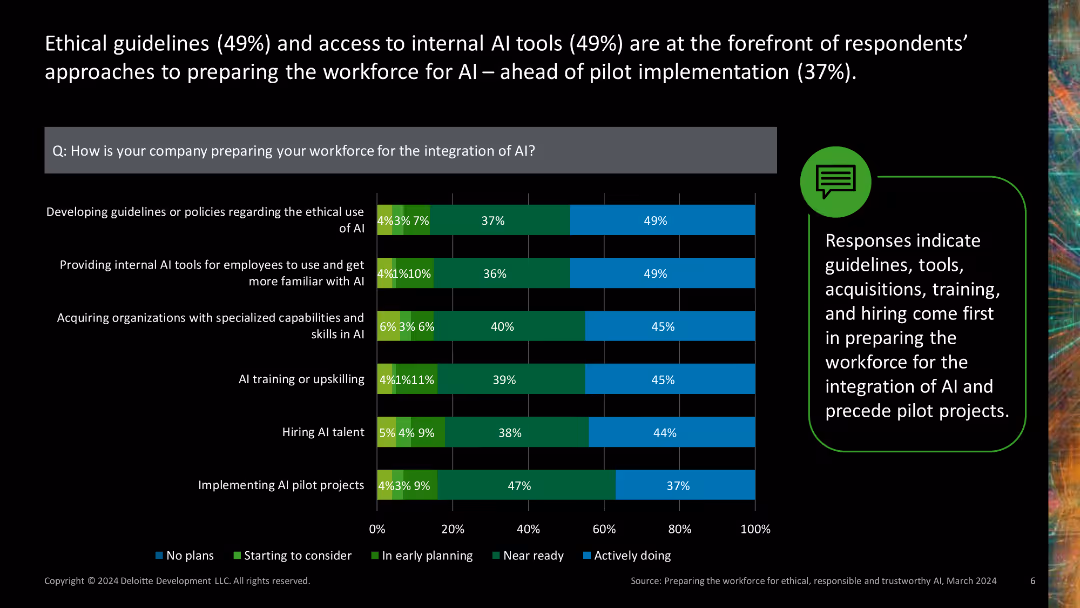
Stacked bar chart showing various approaches companies take to prepare their workforce for AI integration.
Human Resources and Talent Management
Technology & Software
Illustrates different strategies companies use to ready their workforce for AI, such as developing guidelines, providing AI tools, and acquiring AI skills.
AI integration, workforce preparation, guidelines, AI tools, skill acquisition
false
Human Resources and Talent Management
Technology & Software technology-and-software
Mixed Chart
Deloitte
View slide
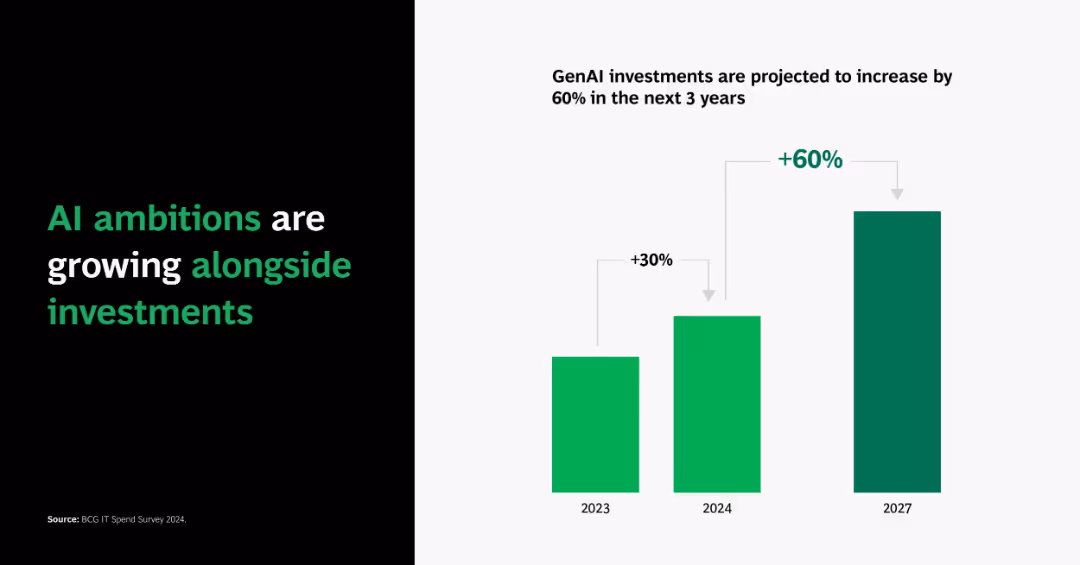
Split layout: black left panel with bold green/white typography; right side shows a vertical bar chart with 2023–2027 projections and growth percentages.
Strategic Planning
Artificial Intelligence
Highlights a 60% projected increase in GenAI investments over 3 years, starting from a 30% increase in 2024, indicating rising ambitions and commitment to AI.
AI investment, GenAI, growth, projections, 2023, 2024, 2027, chart, ambitions, funding
false
Strategic Planning
Artificial Intelligence artificial-intelligence
Single Chart
BCG
View slide
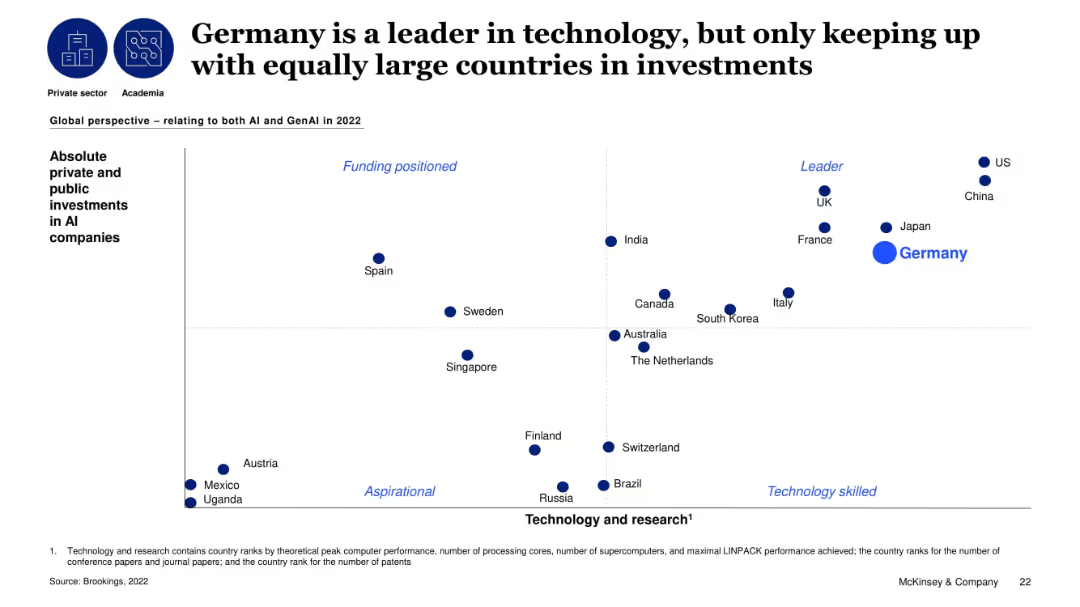
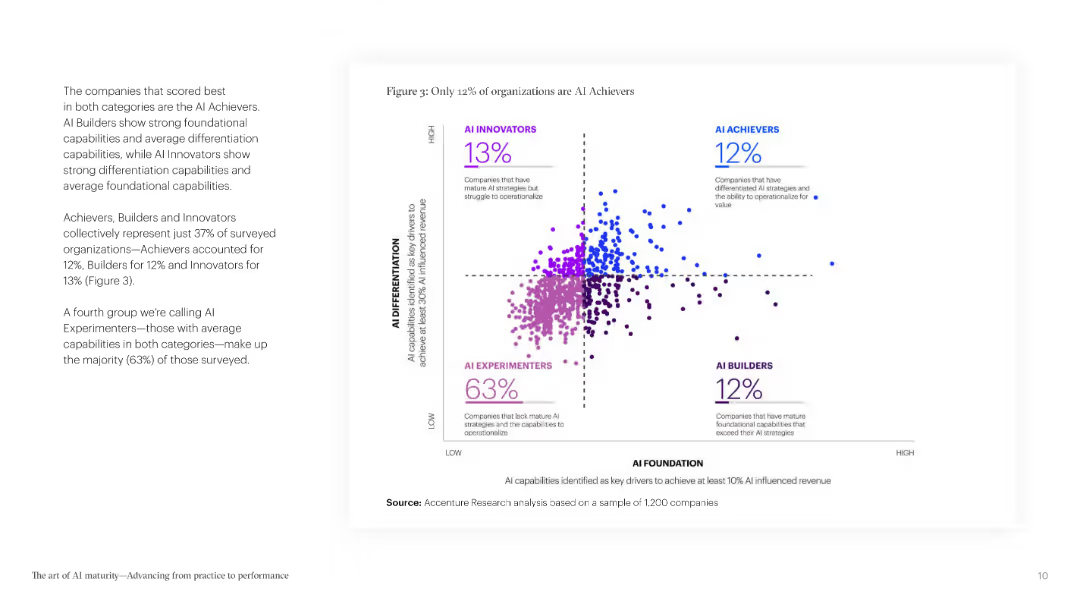
Global scatterplot comparing countries on AI investments vs. tech/research capabilities; Germany is large but middle-tier.
Investment Analysis
Artificial Intelligence
The slide maps countries based on their technology strength and AI investment levels. Germany appears as a tech leader but lags behind nations like the US and China in investment. The visual reinforces the point that Germany needs to increase AI investment to match its technical capability.
AI investment, Germany, global comparison, technology, research, funding, public-private
false
Investment Analysis
Artificial Intelligence artificial-intelligence
Single Chart
McKinsey
View slide
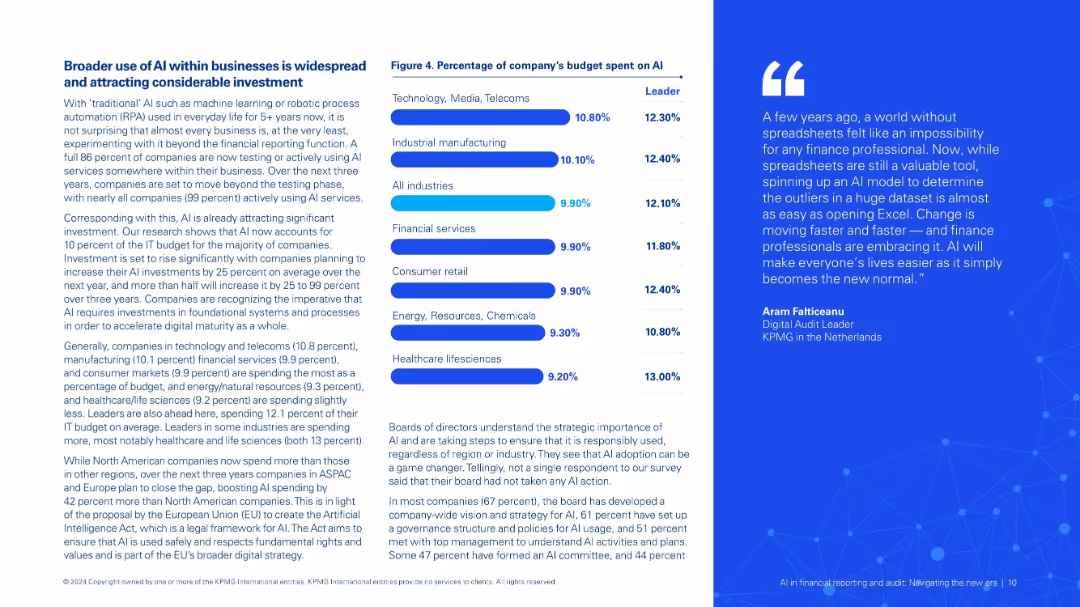
Two-column format: left side text-heavy with insights; right side features a vertical bar chart of AI budget allocation by sector and maturity.
Investment Analysis
Financial Services
Describes expanding use of AI in businesses and increasing investment. Charts AI budget share by sector and maturity level. Highlights governance, strategic alignment, and the EU AI Act's anticipated impact.
AI investment, IT budget, digital maturity, sector comparison, governance, compliance
false
Investment Analysis
Financial Services financial-services
Mixed Chart
KPMG
View slide
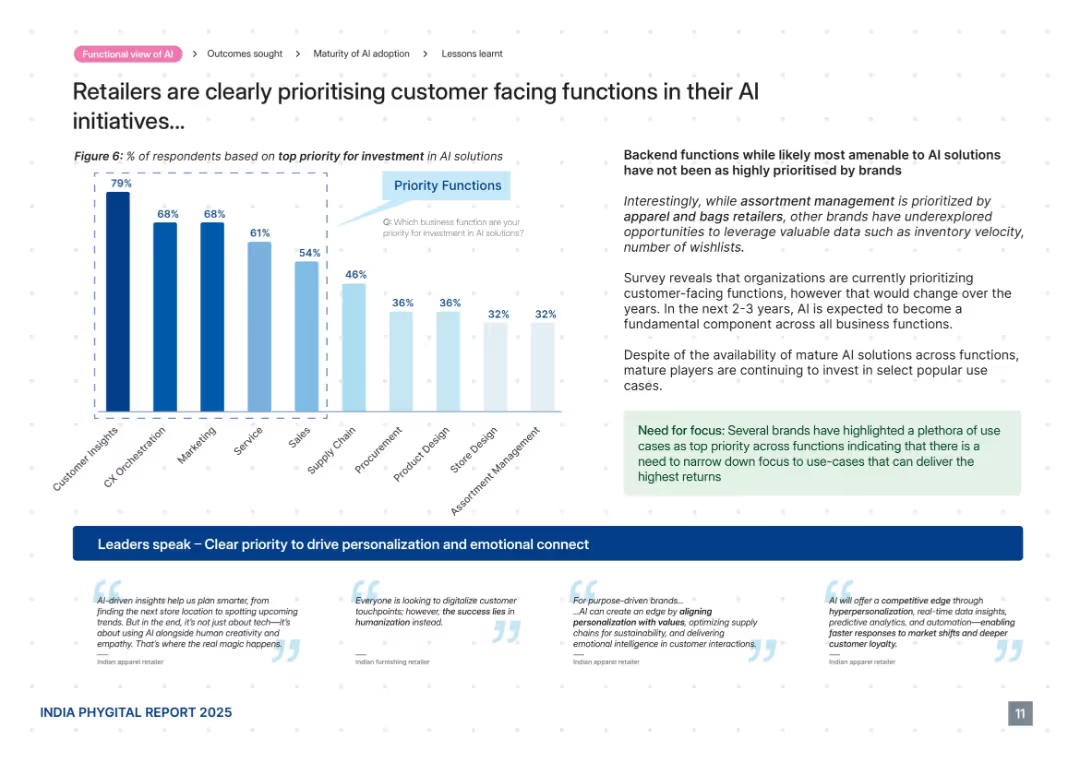
Mixed chart and commentary layout. Bar graph on left side, supporting commentary on right with highlighted callout box and quotes at the bottom. Follows dotted grid background.
Product and Service Analysis
Retail & E-commerce
This slide reveals that retailers are prioritizing customer-facing AI functions such as customer insights, CX orchestration, and marketing over backend operations. It highlights the trend of using AI for personalization and emotional connection. Despite backend potential, most investments are going toward functions with visible customer impact and faster returns.
AI investment, customer insights, marketing, CX orchestration, personalization, emotional connect, priorities
false
Product and Service Analysis
Retail & E-commerce retail-and-e-commerce
Mixed Chart
PwC/Strategy&
View slide
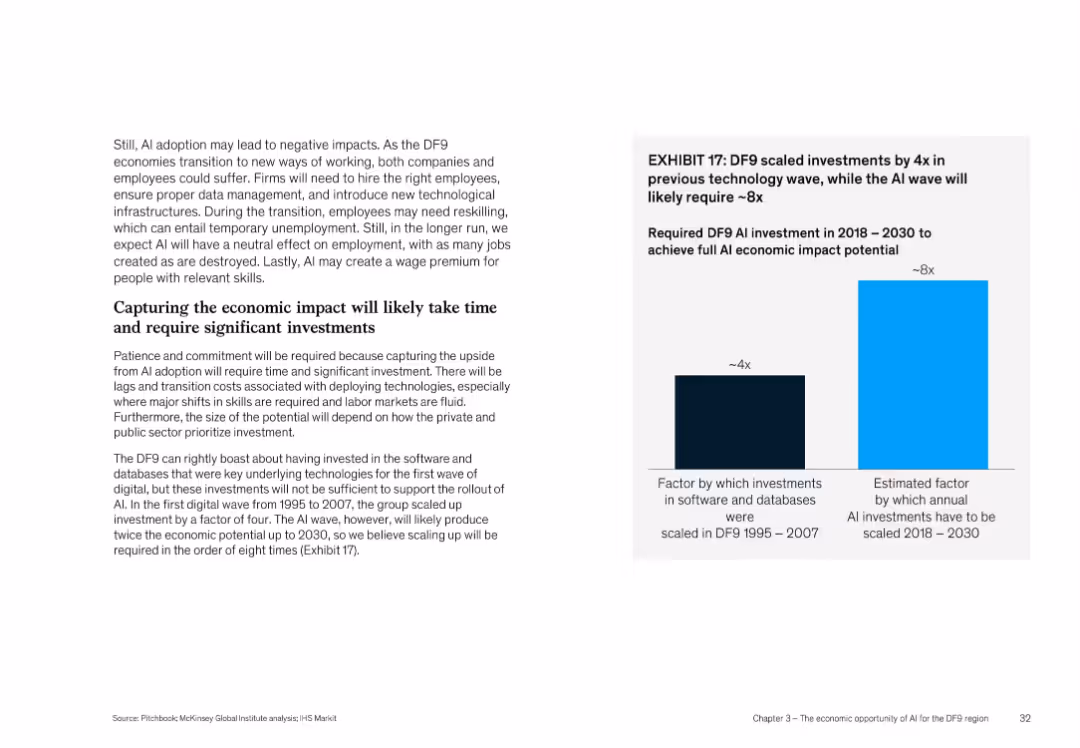
Split layout with bar chart on right and dense text on left, uses bold headers and blue highlights
Investment Analysis
Artificial Intelligence
This slide highlights that AI's economic potential in DF9 will require scaling investment by 8x compared to a 4x increase during earlier tech waves (1995–2007). It discusses the need for reskilling, proper infrastructure, and how private/public sectors must prioritize investment to capture AI benefits.
AI investment, economic impact, scaling, DF9, reskilling, infrastructure
false
Investment Analysis
Artificial Intelligence artificial-intelligence
Mixed Chart
McKinsey
View slide
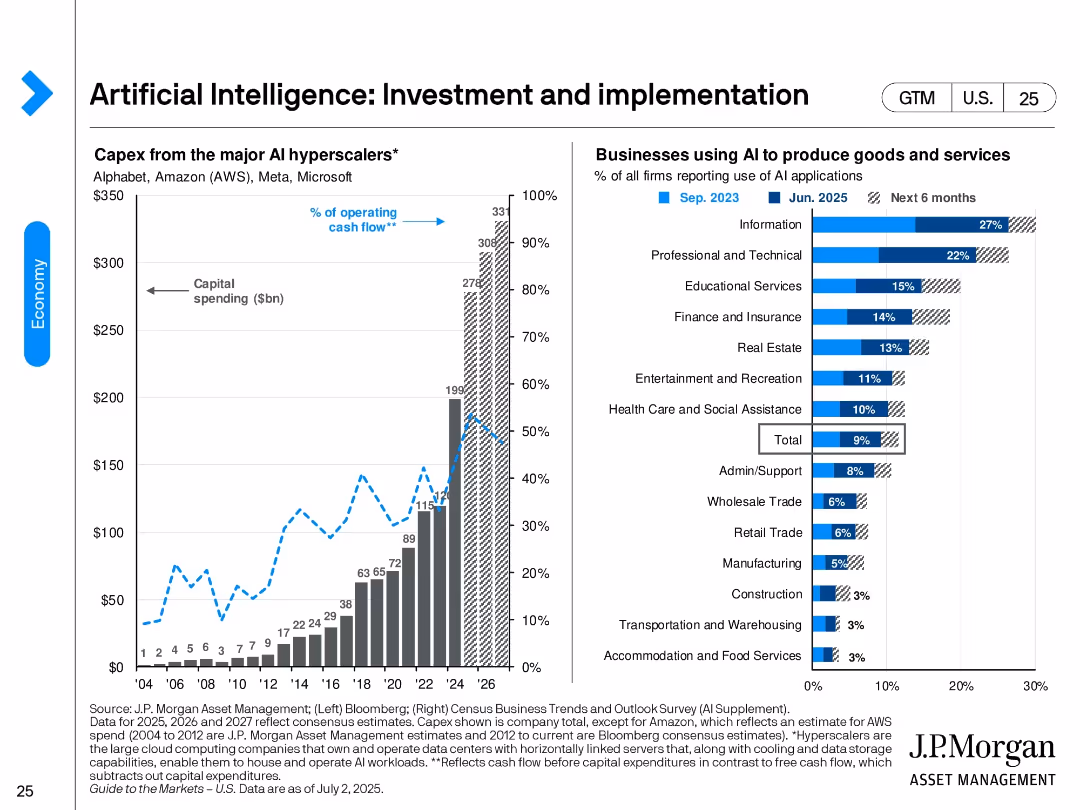
Split design. Left: bar and line chart showing capex by major AI hyperscalers from 2004 to projected 2026. Right: bar chart ranking industry AI adoption rates as of June 2025 and future intent.
Technology and Digital Transformation
Artificial Intelligence
Shows the surge in AI investment by major hyperscalers like AWS, Microsoft, and Alphabet. It also identifies sectors with highest AI adoption—led by Information and Professional Services—and expectations for broader deployment in the next 6 months.
AI investment, hyperscalers, technology adoption, AI implementation, industry adoption, digital transformation, capex, cloud
false
Technology and Digital Transformation
Artificial Intelligence artificial-intelligence
Multiple Chart
JP Morgan
View slide
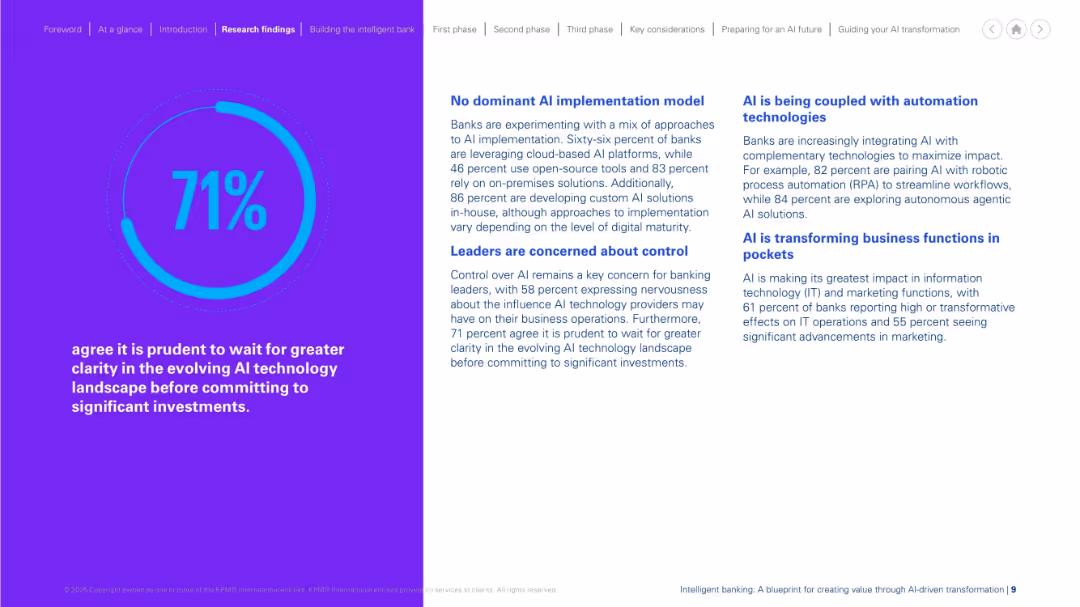
Split design: large purple section with percentage graphic on the left, text and multiple headers in blue on white background on the right. Structured and color-contrasted layout.
Investment Analysis
Financial Services
The slide shows 71% of respondents believe it's wise to delay major AI investments until the tech landscape is clearer. It highlights lack of a dominant AI model, leadership concerns about control, and the role of automation. It reveals banks’ cautious yet evolving stance towards AI, with adoption happening selectively and with reservations around operational impact.
AI investment, risk, caution, automation, control, banking strategy
false
Investment Analysis
Financial Services financial-services
Mixed Chart
KPMG
View slide
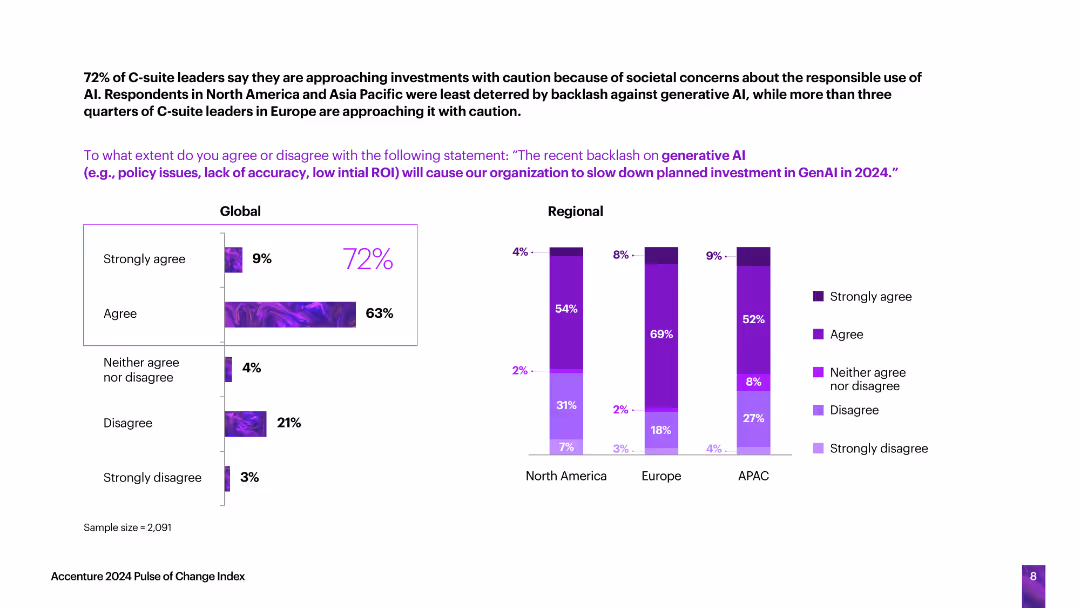
This slide features horizontal bar charts showing the extent to which C-suite leaders agree or disagree with statements about societal concerns affecting AI investments, segmented globally and regionally.
Technology and Digital Transformation
Technology & Software
The slide discusses how societal concerns about the responsible use of AI are affecting investments, with a significant number of leaders approaching AI investments cautiously due to these concerns.
AI investments, societal concerns, caution, responsible use, global, regional
false
Technology and Digital Transformation
Technology & Software technology-and-software
Multiple Chart
Accenture
View slide
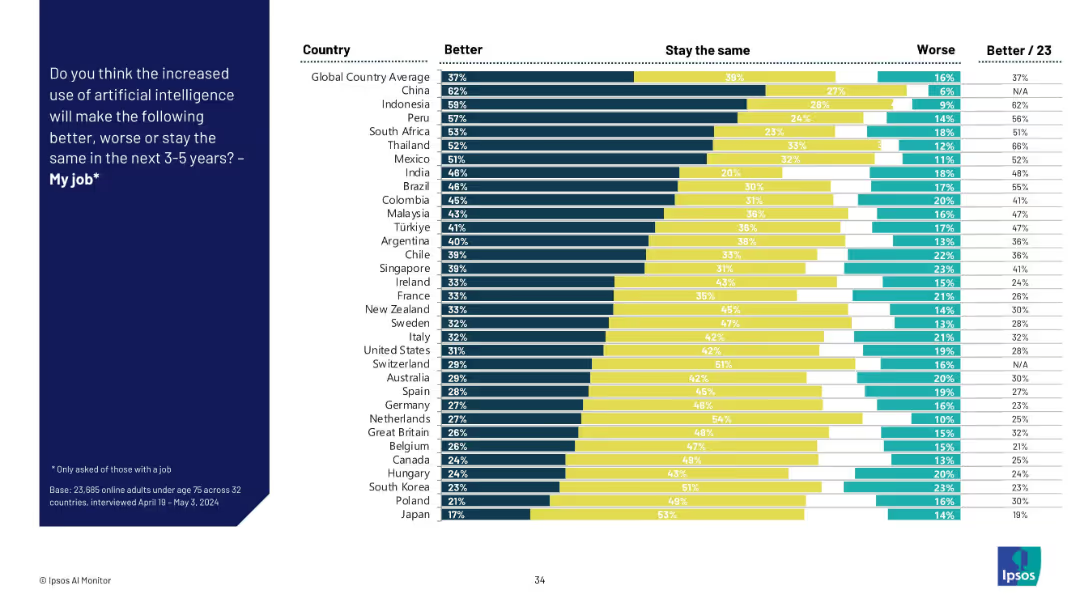
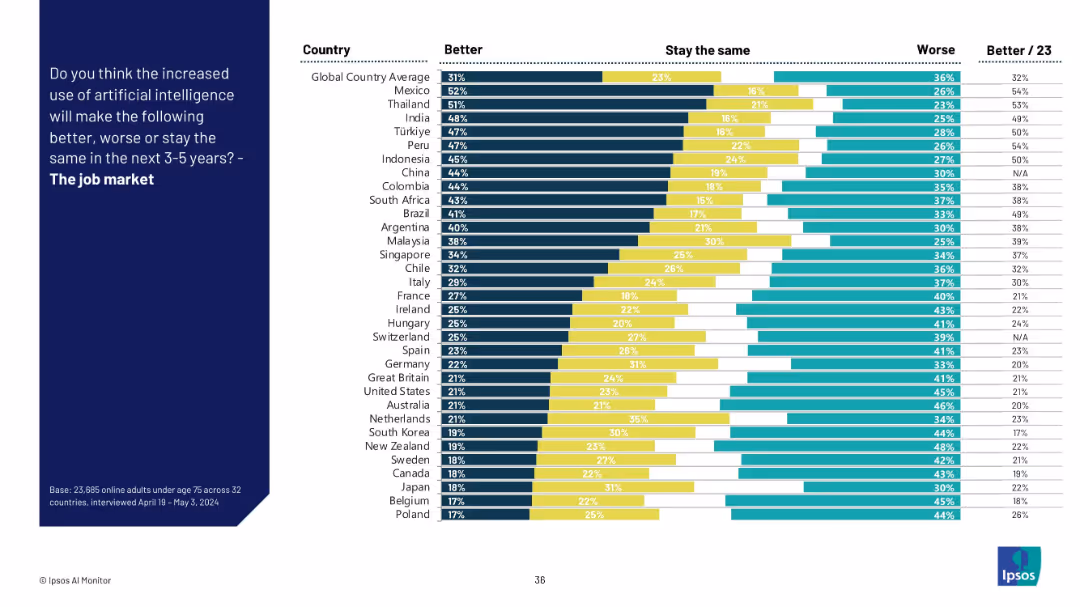
Stacked bar chart by country showing "Better," "Stay the same," and "Worse" views on AI’s job impact. Colors separate the three opinions.
Human Resources and Talent Management
Artificial Intelligence
This slide captures perceptions across countries about whether AI will improve, worsen, or not affect their job over the next 3–5 years. Optimism is highest in Asia and Latin America, while skepticism is more prevalent in Western Europe.
AI job impact, country analysis, workplace outlook, sentiment distribution, talent management, job improvement, technology shift
false
Human Resources and Talent Management
Artificial Intelligence artificial-intelligence
Mixed Chart
IPSOS
View slide
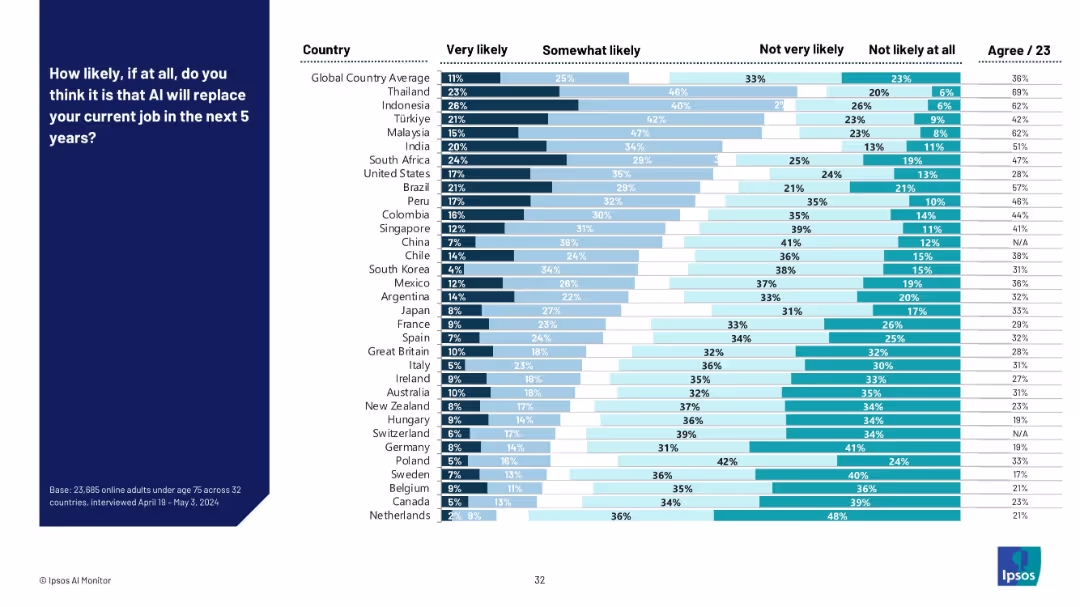
Mixed bar chart with four response categories across countries, color-coded by likelihood level.
Risk Assessment and Management
Artificial Intelligence
This slide examines perceived risk of AI replacing jobs within five years across different countries. Southeast Asia expresses greater concern compared to Europe and North America. The data reflects varying levels of anxiety about job displacement.
AI job replacement, employment risk, automation, country comparison, fear of displacement, labor market, survey analysis, AI threat
false
Risk Assessment and Management
Artificial Intelligence artificial-intelligence
Mixed Chart
IPSOS
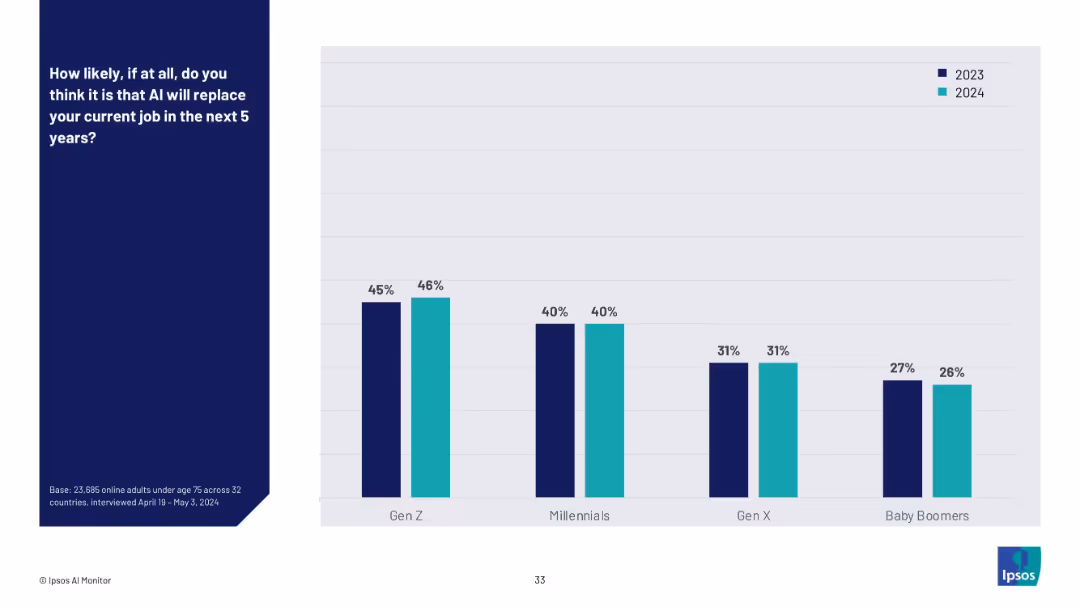
View slide
Vertical bar chart comparing 2023 vs. 2024 responses across generational groups (Gen Z to Baby Boomers).
Risk Assessment and Management
Artificial Intelligence
This slide tracks the year-over-year change in belief that AI will replace current jobs. Gen Z maintains the highest level of concern, while Baby Boomers show the least concern. Overall, responses have remained relatively stable between 2023 and 2024.
AI job risk, generational perception, technology anxiety, automation, workplace displacement, year-on-year trend, AI adoption
false
Risk Assessment and Management
Artificial Intelligence artificial-intelligence
Mixed Chart
IPSOS
View slide
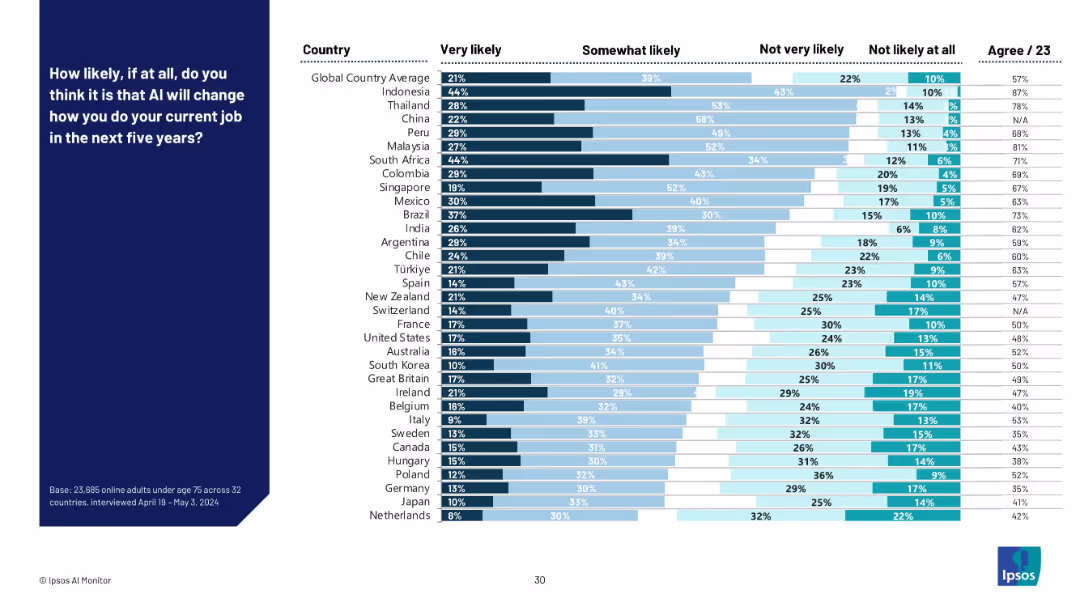
Mixed bar chart with four response categories (very likely to not likely at all) across countries. Bars are color-coded by intensity of likelihood.
Technology and Digital Transformation
Artificial Intelligence
This slide shows perceived likelihood across countries that AI will change how people perform their current jobs in the next five years. Asian countries like Indonesia and Thailand show the highest perceived likelihood, while Western European countries show more skepticism.
AI jobs, workplace transformation, future of work, employment outlook, country breakdown, likelihood perception, digital tools, survey
false
Technology and Digital Transformation
Artificial Intelligence artificial-intelligence
Mixed Chart
IPSOS
View slide
This slide features a roadmap with five steps, each represented by a point on the path. The steps are indicated with numbered markers and include brief descriptions. The background is dark with a network pattern, and the text is in white and purple.
Strategic Planning
Technology & Software
The slide outlines guiding principles for driving an AI journey, emphasizing prioritizing value creation, encouraging innovation, assessing capabilities, involving the organization, and using AI responsibly.
AI journey, roadmap, strategy, innovation, governance
false
Strategic Planning
Technology & Software technology-and-software
Vertical Flow
Kearney
View slide
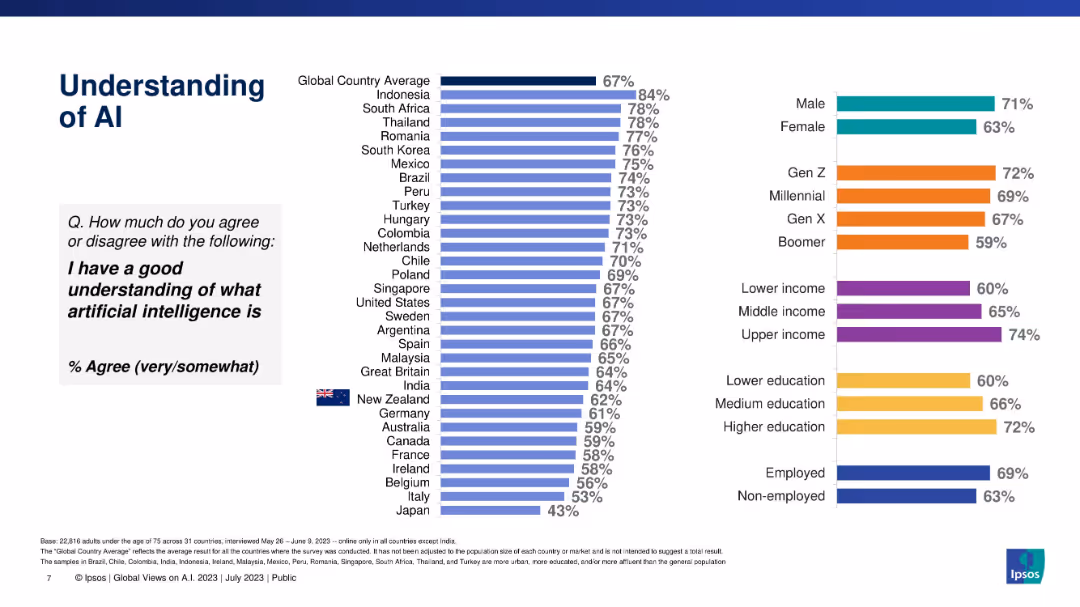
Vertical bar chart ranking countries by % agreement with understanding AI; right side shows demographics.
Industry Overview
Artificial Intelligence
This slide visualizes how well citizens of various countries understand what artificial intelligence is. It ranks countries and breaks down understanding by gender, generation, income, education, and employment status, highlighting demographic differences in awareness.
AI knowledge, global comparison, demographics, Ipsos, awareness, education, income, employment, understanding
false
Industry Overview
Artificial Intelligence artificial-intelligence
Multiple Chart
IPSOS
View slide
Stacked bar chart showing global country responses on whether AI will improve, harm, or leave the job market unchanged.
Strategic Planning
Artificial Intelligence
This slide evaluates opinions across countries on AI’s effect on the broader job market in the next 3–5 years. Results are mixed, with Latin America and Asia leaning optimistic, and European nations showing concern or neutrality.
AI labor market, workforce trends, employment future, strategic planning, technology impact, global perception, jobs outlook
false
Strategic Planning
Artificial Intelligence artificial-intelligence
Mixed Chart
IPSOS
View slide
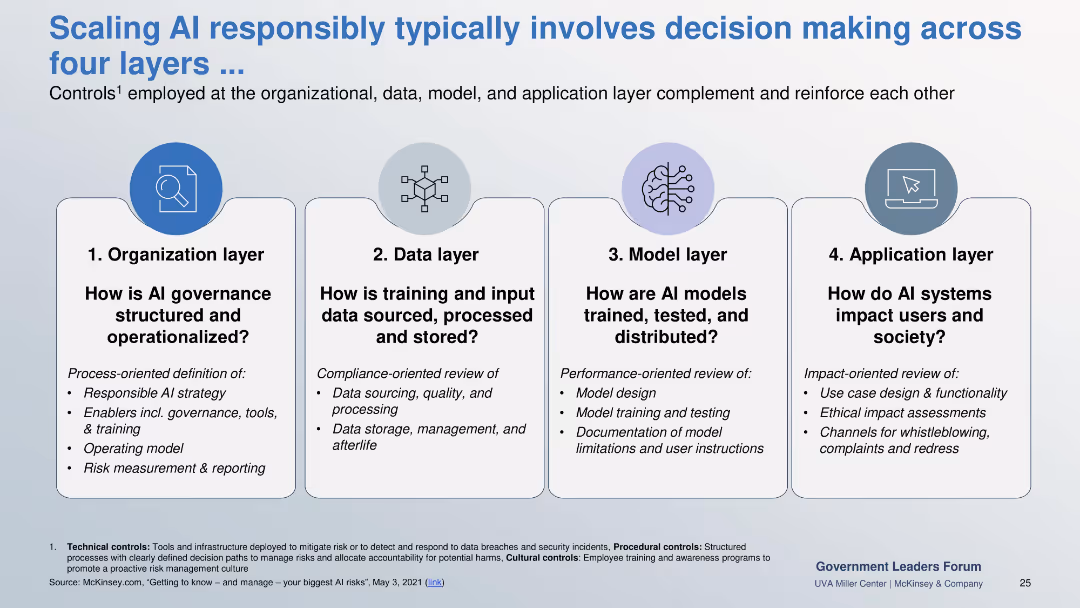
Four-column layout showing Organizational, Data, Model, and Application layers. Each column details control areas and review types.
Risk Assessment and Management
Government & Public Sector
Explains layered AI governance: organizational processes, data compliance, model performance testing, and user impact review. Designed to support safe, ethical AI at scale.
AI layers, governance, compliance, model testing, user impact, risk measurement
false
Risk Assessment and Management
Government & Public Sector government-and-public-sector
Pillar
McKinsey
View slide
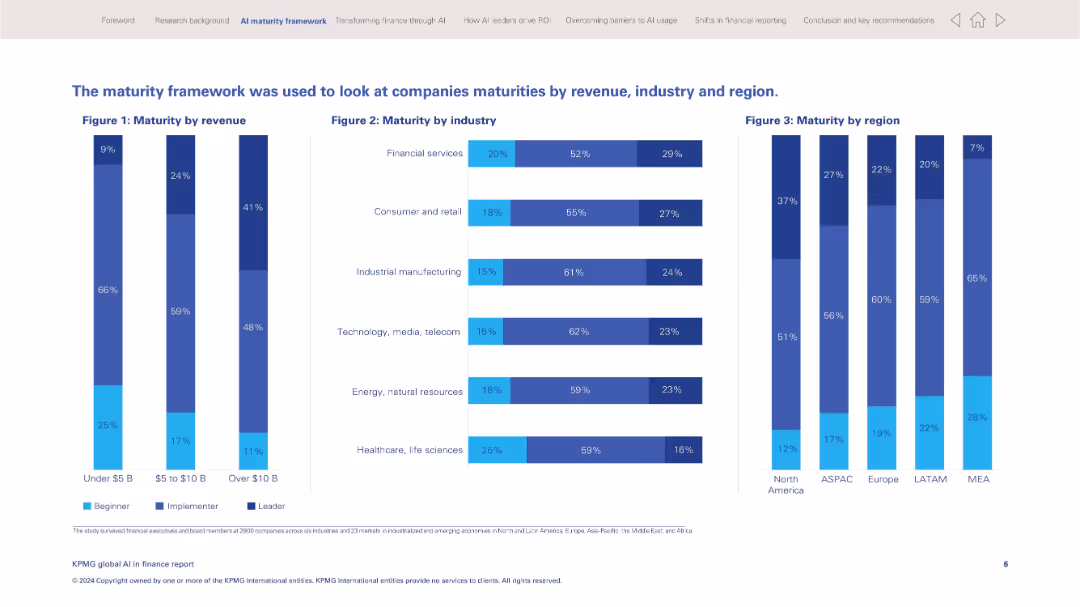
Full-width layout with three vertical bar charts showing AI maturity distribution across revenue, industry, and geography.
Operational Efficiency
Financial Services
Illustrates AI maturity levels (beginner, implementer, leader) across company revenue bands, industries, and regions. Highlights disparities in adoption and positioning for AI leadership across sectors and regions.
AI maturity, benchmarking, revenue, industry comparison, regional trends, implementation, leader status, AI adoption
false
Operational Efficiency
Financial Services financial-services
Multiple Chart
KPMG
View slide
The slide features a large section of text explaining the importance of AI maturity, accompanied by a column chart illustrating the projected time for AI transformation compared to digital transformation.
Market Analysis and Trends
Technology & Software
This slide emphasizes the critical role of AI in gaining competitive advantage, highlighting survey data on the importance of AI, and showing a projection of AI transformation timelines.
AI maturity, competitive advantage, transformation, digital transformation, survey data
false
Market Analysis and Trends
Technology & Software technology-and-software
Pillar
Accenture
View slide
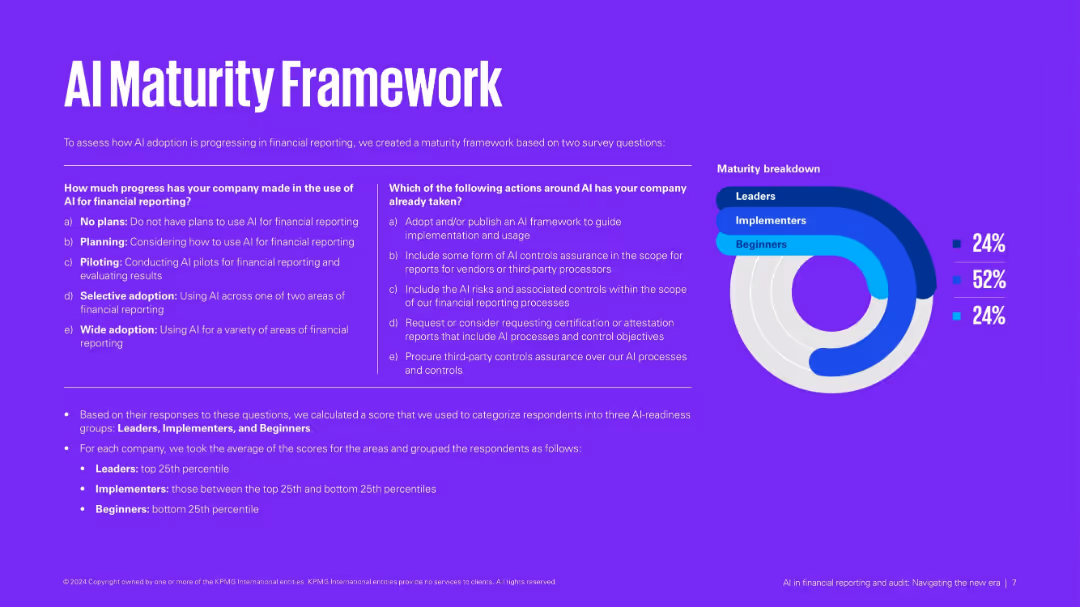
Purple background with side-by-side matrices and a donut chart breakdown of maturity levels: Leaders, Implementers, Beginners.
Technology and Digital Transformation
Financial Services
Defines an AI maturity model based on usage and actions taken. Categorizes companies into three groups based on their AI implementation readiness. Provides criteria and scoring method for classification.
AI maturity, financial reporting, implementation stages, digital transformation, assessment
false
Technology and Digital Transformation
Financial Services financial-services
Mixed Chart
KPMG
View slide
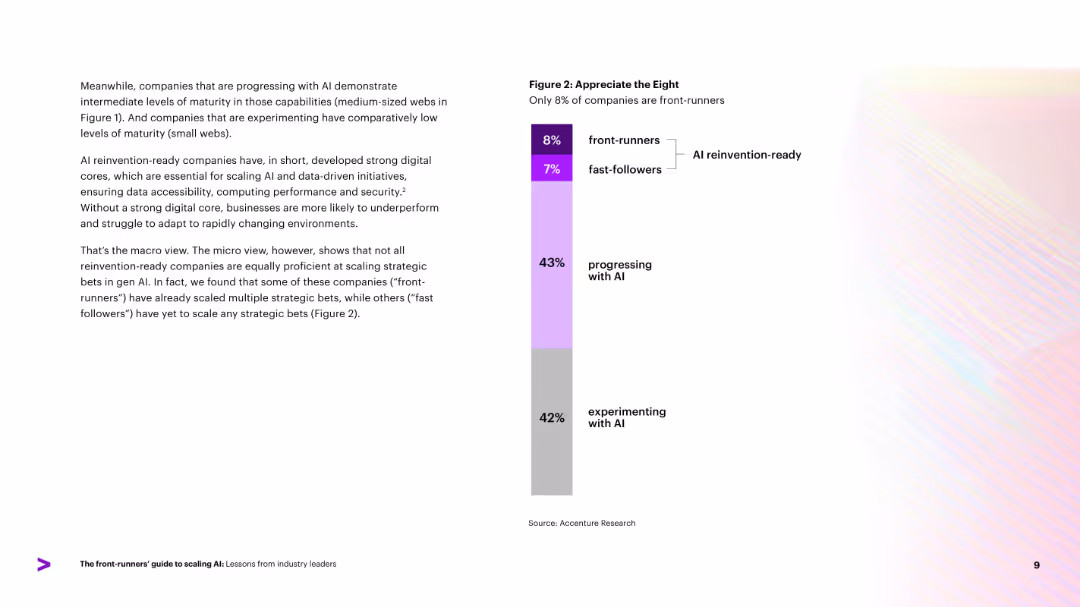
Vertical bar chart categorizing company AI maturity levels: experimenting, progressing, fast-followers, and front-runners. Percentages listed next to each category.
Market Analysis and Trends
Artificial Intelligence
Highlights distribution of AI maturity across surveyed companies, showing that only 8% are front-runners. Notes distinctions between fast-followers and front-runners, with most companies still in early AI phases. Suggests significant room for growth in scaling strategic AI capabilities.
AI maturity, front-runners, adoption stages, market segmentation
false
Market Analysis and Trends
Artificial Intelligence artificial-intelligence
Mixed Chart
Accenture
View slide
The slide presents a column chart comparing AI maturity across different industries in 2021 and 2024. Each industry is represented by a color-coded line, providing a clear visual comparison.
Market Analysis and Trends
Technology & Software
It analyzes AI maturity levels across various industries, showing current standings and future projections. The data helps in understanding which industries are leading in AI adoption.
AI maturity, industry comparison, projections, data analysis, industry trends
false
Market Analysis and Trends
Technology & Software technology-and-software
Mixed Chart
Accenture
Previous
Loading...
Hold On!
We are searching in our database
If nothing, comes up, please try different filters!
Column Chart
Heatmap
Chevron
Org Chart
Infographic
Callouts
Timeline
List
Graphic
Picture
Process Flow
Diagram
Paragraph
Map
Table
Framework
Subtitle
Takeaway Box
Icon
Other Chart
Radar Chart
Waterfall Chart
Mekko Chart
Pie Chart
Scatter Plot
Line Chart
Bar chart
Bullet points
Create a FREE account to continue browsing
Receive Instant Access to 1,000+ slides from companies like McKinsey, Google, and Goldman Sachs
First Name
Last Name
Email
Password
I agree to all
Terms & Privacy Policy
Thank you! Your submission has been received!
Oops! Something went wrong while submitting the form.
Have an account?
Sign in
Upgrade to PRO to Save slides
Advanced Search and Filters
Access to 15,000+ slides
Access to Category Pages
Save/Bookmark Slides
PowerPoint Template Library
Pick a Plan
MONTHLY
$12/month
Billed every month, Cancel anytime.
YEARLY
$9/year
Billed $108 annually, Cancel anytime.
Checkout for $12/month
Checkout for $108/yr
Secured by Stripe | AES-256 bit encryption