e-Conomy SEA 2022 Through the waves, towards a sea of opportunity
Slide type
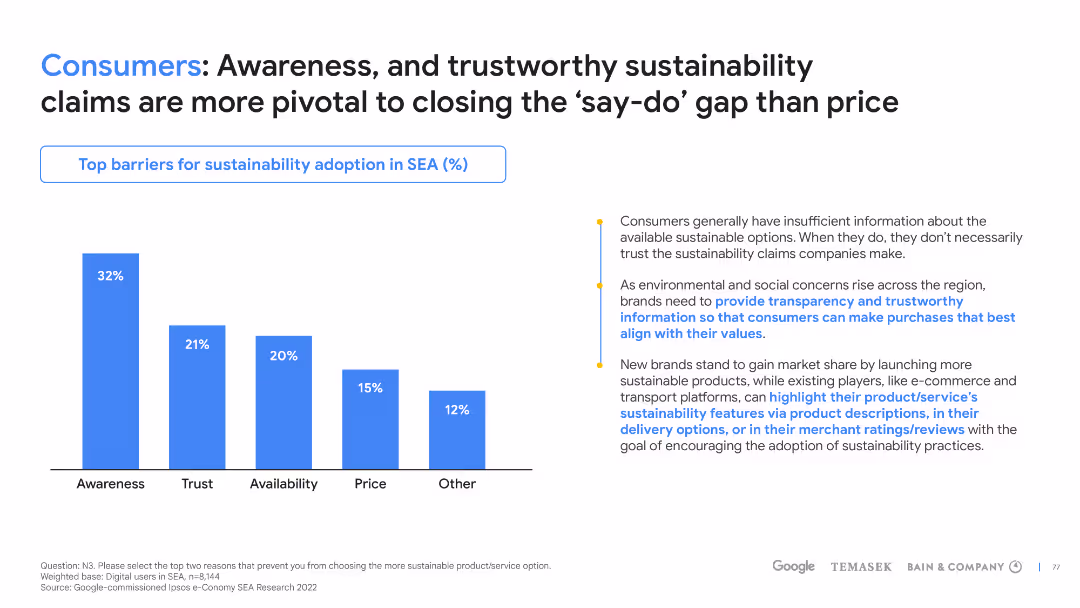
Mixed Chart
Description
A bar graph centers the slide, depicting the primary barriers to sustainability adoption in SEA, with informative text to the right. The graph uses a single color for clarity, and the textual information is well-integrated, making it easy to follow.