If every energy transition is different, which course will accelerate yours?
Slide type
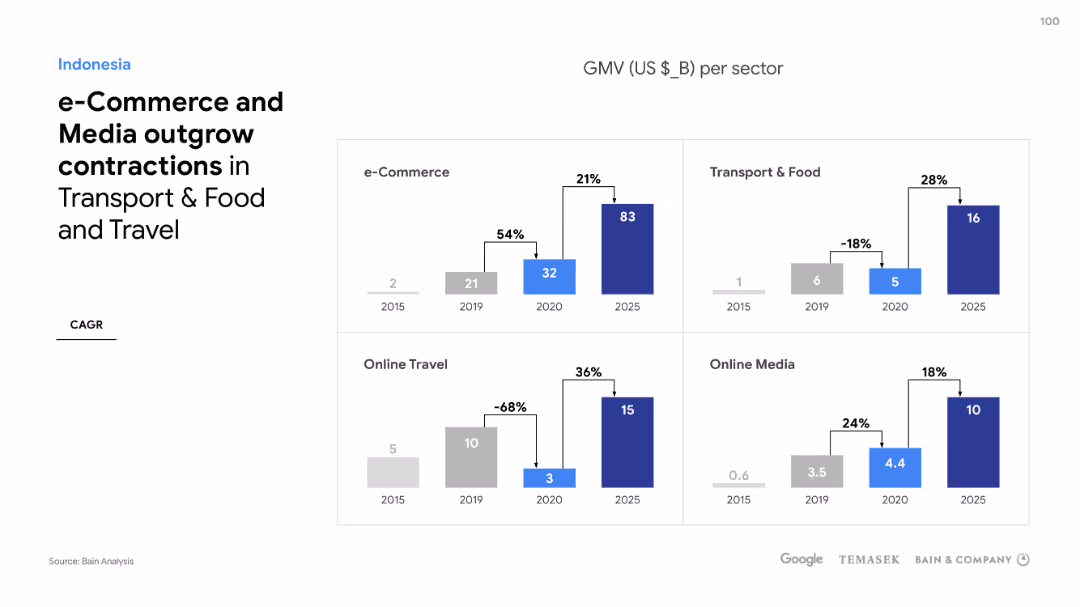
Multiple Chart
Description
The slide features a set of scatter plots comparing technology adoption rates across different regions (US, Europe, China, South Asia, Rest of the World, Global). Each scatter plot displays data for Solar, Wind, Nuclear, Coal, and Gas technologies for the years 2025 and 2050.