The Growing Challenge of Semiconductor Design Leadership
Slide type
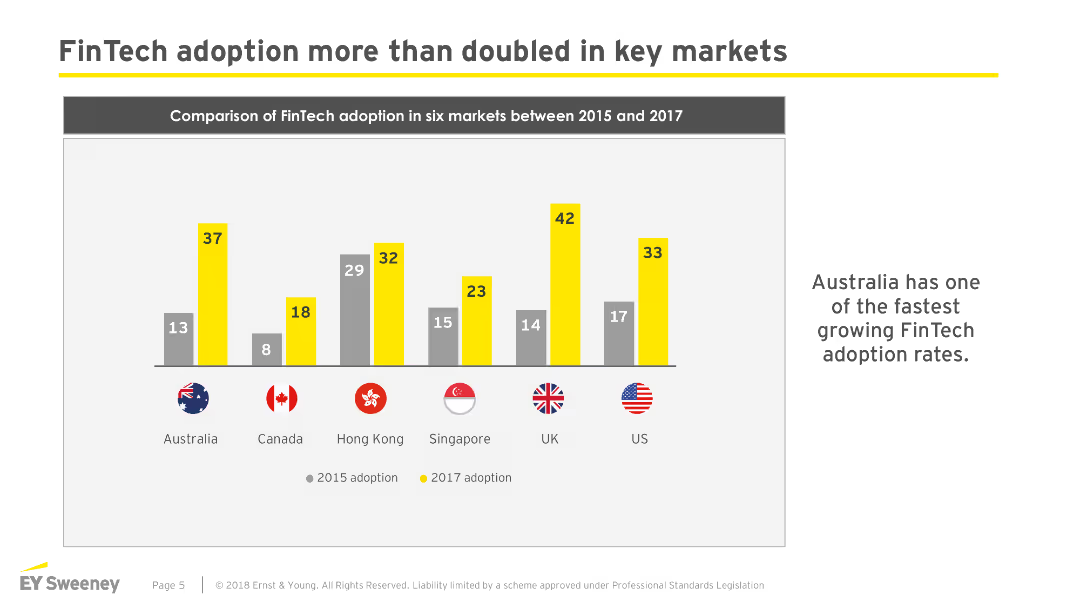
Single Chart
Description
This slide uses a column chart to compare semiconductor demand by region, highlighting the top OEMs in each area. The charts are color-coded to distinguish between regions (e.g., US, China, Europe), and key OEMs like Apple and Samsung are specifically noted. The layout facilitates easy comparison between regions with a clear emphasis on US vs. international demand.