Details
Consumers at 250
Slide type
Single Chart
Description
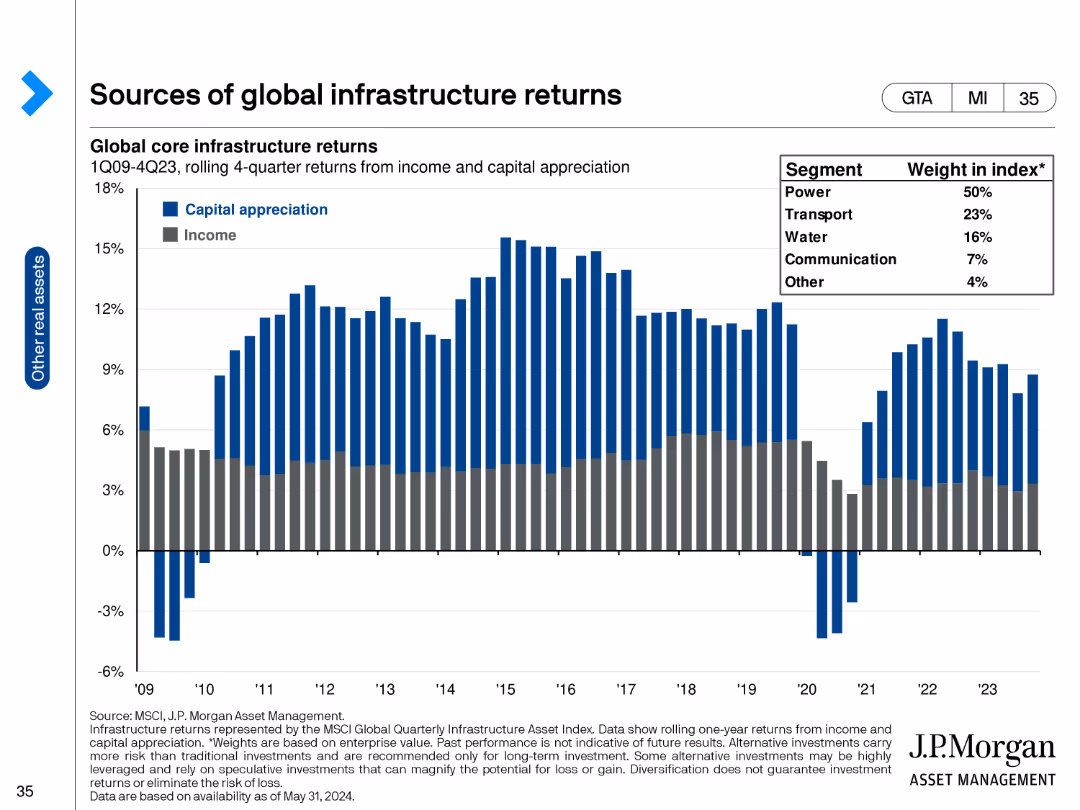
Slide presents a dark theme with a graph and an information box. A bold bar graph depicts survey results with percentages in contrasting colors, accompanied by a summarizing statement. It has a clear visual hierarchy with the graph as the focal point and an inset box for additional data.
Use Case
Regulatory and Compliance
Industry
Retail & E-commerce

Continue browsing similar slides with a FREE account

Receive Instant Access to 8,000+ slides
Thank you! Your submission has been received!
Oops! Something went wrong while submitting the form.
Have an account? Sign in
Single Chart
Slides

Instant access to the internet's best slides

Get access to 40+ advanced filters and more
Advanced Search and Filters
Access to 8,000+ slides
Access to Category Pages
Save/Bookmark Slides
PowerPoint Template Library (Coming Soon)

Choose your plan

Secured by Stripe | AES-256 bit encryption