My Account
My Slides
Search by Category
Templates
View All Templates
Download Template Slides
Leave Feedback
Login
Logout
Get Started
Browse all Slides
Browse all Slides
Create a FREE Account
Instant access to 1,000+ real slides from top companies like McKinsey, BCG, Goldman Sachs, Google and many more!
First Name
Last Name
Email
Password
I agree to all
Terms & Privacy Policy
Thank you! Your submission has been received!
Oops! Something went wrong while submitting the form.
Have an account?
Sign in
Instant access to the internet's best slides
Get access to 40+ advanced filters and more
Advanced Search and Filters
Access to
10,000+ slides
Access to Category Pages
Save/Bookmark Slides
PowerPoint Template Library (New)
Choose your plan
MONTHLY
$12/month
Billed every month, cancel anytime.
YEARLY
$9/month
Billed $108 annually, cancel anytime.
Checkout for $12/month
Checkout for $108/yr
Secured by Stripe | AES-256 bit encryption
Spark Your Next Big Idea with New Presentation Templates
VIEW ALL Templates
Welcome,
Welcome
Upgrade to SlideStart
Pro
Instant access to 15,000+ slides
Show Featured Only
Checkbox 8
Companies
Mckinsey
Bain
BCG
EY
Deloitte
Accenture
PwC/Strategy&
JP Morgan
Goldman Sachs
Morgan Stanley
Citigroup
Deutsche Bank
Barclays
LEK
Kearney
Oliver Wyman
Booz Allen Hamilton
Gartner
IPSOS
Nielsen
Slide type
Header Horizontal
Framework
Vertical Flow
Single Chart
Single Chart
Text Only
Mixed Chart
Header Vertical
Graphic
Pillar
Multiple Chart
Agenda
Title
Table
Linear Flow
Upgrade to SlideStart
Pro
Instant access to 40+ advanced filters
Industry
Upgrade to SlideStart
Pro
Instant access to 40+ advanced filters
Technology
Healthcare
Financial Services
Consumer Goods
Energy & Utilities
Manufacturing
Retail
E-commerce
Logistics
Telecommunications
Real Estate
Professional Services
Education
Media
Entertainment
Hospitatlity
Tourism
Agriculture
Food Production
Government & Public Sector
Environmental
Sustainability
Use Case
Upgrade to SlideStart
Pro
Instant access to 40+ advanced filters
Sales and Business Development
Mergers and Acquisitions
Corporate Finance and Valuation
Performance Metrics and KPIs
Client Case Studies
Competitive Landscape
Product and Service Analysis
Customer and Market Segmentation
Organizational Structure
Human Resources and Talent Management
Industry Overview
Regulatory and Compliance
Risk Assessment and Management
Agriculture & Food Production
Hospitality and Tourism
Government
Environmental
Sustainability
Clear all
Thank you! Your submission has been received!
Oops! Something went wrong while submitting the form.
Show Featured Only
Checkbox 8
Companies
Mckinsey
Bain
BCG
EY
Deloitte
Accenture
PwC/Strategy&
JP Morgan
Goldman Sachs
Morgan Stanley
Citigroup
Deutsche Bank
Barclays
LEK
Kearney
Oliver Wyman
Booz Allen Hamilton
Gartner
IPSOS
Nielsen
Slide type
Text Only
Linear Flow
Vertical Flow
Single Chart
Header Horizontal
Mixed Chart
Header Vertical
Pillar
Multiple Chart
Graphic
Agenda
Title
Table
Framework
Industry
Technology
Healthcare
Financial Services
Consumer Goods
Energy & Utilities
Manufacturing
Retail
E-commerce
Logistics
Telecommunications
Real Estate
Professional Services
Education
Media
Entertainment
Hospitatlity
Tourism
Agriculture
Food Production
Government & Public Sector
Environmental
Sustainability
Use Case
Sales and Business Development
Mergers and Acquisitions
Corporate Finance and Valuation
Performance Metrics and KPIs
Client Case Studies
Competitive Landscape
Product and Service Analysis
Customer and Market Segmentation
Organizational Structure
Human Resources and Talent Management
Industry Overview
Regulatory and Compliance
Risk Assessment and Management
Agriculture & Food Production
Hospitality and Tourism
Government
Environmental
Sustainability
Clear all
Thank you! Your submission has been received!
Oops! Something went wrong while submitting the form.
Tag
View slide
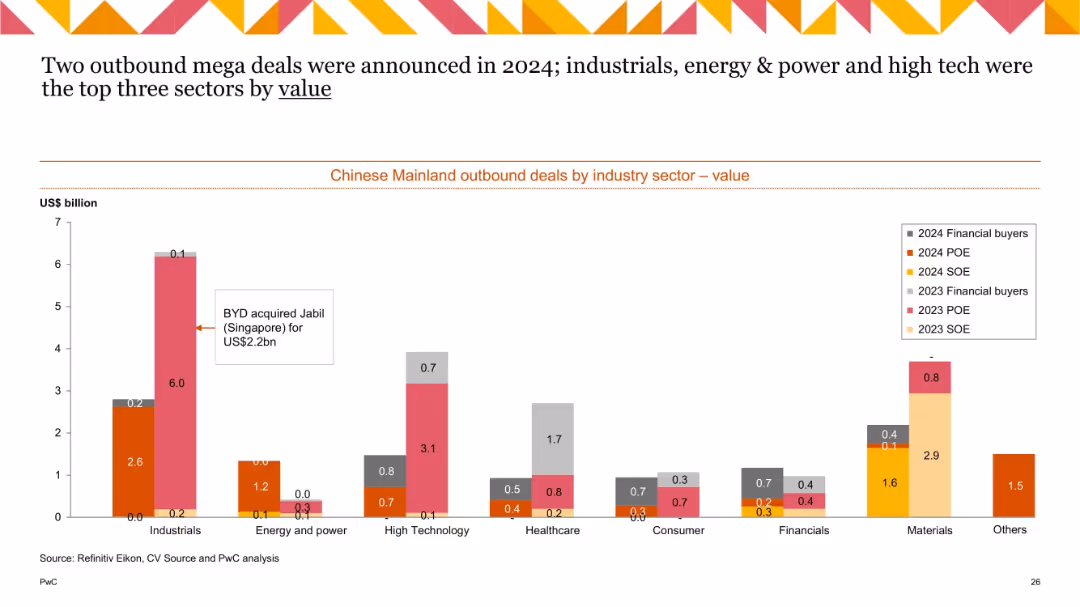
Stacked bar chart (2023 & 2024) showing industry-wise deal values by investor type. Callout highlights BYD acquisition.
Investment Analysis
Industrial & Manufacturing
The slide highlights deal values in outbound Chinese M&A by industry for 2023 and 2024, with a breakdown by investor type. Industrials lead due to a $2.2B mega-deal (BYD acquiring Jabil), followed by Energy & Power and High Technology. POEs and financial buyers are the main contributors in value.
outbound M&A, deal value, BYD acquisition, POE, financial buyer, industrials, high tech, China
false
Two outbound mega deals were announced in 2024China M&A 2024 Review and Outlook
Single Chart
PwC/Strategy&
View slide
Slide uses a comparative layout with text blocks and a central transition arrow.
Strategic Planning
Financial Services
Discusses strategic shifts in UK digital investing and wealth management to enhance market position.
strategy, wealth management, digital investing, market share, UK
false
More balanced: opportunity to scale and develop UK Wealth offeringFY 2023 Results Announcement
Linear Flow
Barclays
View slide
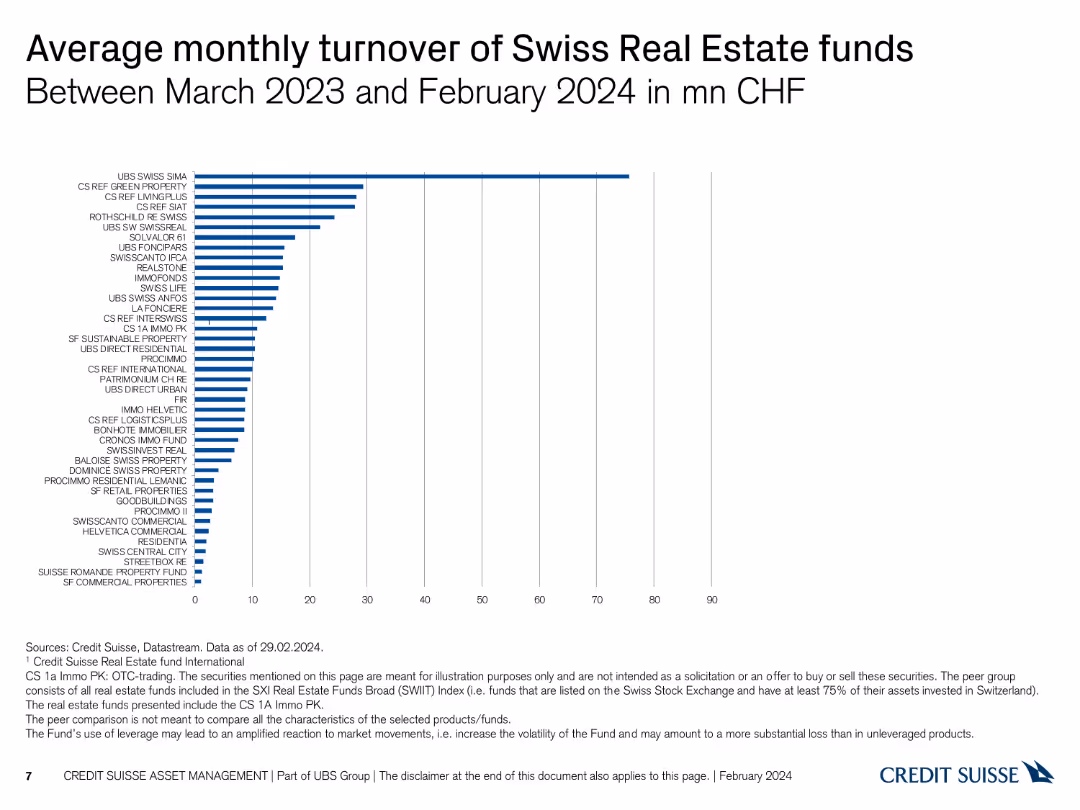
Column chart showing average monthly turnover of various Swiss real estate funds in CHF.
Market Analysis and Trends
Real Estate & Construction
Presents the average monthly turnover of different Swiss real estate funds, measured in CHF, for a one-year period.
real estate, turnover, monthly average, CHF, funds
false
Average monthly turnover of Swiss Real Estate funds Between March 2023 and February 2024 in mn CHFSwiss Real Estate Funds At a glance
Single Chart
Credit Suisse
View slide
This slide features a pie chart showing the impact of inflation on marketing spending across three categories: no impact, increasing, and decreasing levels. The chart uses color differentiation to highlight these categories clearly.
Market Analysis and Trends
Professional Services
The slide explores the impact of inflation on marketing budgets, detailing how different sectors are either cutting back or increasing their spend in response to economic pressures. This can aid in strategic planning and budget allocation during inflationary periods.
Inflation, Marketing Spending, Economic Impact, Budget Planning, Strategy
false
How inflation is influencing marketing spendingThe CMO Survey Marketing in a Post Covid Era
Single Chart
Deloitte
View slide
The slide includes a stacked column chart displaying unlinked bus and rail rides annually, with distinct colors for each mode of transport and a trend line indicating changes.
Industry Overview
Transportation & Logistics
Presents data on declining ridership in public transportation, identifying trends and potential areas for operational improvements to enhance service efficiency.
public transportation, ridership decline, operational efficiency, data analysis
false
Continuously rewarding the shareholder (dividend inDEUTSCHE BANK 2018 A very dynamic 1st quarter
Multiple Chart
Deutsche Bank
View slide
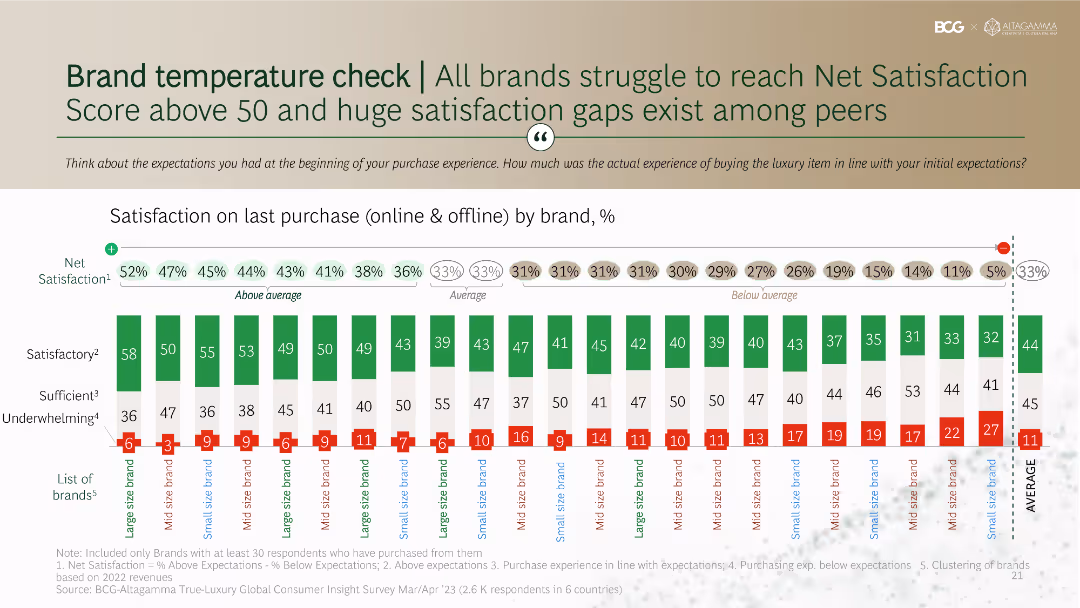
The slide is divided into two sections, comparing satisfaction between offline and online experiences. The left side shows offline satisfaction at 100, and the right side shows online satisfaction at 125.
Customer and Market Segmentation
Consumer Goods
Compares satisfaction levels of luxury brands' offline experiences to their online counterparts, indicating higher satisfaction with online services.
Satisfaction, online, offline, luxury, comparison
false
Brand temperature check | All brands struggle to reach Net Satisfaction Score above 50 and huge satisfaction gaps exist among peersTrue-Luxury Global Consumer Insights 9th Edition
Single Chart
BCG
View slide
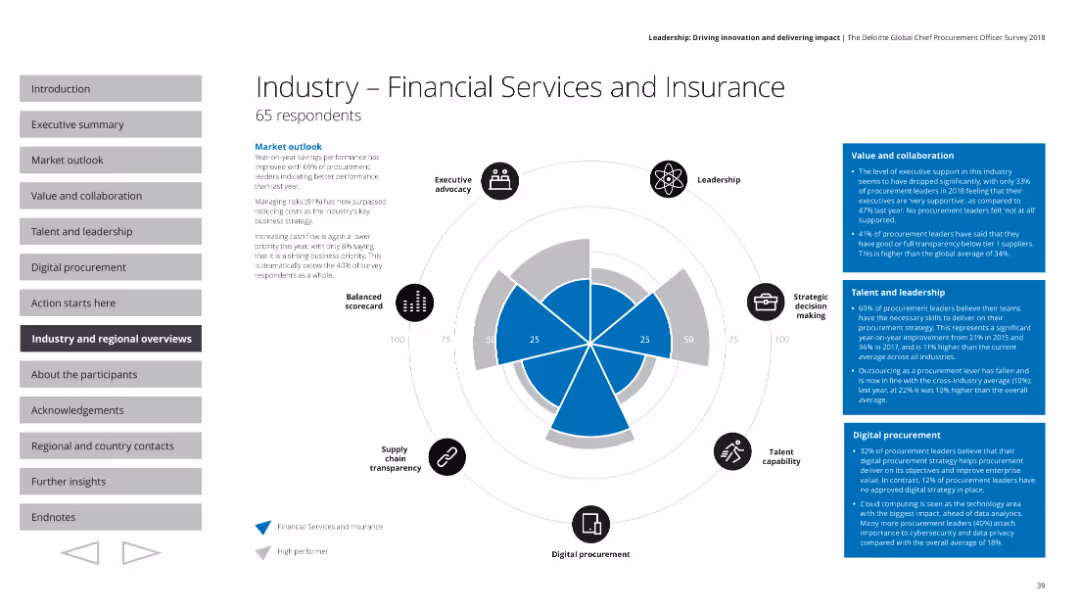
The slide contains a radar chart comparing various performance indicators. It includes small icons around the chart, text boxes with details, and a section header.
Industry Overview
Financial Services
This slide presents an overview of the financial services and insurance industry's performance based on a survey. Key aspects such as executive advocacy, leadership, strategic decision making, talent capability, digital procurement, and supply chain transparency are highlighted. It includes market outlook and specific metrics on value, collaboration, talent, and leadership.
Financial services, insurance, industry overview, radar chart, market outlook
false
Industry - Financial Services and InsuranceLeadership: Driving innovation and delivering impact The Deloitte Global Chief Procurement Officer Survey 2018
Mixed Chart
Deloitte
View slide
The slide shows a horizontal bar chart with survey results on globalization and global citizenship feelings across different countries.
Market Analysis and Trends
Technology & Software
The slide highlights global survey results indicating people's positive attitudes towards globalization and global citizenship.
Globalization, global citizenship, survey, public opinion, international trends
false
People around the world feel they are part of a greater wholeA NEW WORLD DISORDER?
Mixed Chart
IPSOS
View slide
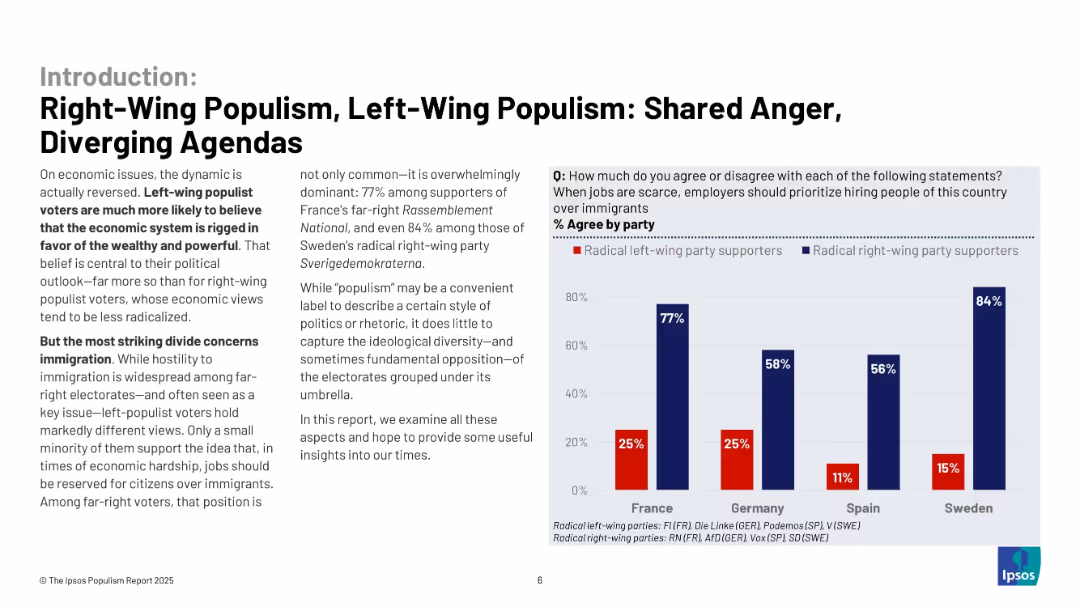
Text with bar chart comparing views on prioritizing native citizens for jobs during economic hardship, split by political ideology and country.
Customer and Market Segmentation
Government & Public Sector
This slide explores populist opinions on immigration and economic protectionism. Radical right-wing supporters favor native job prioritization, while left-wing populists largely oppose such measures, indicating a major ideological divide.
immigration, populism, economic hardship, nationalism, party politics
false
Right-Wing Populism, Left-Wing Populism (Chart 2)THE IPSOS POPULISM REPORT 2025
Mixed Chart
IPSOS
View slide
The slide presents multiple column charts, tables, and bullet points, using a green and yellow color scheme to highlight key figures and changes from 2020.
Market Analysis and Trends
Financial Services
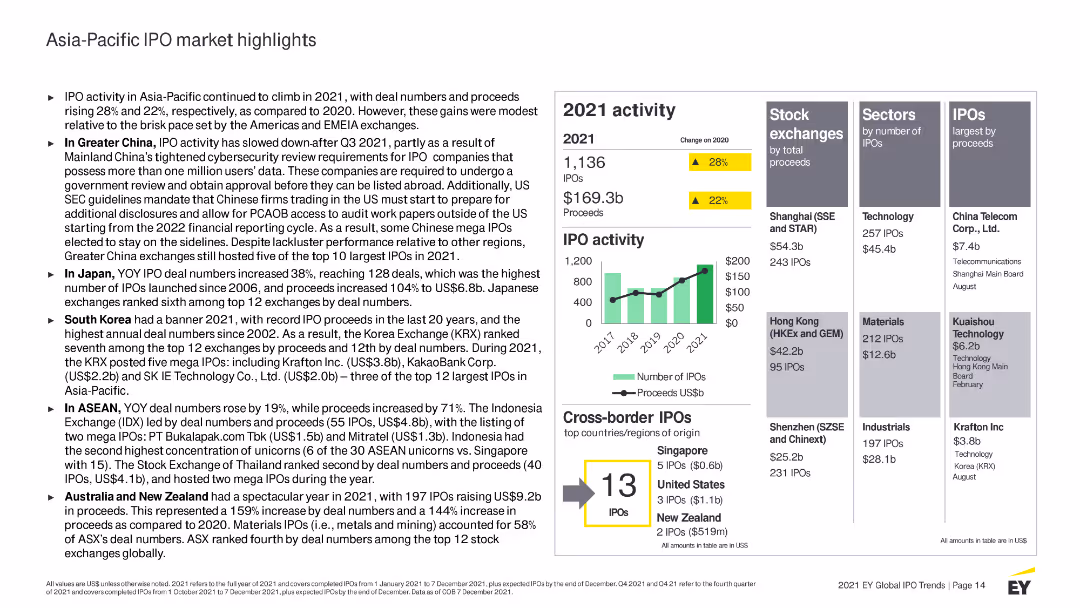
Analyzes IPO activities in the Asia-Pacific region for 2021, detailing performance in different countries and sectors, as well as the top exchanges by proceeds.
Asia-Pacific, IPO, 2021 activity, market highlights, stock exchanges, sectors, proceeds, cross-border IPOs, China, Japan
false
Asia-Pacific IPO market highlights IPO activity in Asia-Pacific continued to climb in 2021Are your growth strategies resilient enough for the future?
Mixed Chart
EY
View slide
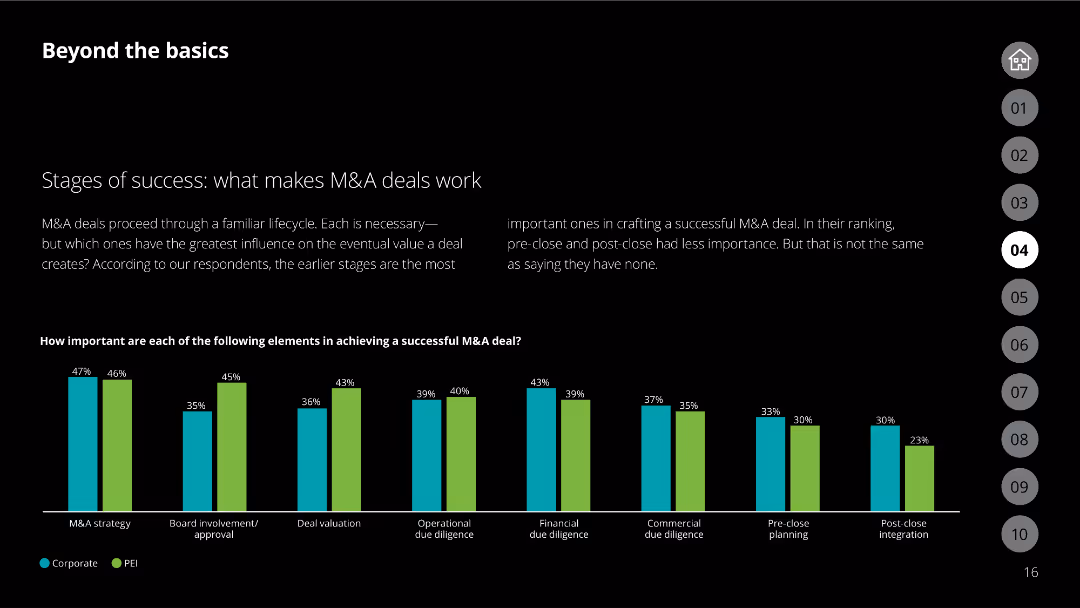
The slide features a column chart comparing corporate and PEI views on the importance of various M&A stages.
Mergers and Acquisitions
Financial Services
Discusses the stages of M&A deals and their influence on the success of these deals according to respondents.
M&A stages, corporate, PEI, deal success, stages importance
false
Stages of success: what makes M&A deals workThe future of M&A 2022 M&A Trends Survey
Single Chart
Deloitte
View slide
Multiple small column charts showing monthly PMI data for several countries, indicating levels of manufacturing activity with color coding for various performance levels.
Market Analysis and Trends
Financial Services
Tracks the recovery in global manufacturing post-pandemic through Purchasing Managers' Index (PMI) data, detailing the ups and downs across different nations.
manufacturing, PMI, recovery, global, countries
false
Manufacturing PMI recovery globally indicates positive momentumCOVID-19 BCG Perspectives State of the World
Multiple Chart
BCG
View slide
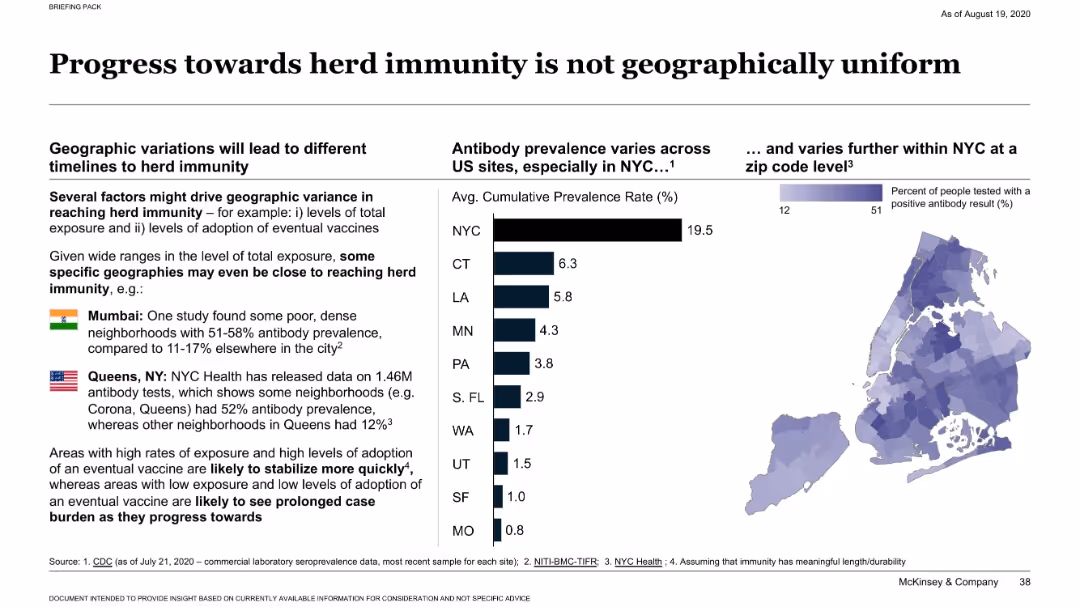
Dual layout with bar graph of antibody prevalence across U.S. states and a heatmap of NYC ZIP code data; includes callouts for Mumbai and Queens.
Market Analysis and Trends
Healthcare & Pharmaceuticals
Demonstrates wide geographic variation in antibody prevalence across U.S. cities and globally. Highlights that some dense areas (like Queens and Mumbai) have much higher rates, suggesting uneven progress toward herd immunity based on exposure and vaccine adoption.
herd immunity, antibody prevalence, NYC, Mumbai, geographic variation
false
Progress towards herd immunity is not geographically uniformCOVID-19: Briefing materials
Multiple Chart
McKinsey
View slide
Includes a world map with trade corridors and a list of cross-border needs with accompanying icons. Blue and grey color scheme.
Financial Performance
Financial Services
Analyzes the globalization of financial services, showing trade corridors and cross-border market opportunities along with services like payments and foreign exchange.
Globalization, Trade, Financial Services, Market Opportunities, Cross-Border
false
Large, cross-border market opportunityInverstors Day 2023
Diagram
JP Morgan
View slide
Includes column charts showing past revenue trends and projections, with a breakdown by geographic regions, utilizing a blue and grey color scheme.
Financial Performance
Financial Services
Analyzes the return to revenue growth, contrasting flat past trends with recent growth, broken down by U.S., Asia, and Mexico market contributions.
Revenue Growth, Projections, Trends, Geographic Segmentation, Business Investments
false
Resulting in a Return to Revenue GrowthGlobal Consumer Banking
Multiple Chart
Citigroup
View slide
Three-block layout of system-level solutions (bioeconomy, grid, EV ecosystem), with icons indicating priority and feasibility; color-coded impact indicators below.
Product and Service Analysis
Environmental Services & Sustainability
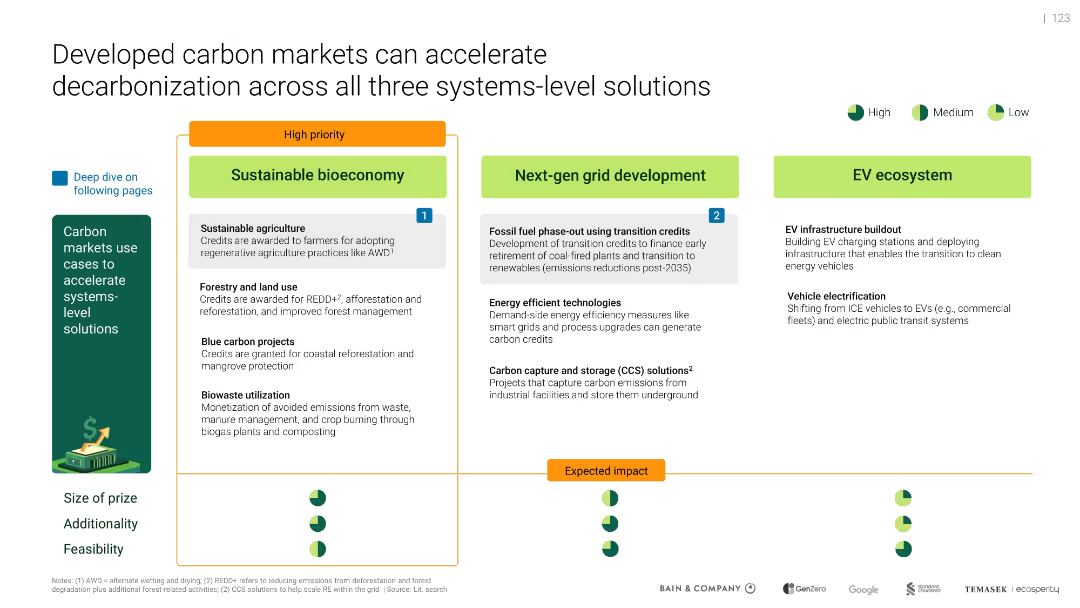
Highlights how carbon markets support systemic decarbonization. Prioritizes sustainable bioeconomy (agriculture, forestry), next-gen grid (CCS, phase-out), and EV infrastructure. Rates each for feasibility and impact.
carbon markets, decarbonization, bioeconomy, CCS, EV, grid
false
Developed carbon markets can accelerate decarbonization across all three systems-level solutionsSoutheast Asia's Green Economy
Mixed Chart
Bain
View slide
A vertical stacked bar chart compares available capital (T2, AT1, CET1) against regulatory requirements. A clear side-by-side layout with consistent color codes for capital types. Key highlights are listed on the right.
Regulatory and Compliance
Financial Services
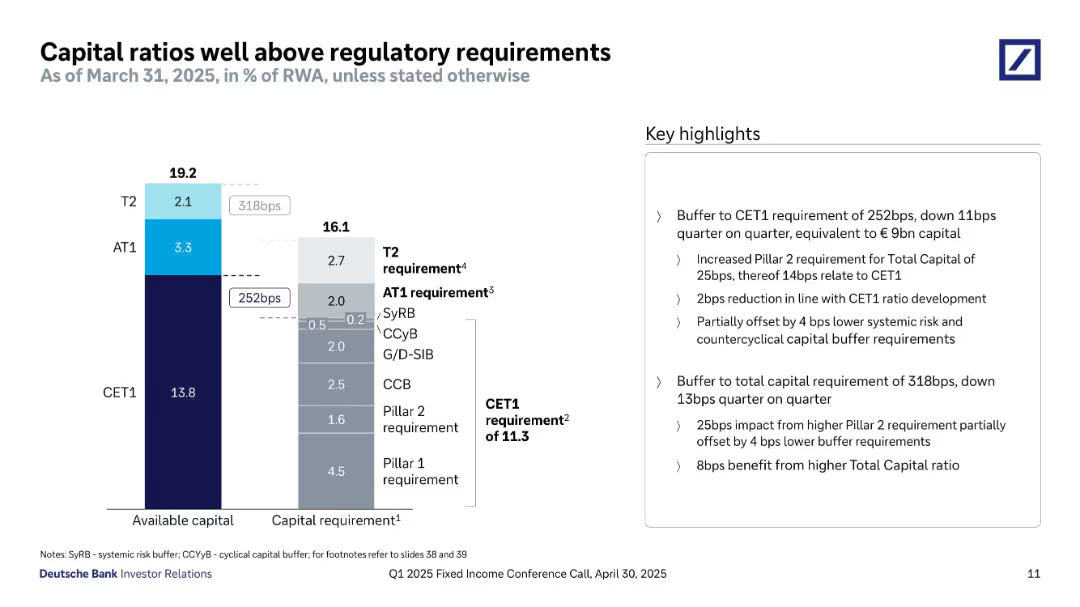
This slide shows Deutsche Bank’s capital ratios are significantly above minimum regulatory requirements. The CET1 ratio has a 252bps buffer, while total capital has a 318bps buffer. The slide also breaks down regulatory minimums including Pillar 1 and 2, G-SIB, and countercyclical buffers. Highlights explain drivers of changes in buffer sizes and the impact of increased Pillar 2 requirements and changes in systemic buffer levels.
CET1, capital buffer, regulatory requirements, AT1, T2, Pillar 1, Pillar 2, G-SIB, capital adequacy
false
Capital ratios well above regulatory requirementsQ1 2025 Fixed Income Investor Conference Call
Mixed Chart
Deutsche Bank
View slide
The slide displays column charts for multiple countries, comparing the change in new car purchase intent.
Market Analysis and Trends
Transportation & Logistics
Discusses the varying degrees of recovery in new car purchase intent across different markets during the pandemic.
car market, international, purchase intent, recovery trends
false
New car purchase intent ~-25% vs. pre-COVID-19 in US, UK, IT; markets except IT recovering; CN stable close to pre-COVID-19COVID-19 Auto & Mobility Consumer Insights
Multiple Chart
McKinsey
View slide
The slide features a column chart comparing bioenergy potential versus world energy demand for the year 2060. It uses varying shades of purple to represent different stages of bioenergy potential: theoretical, technical, and sustainable.
Strategic Planning
Energy & Utilities
This slide discusses the potential contribution of bioenergy to meet the world energy demand by 2060, emphasizing the need for focused allocation of biomass to decarbonize sectors with no other renewable options.
bioenergy, world energy demand, 2060, theoretical potential, technical potential, sustainable potential, decarbonize, renewable
false
Bioenergy potential vs. world energy demand1Developing sustainable carbon circularity Looking at advanced applications and business models
Single Chart
Kearney
View slide
The slide has a dual-axis line chart showing the University of Michigan survey inflation expectations for one-year ahead (in blue) and five to ten years ahead (in orange) from 2012 to 2022. The chart exhibits upward trends, especially in the one-year ahead predictions.
Market Analysis and Trends
Financial Services
This slide depicts the short-term and medium-term inflation expectations based on survey data, useful for discussing consumer sentiment, economic outlook, and monetary policy considerations. It highlights the importance of inflation expectations in economic forecasting and strategy formulation.
Inflation Expectations, Survey Data, Economic Forecasting, Short-term, Medium-term, Consumer Sentiment, Michigan Survey
false
Survey measures of inflation rise for the near term…Inflation: transitory or persistent?
Single Chart
JP Morgan
View slide
Features a heat map table categorizing various asset classes and their respective returns over the years, color-coded to indicate performance levels.
Investment Analysis
Financial Services
The slide breaks down historical returns by asset class, serving as a tool for retrospective analysis and guiding future investment decisions based on past performance.
asset class, return analysis, heat map, historical data, investment, performance
false
Asset Class Return Analysis (%)Monthly Market Monitor November 2023
Table
Morgan Stanley
View slide
Similar to slide 1631, this one is structured with column charts, bar graphs, and a pie chart, showcasing media usage and service adoption rates in Thailand. It uses a color palette of blue and grey, with green highlighting the pie chart for emphasis.
Market Analysis and Trends
Technology & Software
This slide is a comparative analysis of digital consumer behavior in Thailand, detailing usage intent and media consumption. It reveals the adoption rates of digital services and the willingness to pay more for sustainable products and services, vital for understanding consumer priorities and market opportunities in Thailand.
digital consumers, Thailand, media usage, adoption rates, sustainability
false
Thailand: Digital consumers in numberse-Conomy SEA 2022 Through the waves, towards a sea of opportunity
Multiple Chart
Bain
View slide
This slide presents column charts showing the growth of gaming revenues in Hong Kong and Singapore from 2020 to 2025, differentiating between traditional and social/casual gaming with red and grey bars. The slide layout is clear with annotations explaining shifts due to the pandemic.
Market Analysis and Trends
Media & Entertainment
Discusses the shifting dynamics of the gaming industry in Hong Kong and Singapore between 2020 and 2025, highlighting how pandemic-related changes affected traditional and social/casual gaming revenues. It points out Singapore's rise as a gaming hub due to policy support.
gaming industry, Hong Kong, Singapore, revenue trends, pandemic impact
false
Hong Kong is losing its advantage as a distribution centre for traditional games due to the pandemicGlobal & Entertainment Media Outlook 2021-2025: Hong Kong summary
Multiple Chart
PwC/Strategy&
View slide
Features two major logos at the top, three columns with text and graphics representing global locations, transactions, and contact information.
Client Case Studies
Professional Services
Highlights a consultancy's global reach and expertise in automation, with emphasis on M&A advisory services.
Global Network, Automation, Expertise, M&A Advisory, Consulting, Global Reach
false
We span a global network of experts and look forward to connecting with you to share our experience in the automation sectorProcess Automation: A quickly growing market with structural tailwinds and investment opportunities
Uncategorized
LEK
View slide
This slide features a complex line graph tracing global CO2 emissions against time, with annotations indicating various future scenario projections. It uses shades of blue and red to distinguish the trajectories, with additional text boxes for context.
Industry Overview
Environmental Services & Sustainability
The slide provides an outlook on global CO2 emissions, juxtaposing historical data with projections based on different scenarios. It discusses the implications of current commitments on global warming and the disparities in achieving a 1.5°C pathway.
CO2 Emissions, Global Trends, Net-Zero, Climate Change, Scenarios, Historical Data, 2050 Outlook, 1.5°C Pathway
true
Global emissions remain far from a 1.5º pathway, even if all countries deliver on their current commitmentsGlobal Energy Perspective 2022
Mixed Chart
McKinsey
View slide
Two column charts comparing developed and emerging market local interest rates (1 year) with current and 1-year prior rates. Bars are vertical.
Market Analysis and Trends
Financial Services
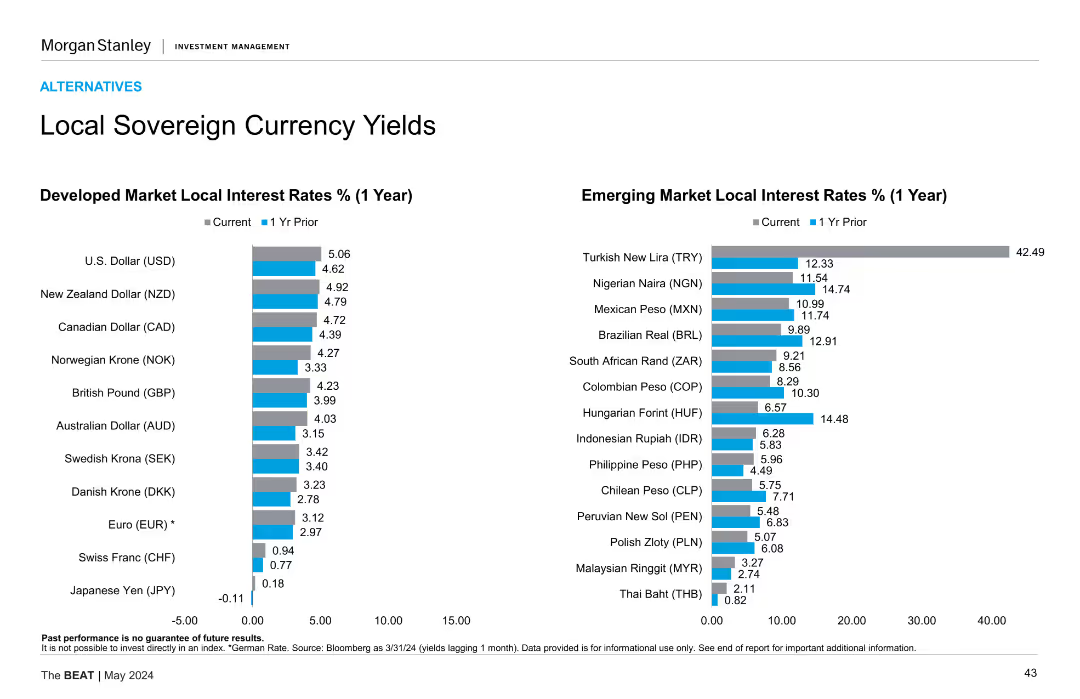
Compares local interest rates for developed and emerging markets. Developed markets include USD, NZD, CAD, etc., while emerging markets include TRY, NGN, MXN, etc.
Interest rates, local currency, market
false
Local Sovereign Currency Yields Developed Market Local Interest Rates % (1 Year) Emerging Market Local Interest Rates % (1 Year)The BEAT May 2024
Multiple Chart
Morgan Stanley
View slide
The slide uses a combination of text and a table to discuss the proposed EU carbon border tax. Icons and figures highlight the potential tax impacts on various commodities.
Regulatory and Compliance
Environmental Services & Sustainability
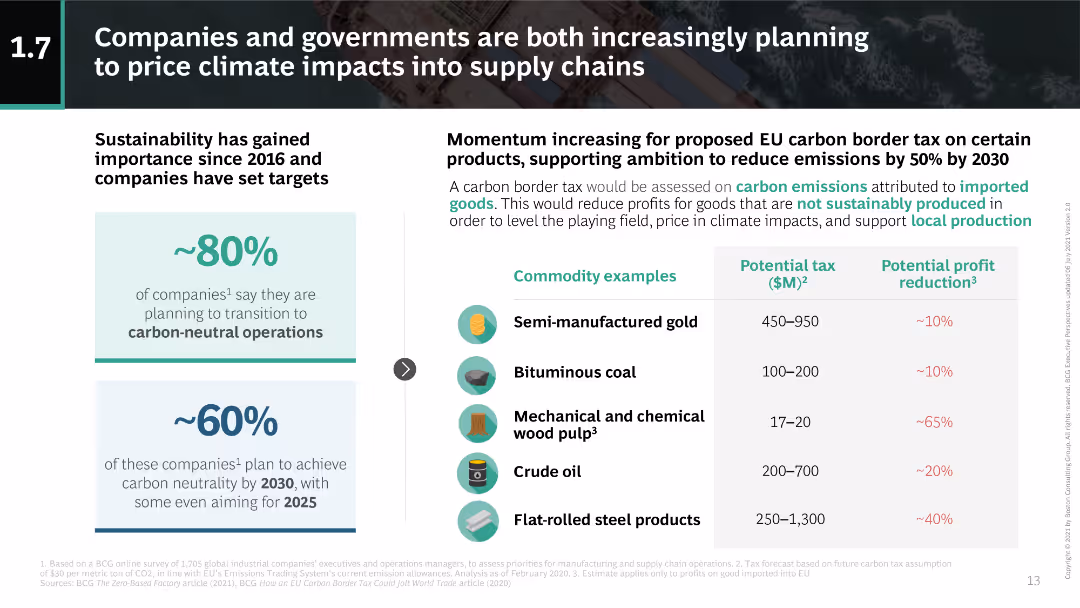
The slide explains the EU carbon border tax proposal, its expected impact on commodity prices, and how companies plan to achieve carbon neutrality by 2030.
carbon tax, EU, sustainability, commodities, carbon neutrality
false
Companies and governments are both increasingly planning to price climate impacts into supply chainsAchieving Supply Chain Resilience in a Volatile World
Header Horizontal
BCG
View slide
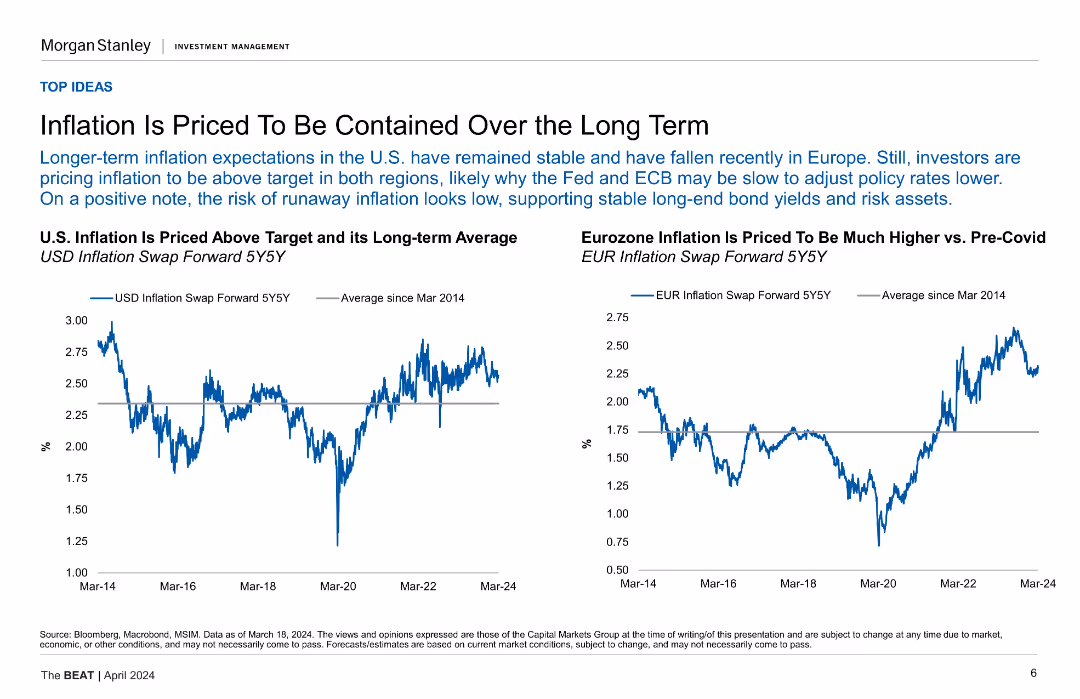
Two line charts comparing U.S. and Eurozone inflation against their long-term averages.
Market Analysis and Trends
Financial Services
This slide analyzes the long-term expectations for inflation in the U.S. and Eurozone, suggesting that inflation will remain stable and above target in both regions.
Inflation, U.S., Eurozone, Long-Term, Comparison, Containment
false
Inflation Is Priced To Be Contained Over the Long TermThe BEAT April 2024
Multiple Chart
Morgan Stanley
View slide
This slide is divided into two halves, one showing a column chart of healthcare expenditures, and the other showing pharmaceutical forecasts in column charts.
Financial Performance
Healthcare & Pharmaceuticals
Covers healthcare expenditures and pharmaceutical sales and exports, projecting growth and providing market insights for the Philippines.
healthcare, pharmaceuticals, expenditures, forecast, growth
false
03 Sectors in focusDoing business in the Philippines 2021
Multiple Chart
Deloitte
View slide
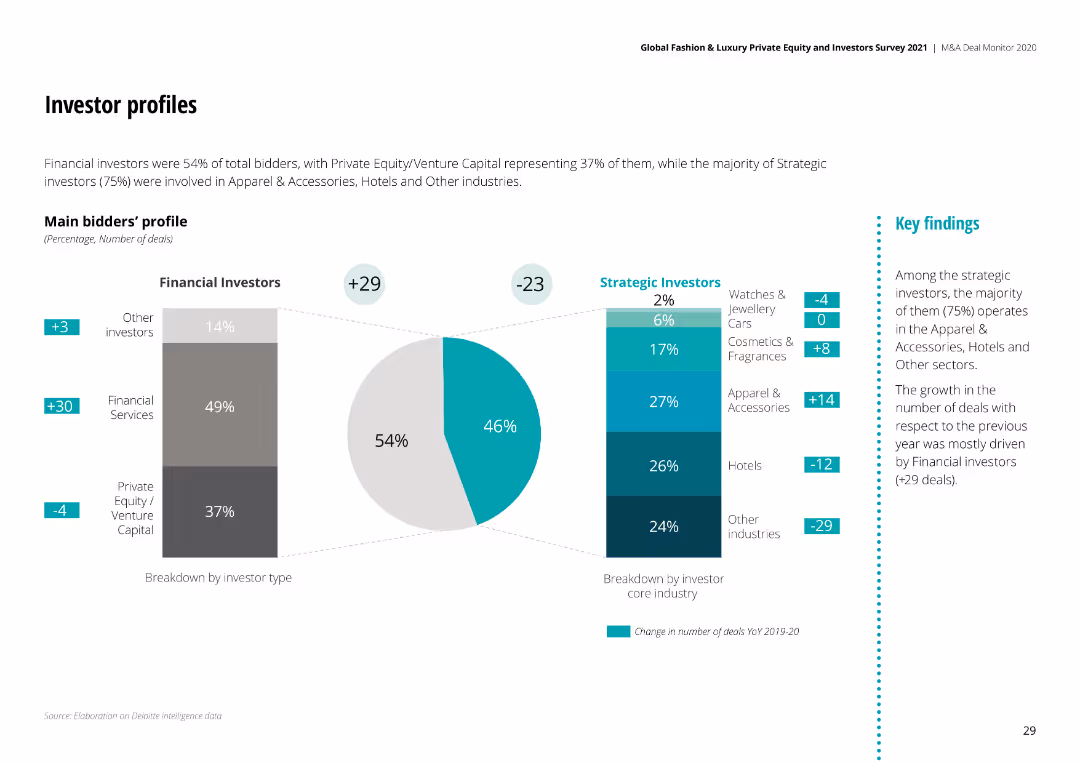
The slide contains pie charts and a bar chart showing the profiles of financial and strategic investors in M&A deals, with changes from 2019-2020.
Investment Analysis
Consumer Goods
It profiles investors in M&A deals, distinguishing between financial and strategic investors, and highlights changes in their involvement.
Investor Profiles, Financial, Strategic, M&A, 2020
false
Investor profiles Financial investors were 54% of total bidders, with Private Equity/Venture Capital representing 37% of them, while the majority of Strategic investors (75%) were involved in Apparel & Accessories, Hotels and Other industries.Global Fashion & Luxury Private Equity and Investors Survey 2021
Multiple Chart
Deloitte
View slide
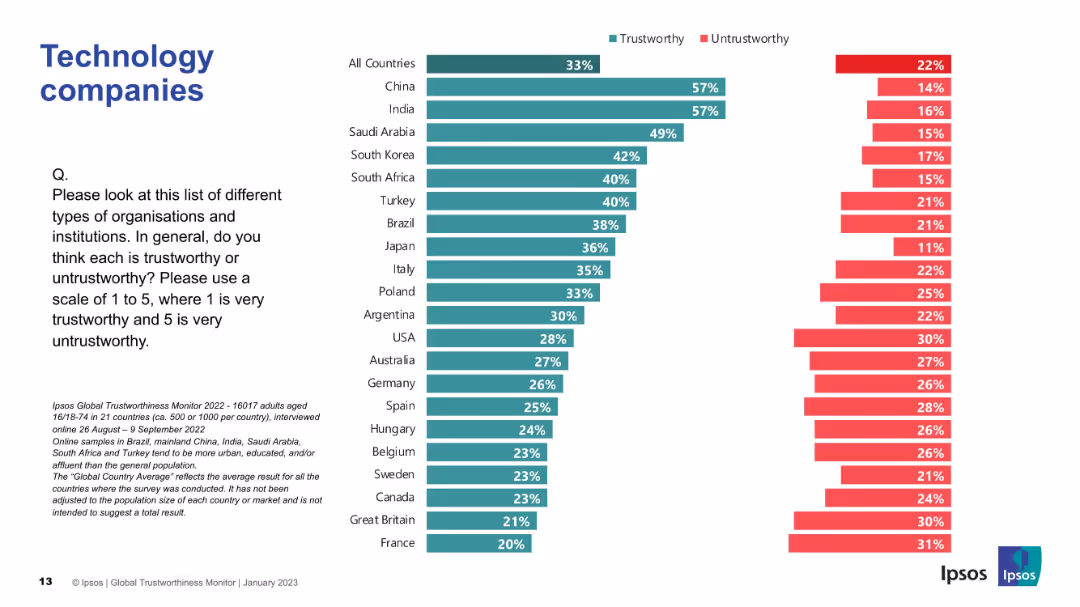
Bar graph with trust/untrust bars by country; consistent color scheme and layout as prior slides.
Market Analysis and Trends
Technology & Software
The chart ranks public trust in tech companies by country. China and India lead with highest trust ratings; France and Great Britain rank low.
technology, public trust, global survey, Ipsos, companies, perception, trustworthy, untrustworthy, country ranking
false
Technology companiesIPSOS GLOBAL TRUSTWORTHINESS MONITOR January 2023
Mixed Chart
IPSOS
View slide
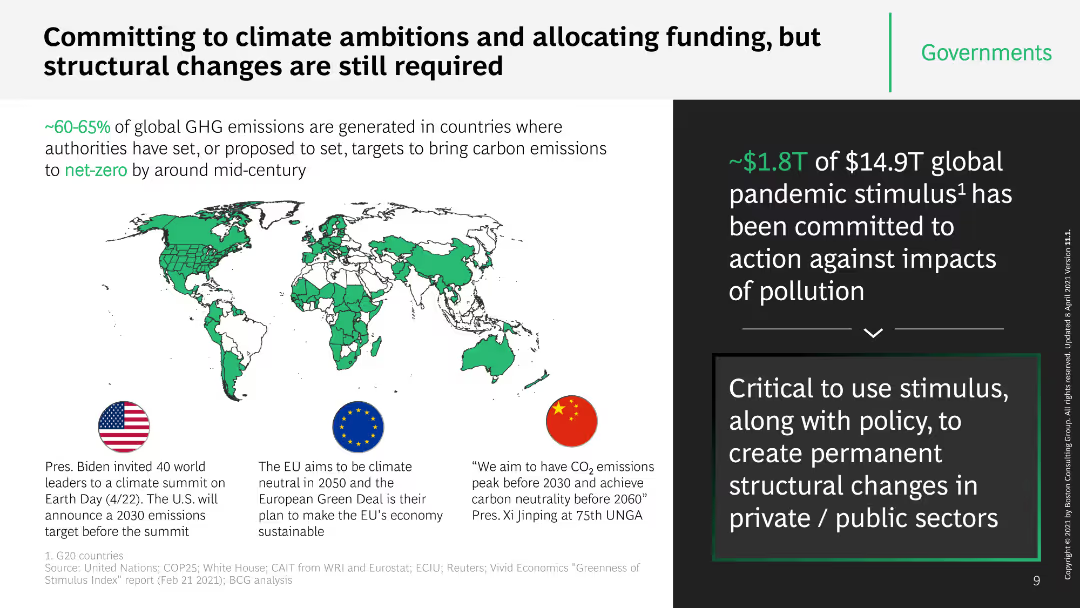
This slide features a world map highlighting countries with climate ambitions, alongside key statistics and text boxes with information on funding commitments. It uses icons and a structured layout to separate different pieces of information.
Strategic Planning
Government & Public Sector
The slide discusses global efforts and commitments to climate ambitions, emphasizing the importance of structural changes and funding allocations. It includes specific examples from the US, EU, and China, and mentions the $1.8T pandemic stimulus.
climate ambitions, funding, global efforts, structural changes, stimulus
false
Committing to climate ambitions and allocating funding, but structural changes are still requiredThe time for climate action is now
Boxed
BCG
View slide
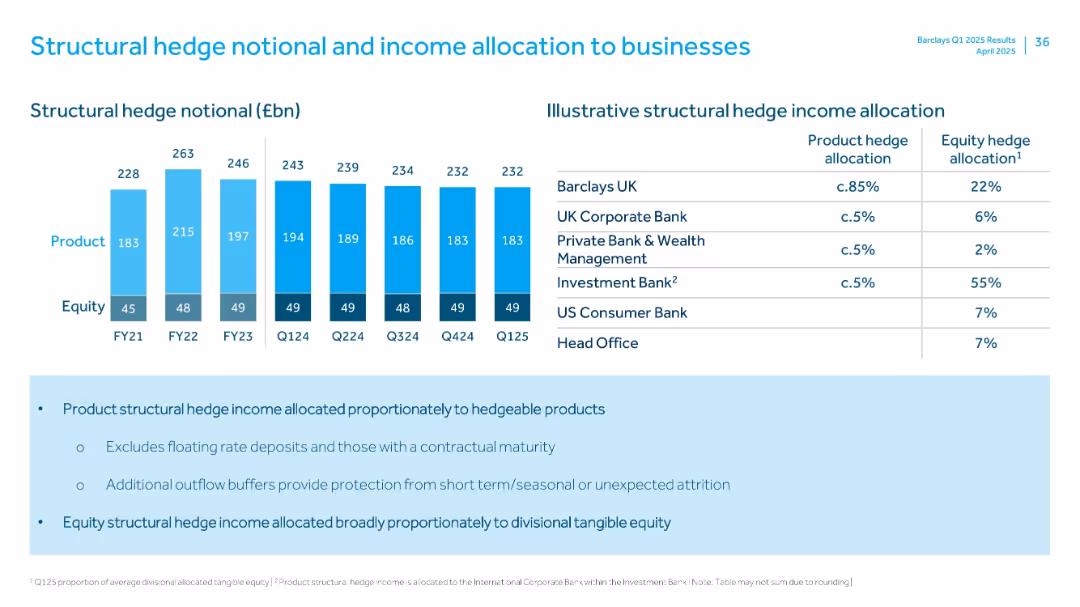
Bar chart (left) with hedge notional over time and a table (right) with income allocation across divisions
Risk Assessment and Management
Financial Services
Breaks down structural hedge notional into product and equity components and outlines income allocation to business units, emphasizing proportional distribution based on hedgeability and tangible equity.
structural hedge, income, allocation, equity, product
false
Structural hedge notional and income allocation to businessesQ1 2025 Results Presentation
Mixed Chart
Barclays
View slide
Features multiple pie charts with accompanying descriptive text. Uses green and gray color scheme.
Regulatory and Compliance
Environmental Services & Sustainability
Details the pressure from various stakeholder groups on companies to act on climate change.
Stakeholders, pressure, climate change, company actions
false
Companies feel broad pressure from stakeholder groupsDeloitte 2023 CxO Sustainability Report
Multiple Chart
Deloitte
View slide
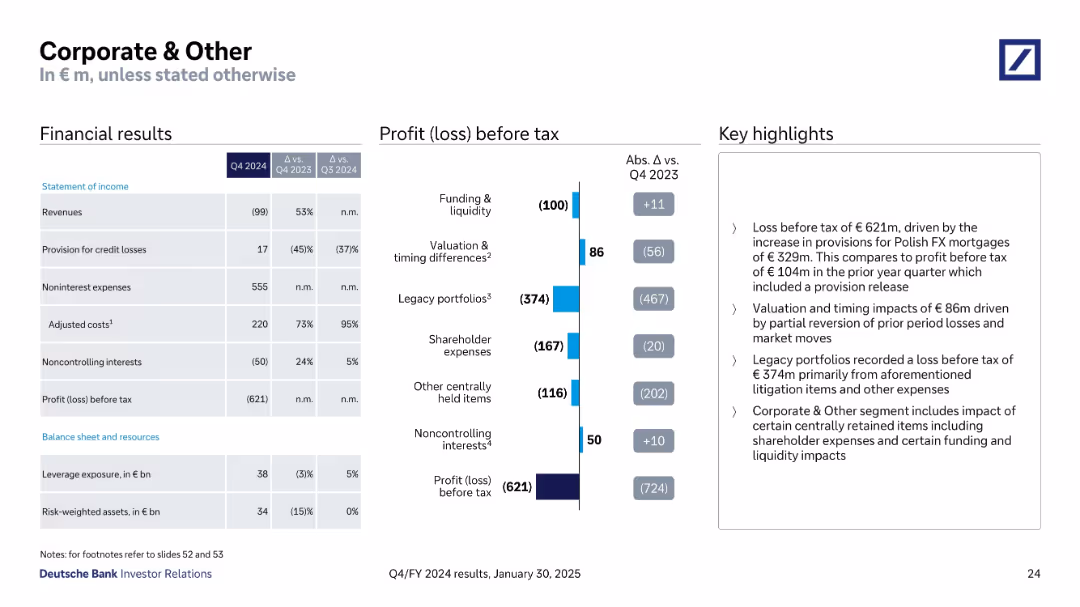
Split view with financial summary, waterfall-style loss breakdown, and concise highlight bullets
Financial Performance
Financial Services
This slide reports a loss before tax of €621m for the Corporate & Other segment, attributed mainly to increased provisions for Polish FX mortgages and legacy portfolio impacts. It also highlights valuation/timing differences and shareholder-related expenses.
Loss, Provisions, Legacy Portfolios, FX Mortgages, Shareholder Expenses
false
Corporate & OtherQ4/FY 2024 results
Mixed Chart
Deutsche Bank
View slide
Slide with multiple 3D column charts showing capital deployment over fiscal years and the number of acquisitions.
Mergers and Acquisitions
Technology & Software
Analyzes Accenture’s strategic investments in acquisitions, highlighting the capital deployed and the increased number of acquisitions to enhance capabilities.
acquisitions, investments, skills, capital deployment, strategic growth, Accenture, capabilities, fiscal year, enhancement
false
Stepping up our Investments in acquisitions to add skills and capabilities aligned to ourstrategic growth prioritiesAccenture Investor & Analyst Conference
Mixed Chart
Accenture
View slide
Contains multiple column charts showing the scaling intensity of digital proofs of concept across various business areas in the automotive industry.
Technology and Digital Transformation
Transportation & Logistics
Details how automotive OEM suppliers are implementing digital strategies across different business functions like production, supply chain, and security, showing their comparative scaling efforts.
automotive, digital transformation, scaling, operations, supply chain
false
AUTOMOTIVE – OES COMPANIES ARE SCALING DIGITAL POCsACROSS BUSINESS FUNCTIONSAUTOMOTIVE –OES
Single Chart
Accenture
View slide
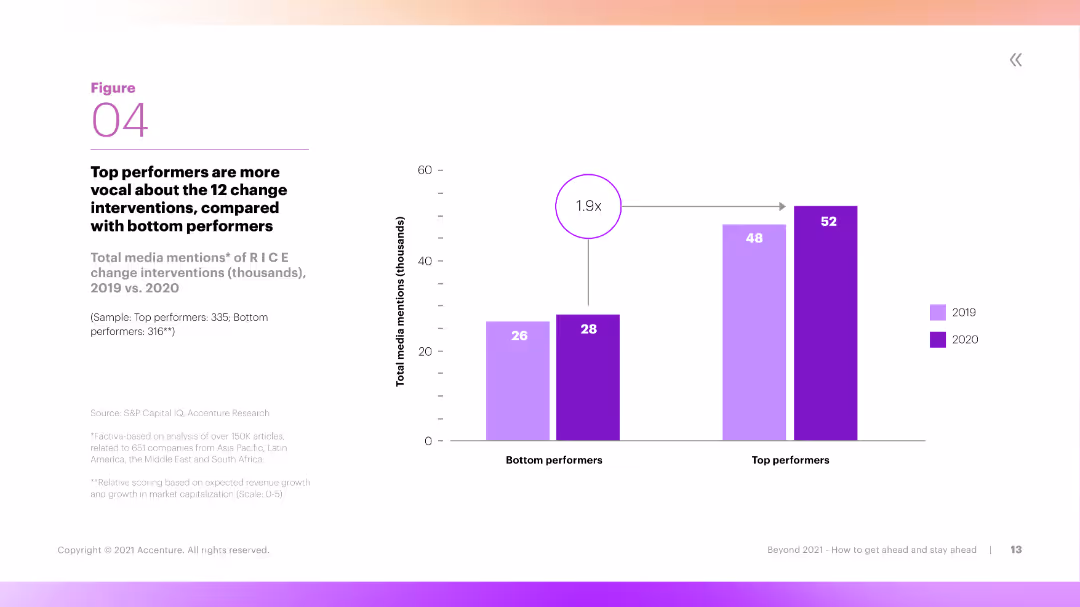
The slide features a column chart showing the number of media mentions of RICE change interventions by top and bottom performers over two years. The chart is clear, with distinct colors for different years and performance levels.
Performance Metrics and KPIs
Professional Services
The slide compares the total media mentions of RICE change interventions between top and bottom performers in 2019 and 2020. It shows that top performers are significantly more vocal about these interventions, indicating proactive engagement.
Media Mentions, RICE, Top Performers, Interventions, Engagement
false
Top performers are more vocal about the 12 change interventions, compared with bottom performersBeyond 2021: How to Get Ahead and Stay Ahead
Mixed Chart
Accenture
View slide
A column chart showing revenue progression from 2022 to 2026 with specific comments on various influencing factors like productivity and capability enhancements.
Financial Performance
Financial Services
This slide illustrates the revenue enhancement plan up to 2026, highlighting the productivity and capability improvements driving the revenue forecast.
revenue, productivity, capabilities, forecast, enhancement
false
Revenue plans reflect enhanced capabilities and improved productivityFourth quarter 2023 Results and investor update
Single Chart
UBS
View slide
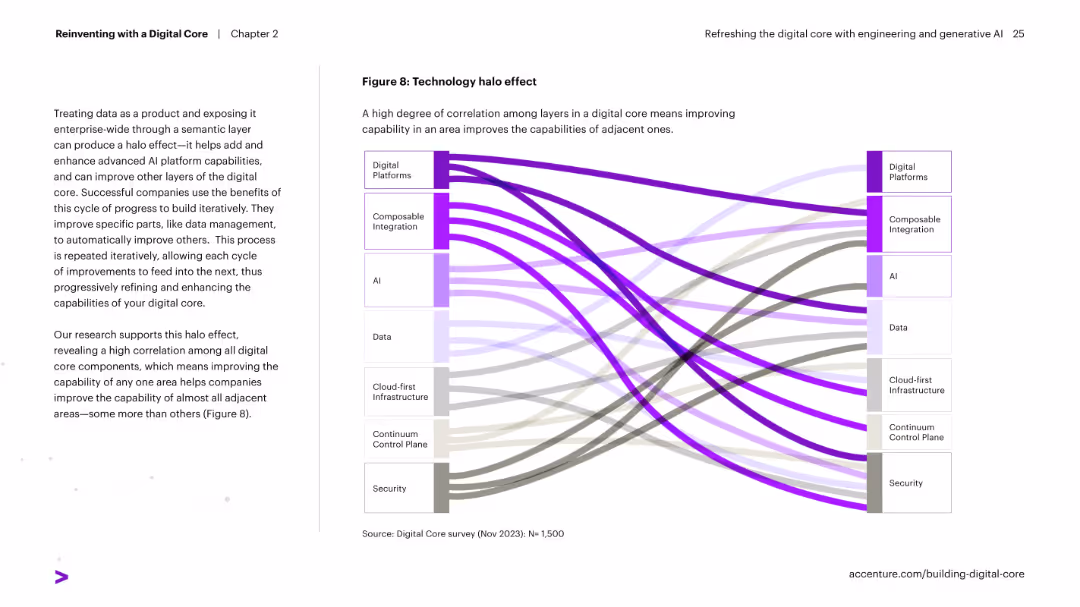
Sankey diagram on right visually showing correlation flows between different digital core components. Text on left explains the halo effect of improving one area benefitting others.
Technology and Digital Transformation
Technology & Software
Explains how enhancing one area of a digital core (e.g., AI or integration) strengthens other components. The high interconnectivity across the core's layers is represented visually in a Sankey diagram.
halo effect, digital core, integration, AI, correlation, transformation, platform improvement
false
Figure 8: Technology halo effectReinventing with a Digital Core
Diagram
Accenture
View slide
This slide contains text and multiple icons with a central photo of a surveyor. It highlights infrastructure projects in the Philippines under the "Build, Build, Build" program.
Market Analysis and Trends
Real Estate & Construction
Discusses the Philippines' infrastructure development, including major projects like the Metro Manila Subway and improvements across various regions.
infrastructure, Philippines, development, projects, construction
false
A key pillar of the incumbent administration’s economic plan is the Build, Build, Build Program, which aims to improve transport efficiency, market opportunities, and overall productivity by ushering in the Philippines’ ‘golden age of infrastructure.’ In 2021Doing business in the Philippines 2021
Graphic
Deloitte
View slide
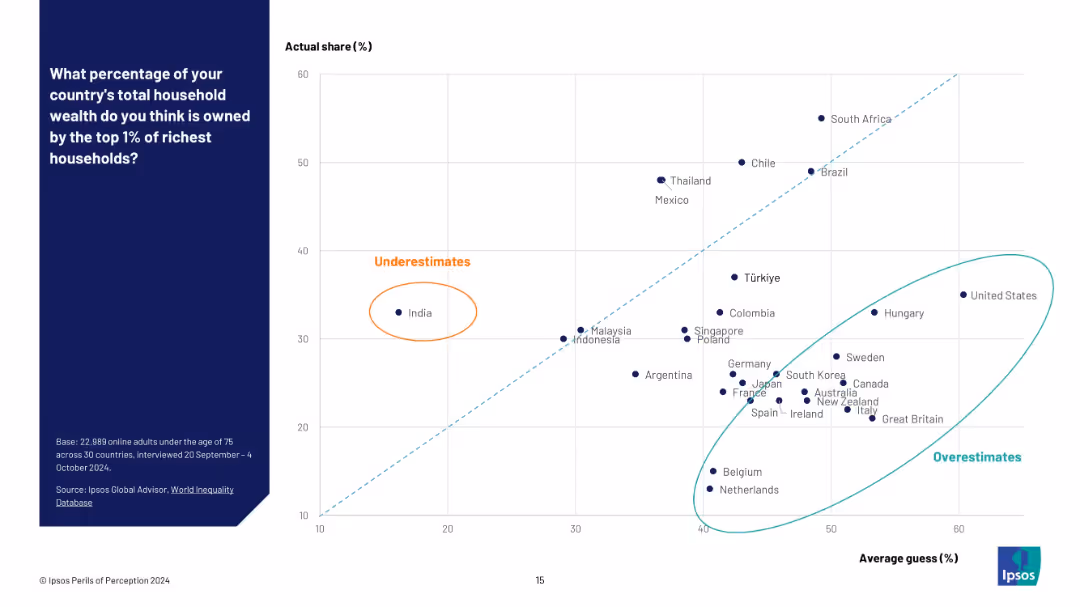
Scatter plot with X-axis as average guess (%) and Y-axis as actual share (%); countries plotted as dots.
Market Analysis and Trends
Professional Services
This scatter plot visualizes the alignment (or lack thereof) between perception and reality regarding wealth concentration. It shows how some countries tend to significantly overestimate or underestimate the wealth held by the top 1%.
wealth inequality, data visualization, scatter plot, global perceptions, reality gap, Ipsos, overestimation, underestimation
false
What percentage of your country's total household wealth do you think is owned by the top 1% of richest households?PERILS OF PERCEPTION
Mixed Chart
IPSOS
View slide
The slide presents a column chart comparing average 2022 costs by technology, including CDPs, identity solutions, DMPs, CMPs, and DCRs, with costs ranging from $376K to $437K.
Technology and Digital Transformation
Technology & Software
The slide outlines the compounded costs of using data clean rooms (DCRs) alongside other privacy-preserving technologies, showing the potential for annual costs to exceed $2 million.
DCR costs, privacy technologies, annual costs, financial
false
Additionally, using DCRs with o ther p rivacy preserving t echnology c an d rive a nnual c osts a bove $2MState of Data 2023
Mixed Chart
IPSOS
View slide
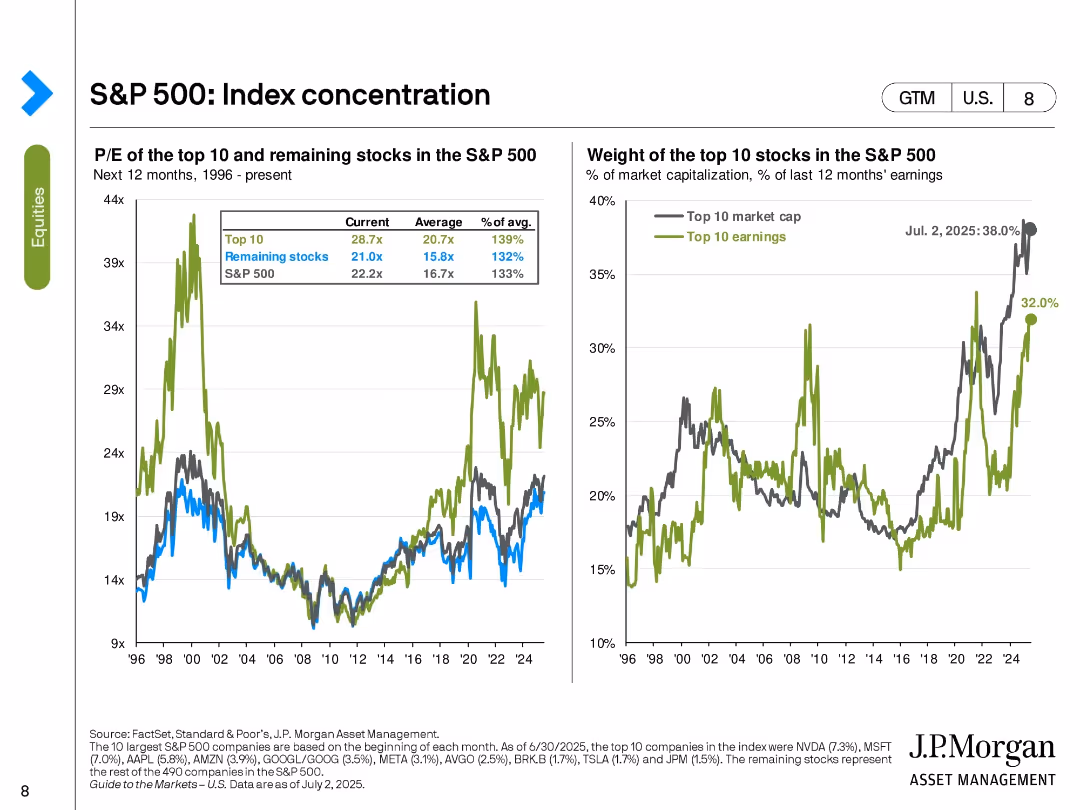
Dual-axis charts comparing P/E ratios and market weight of the top 10 S&P 500 stocks versus the rest.
Market Analysis and Trends
Financial Services
This slide explores the concentration within the S&P 500 by separating the top 10 companies from the remaining 490. It shows their P/E valuations and their share of market cap (38%) and earnings (32%) as of July 2025. Top 10 stocks are significantly overvalued relative to their historical averages.
index concentration, S&P 500, top 10 stocks, market cap, earnings, valuation, P/E ratio, dispersion, equity markets
false
S&P 500: Index concentrationGuide to the Markets U.S. 3Q 2025
Multiple Chart
JP Morgan
View slide
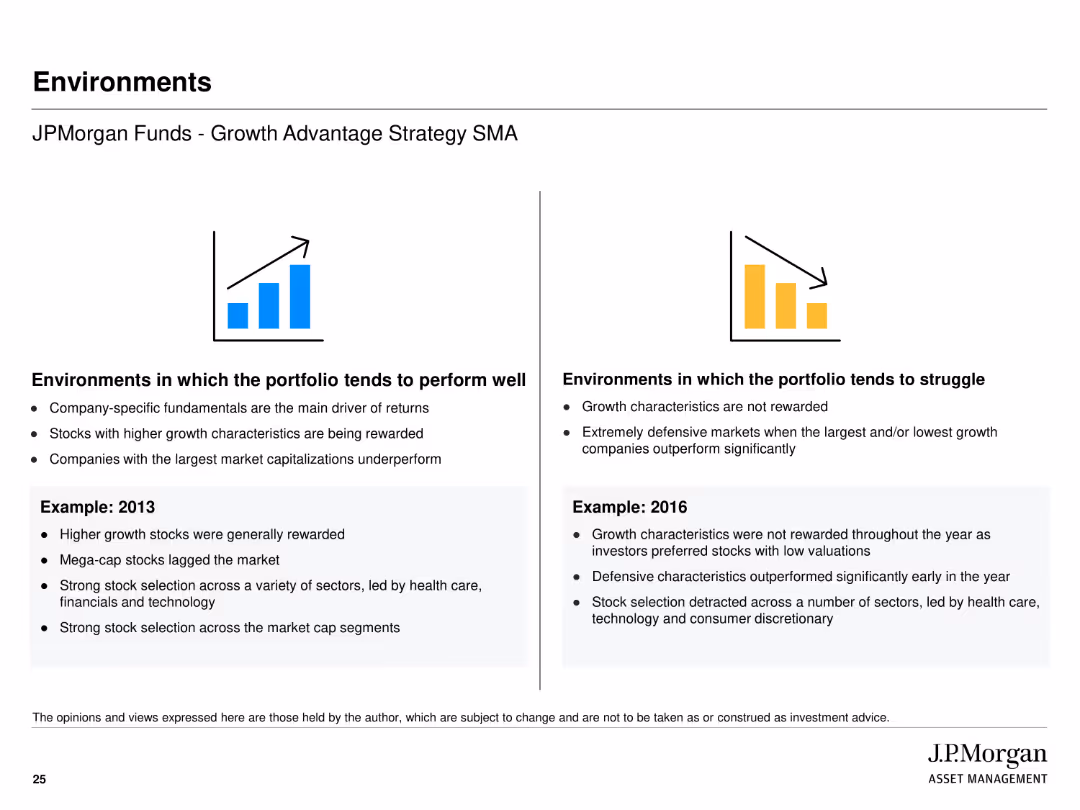
The slide uses icons and text to illustrate environments in which the portfolio tends to perform well or struggle, with examples from 2013 and 2016.
Strategic Planning
Financial Services
Describes the conditions under which J.P. Morgan Funds - Growth Advantage Strategy SMA performs well or poorly, using past performance in different market conditions.
environments, performance, strategy, planning, market conditions, text, image
false
Environments JPMorgan Funds - Growth Advantage Strategy SMAJ.P. Morgan Growth Advantage Strategy
Pillar
JP Morgan
View slide
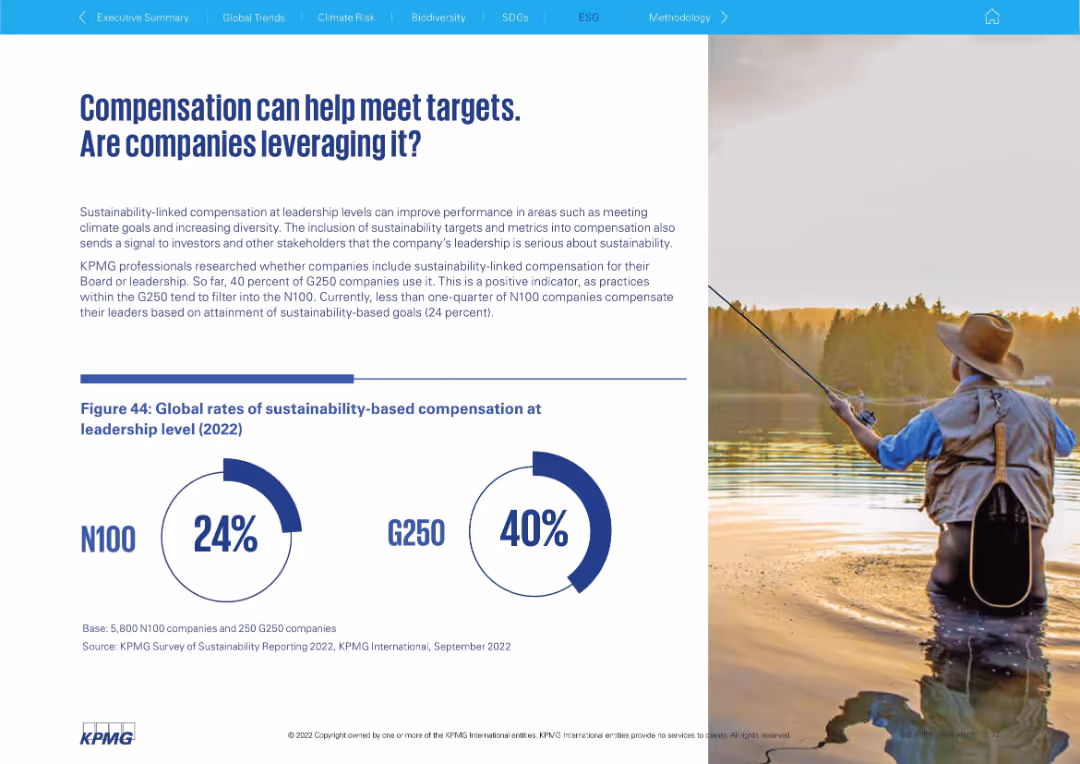
Split design with fishing scene and a large infographic showing rates of sustainability-based compensation.
Human Resources and Talent Management
Professional Services
This slide highlights how sustainability-linked compensation is used to align leadership performance with ESG goals. It reveals only 24% of N100 and 40% of G250 companies use such incentives.
compensation, ESG goals, performance metrics, executive pay, sustainability, leadership incentives, G250, N100
false
Compensation can help meet targets. Are companies leveraging it?Big shifts, small steps Survey of Sustainability Reporting 2022
Mixed Chart
KPMG
View slide
Contains two line charts, one showing real US 10-year Treasury yield vs. gold prices, and the other displaying commodity prices rebased to January 2007.
Market Analysis and Trends
Energy & Utilities
The slide examines the relationship between real US 10-year Treasury yields and gold prices, as well as tracking commodity prices over time, highlighting trends in different sectors.
commodities, gold, Treasury yield, prices, trends
false
Real US 10 year Treasury yield vs. goldGuide to the Markets UK | Q2 2024
Multiple Chart
JP Morgan
View slide
The slide features a column chart showing the primary demand for renewable energies from 2000 to 2017, detailing the contributions of wind, solar, geothermal, hydro, advanced biofuels, and primary solid biofuels, with CAGR percentages.
Market Analysis and Trends
Energy & Utilities
This slide tracks the growth and changing composition of renewable energy demand from 2000 to 2017, emphasizing the shift towards wind and solar energies while noting the decreasing share of bioenergy.
renewable energies, primary demand, 2000-2017, wind, solar, geothermal, hydro, biofuels
false
Bioenergy is historically the first contributor to the renewable mix; however its share is now decreasing vs. wind and solar energiesDeveloping sustainable carbon circularity Looking at advanced applications and business models
Single Chart
Kearney
View slide
Slide contains three sections with lists and icons, detailing themes of customer experience, talent initiatives, and technology in contact centers. Colorful icons help differentiate the topics.
Operational Efficiency
Professional Services
Discusses three major themes identified in a global survey about contact centers: channel orchestration, talent initiatives, and cognitive technology, providing insights into current and future trends.
Contact Centers, Customer Experience, Talent Management, Technology, Survey Insights, Future Trends
false
2023 Global Contact Center Survey ThemesTrends & AI in the Contact Center
Pillar
Deloitte
View slide
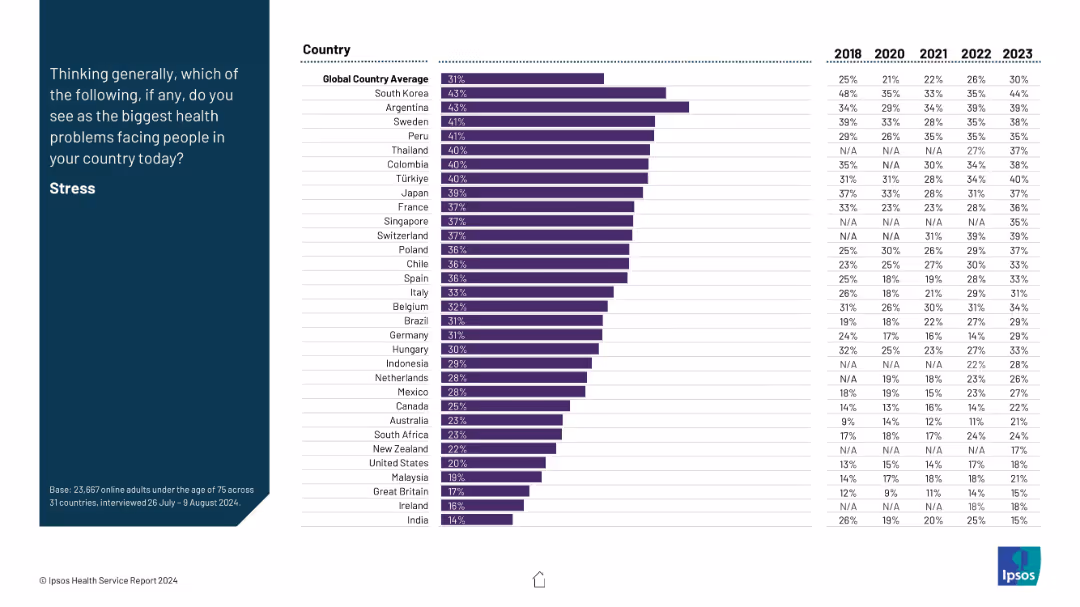
Layout consistent with previous: prompt on left, bar chart on right with time series from 2018–2023 for each country.
Market Analysis and Trends
Healthcare & Pharmaceuticals
This slide tracks stress perception as a major health issue across countries, with time series data. South Korea and Argentina show the highest concern. A global upward trend is visible, with stress becoming increasingly recognized as a health challenge.
stress, global health, trends, mental well-being, survey data
false
StressIPSOS HEALTH SERVICE REPORT 2024
Mixed Chart
IPSOS
View slide
Slide is a table layout detailing figures, with clear demarcation and legible text.
Risk Assessment and Management
Energy & Utilities
Analyzes BBVA's exposure to the Oil & Gas sector, with a breakdown by region and subsegment.
Oil, Gas, exposure, BBVA, risk
false
Appendix 1: Oil & Gas Sector Exposure BreakdownBBVA - Thinking Ahead Morgan Stanley European Financials Conference 2016
Table
Morgan Stanley
View slide
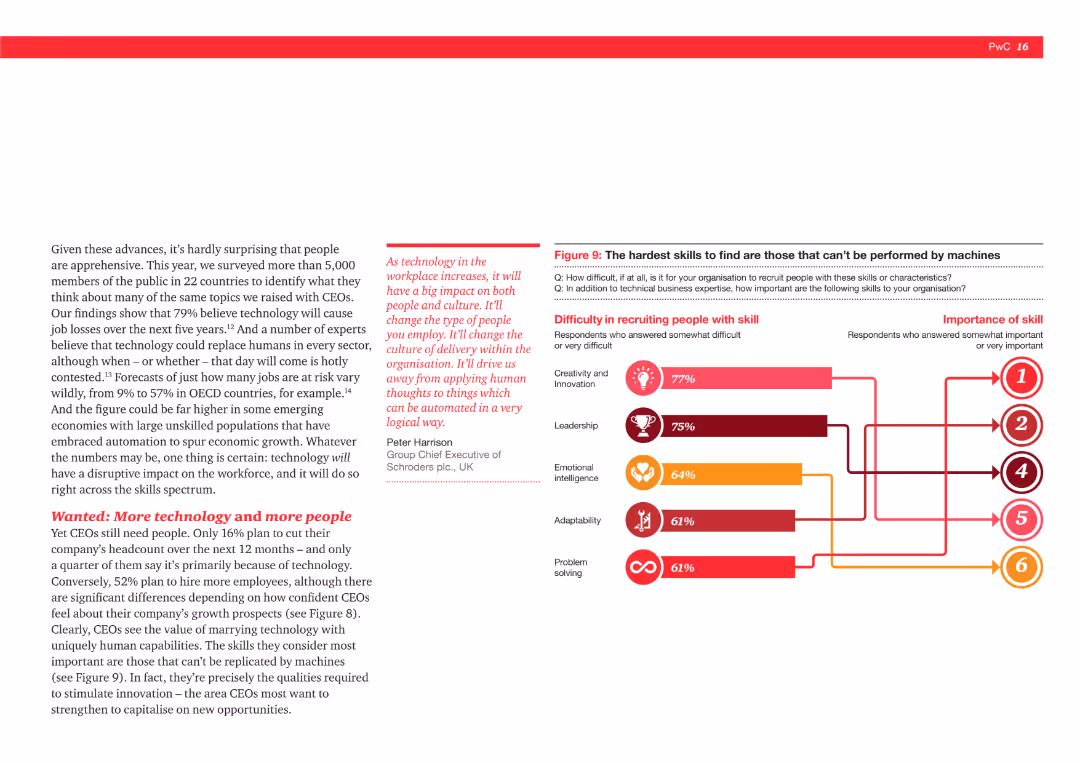
The slide includes a column chart showing the difficulty in recruiting various skills such as creativity (77%), leadership (75%), and emotional intelligence (64%). It also shows the importance of these skills.
Human Resources and Talent Management
Professional Services
This slide addresses the challenges CEOs face in recruiting skills that cannot be automated. It lists creativity, leadership, and emotional intelligence as the most difficult to find, alongside their importance to organizations.
Recruitment, skills, automation, creativity, leadership, emotional intelligence, CEOs, HR challenges
false
Figure 9: The hardest skills to find are those that can’t be performed by machines20 years inside the mind of the CEO... What’s next?
Mixed Chart
PwC/Strategy&
View slide
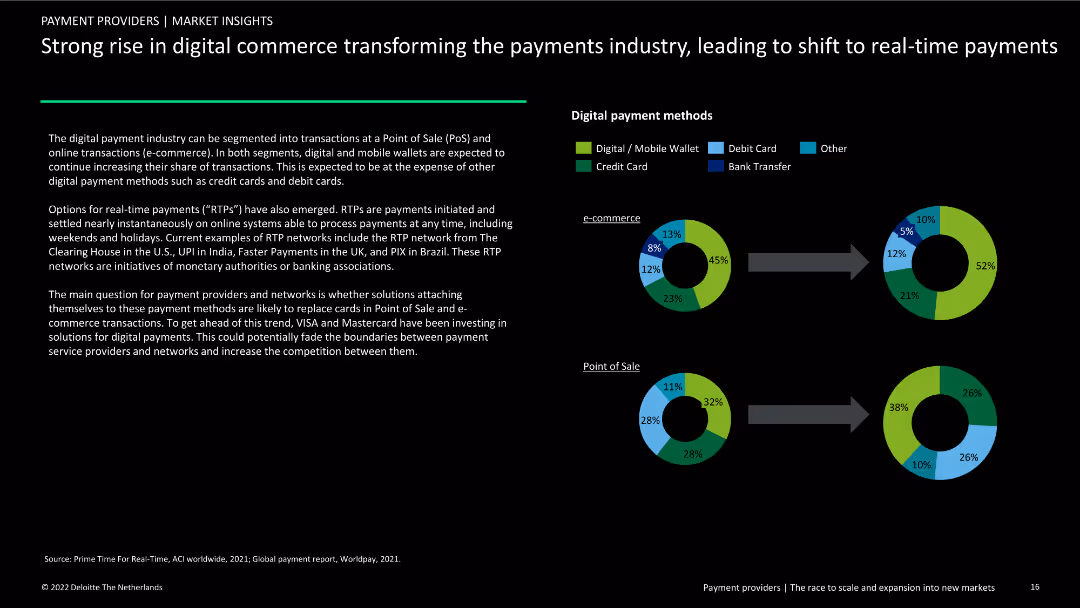
Contains two donut charts showing digital payment methods for e-commerce and Point of Sale (PoS). Includes text explaining the rise of digital wallets and real-time payments.
Market Analysis and Trends
Financial Services
Examination of the shift to digital and real-time payments in e-commerce and PoS, highlighting the increasing use of mobile wallets and instant payment methods.
digital commerce, payments industry, e-commerce, PoS, digital wallets, real-time payments, market analysis, financial services, trends, transformation
false
Strong rise in digital commerce transforming the payments industry, leading to shift to real time paymentsPayment providers | The race to scale and expansion into new markets
Multiple Chart
Deloitte
View slide
This slide has two sections showing bar graphs of firmwide AUS growth and a ranking chart for organic growth, all depicted in shades of blue.
Client Case Studies
Financial Services
Illustrates the growth in assets under supervision and compares organic growth rates among top public asset managers.
Asset Growth, AUS, Organic Growth, Rankings, Client Relationships, Asset Managers
false
Resulting in Significant Asset Growth as We Deepen Client RelationshipsGoldman Sachs Investor Day
Multiple Chart
Goldman Sachs
View slide
This slide features a column chart with color-coded columns indicating different levels of spread for various bond types. Below the chart, there is a data table with spread details.
Market Analysis and Trends
Financial Services
The slide presents a detailed spread analysis for fixed income securities, providing a comparative perspective across different bond categories and dates.
fixed income, spread analysis, bonds, column chart, data table, market, financial, investment
false
Spread Analysis (bps)Monthly Market Monitor November 2023
Single Chart
Morgan Stanley
View slide
Contains pie charts and a sector diagram to showcase sales distribution and operating margins by business group. Rich in visual data and structured layout.
Competitive Landscape
Transportation & Logistics
Highlights Faurecia's global leadership and sales figures across different business groups, demonstrating its strong market position and development potential within the automotive sector.
global leadership, sales, market position, automotive, development
false
Faurecia’s activities are currently organized around three “Business Groups” with global leadership positions and strong development potentialDeutsche Bank Global Auto Industry Conference
Multiple Chart
Deutsche Bank
View slide
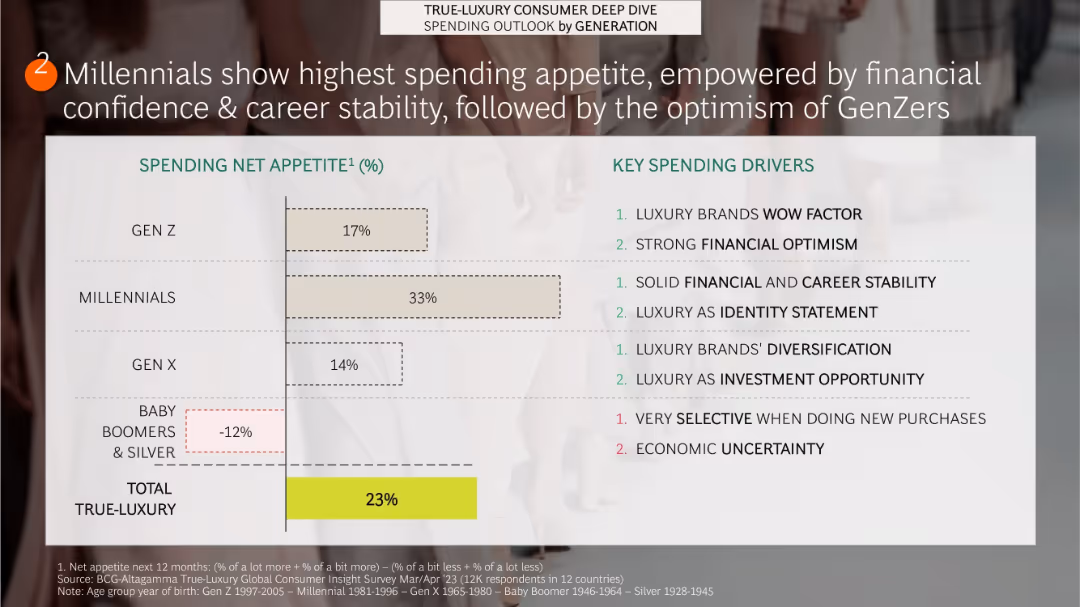
Split layout with left side bar chart showing spending appetite by generation and right side listing key spending drivers by cohort
Customer and Market Segmentation
Consumer Goods
Millennials show the highest net appetite for luxury spending (33%), attributed to financial and career stability. Gen Z (17%) follows due to optimism and luxury's wow factor. Older generations like Baby Boomers and Silvers have a negative net appetite, citing economic uncertainty.
generations, spending appetite, Millennials, Gen Z, Baby Boomers, financial optimism, identity, luxury market
false
Millennials show highest spending appetite, empowered by financial confidence & career stability, followed by the optimism of GenZersTrue-Luxury Global Consumer Insights
Single Chart
BCG
View slide
A column chart showing the number of foreign investment projects and jobs created from 2010 to 2022, with an accompanying text box providing context.
Market Analysis and Trends
Financial Services
The slide presents the trends in foreign direct investment projects and jobs in Europe over a period of time and discusses the factors influencing these trends.
FDI, trends, Europe, investment, jobs
false
The macroeconomic challenges have slowed Europe’s FDIHow can Europe turn on the taps of foreign investment?
Mixed Chart
EY
View slide
The slide features a comprehensive diagram summarizing the general overview of processing methods for biofuels. It includes stages from harvesting/collection, conditioning, pretreatment, intermediate, conversion, to biofuel consumption, highlighting different processes at each stage.
Technology and Digital Transformation
Energy & Utilities
This slide provides an overview of the processing methods for biofuels, detailing each stage from harvesting and collection to final biofuel consumption, emphasizing the importance of conditioning, pretreatment, and conversion processes.
processing methods, biofuels, harvesting, conditioning, pretreatment, intermediate, conversion, biofuel consumption
false
Feedstock processing toward biofuel includes three sub-steps: conditioning, pretreatment, and conversionDeveloping sustainable carbon circularity Looking at advanced applications and business models
Diagram
Kearney
View slide
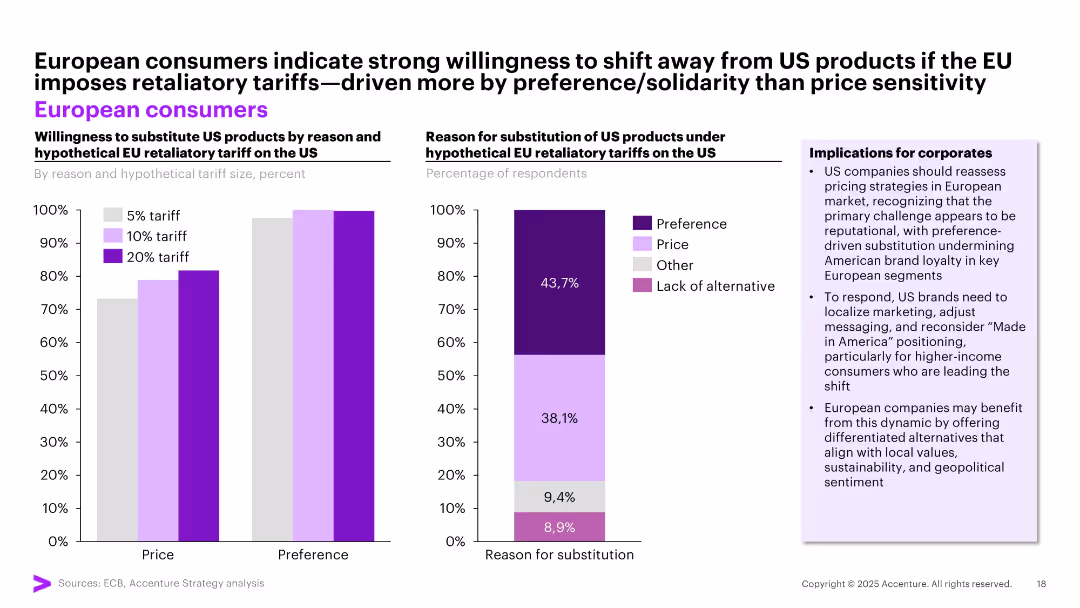
Dual chart layout showing willingness to substitute US products under tariff scenarios (left) and reasons for substitution (right); bar and stacked bar visuals; implications in side panel.
Strategic Planning
Retail & E-commerce
The slide shows that European consumers are highly likely to substitute US products if tariffs are imposed, mainly due to brand preference rather than price. This trend signals reputational risk for US brands and opportunity for localized EU branding.
EU tariffs, substitution, brand preference, pricing, reputation risk, US products
false
European consumers indicate strong willingness to shift away from US products if the EU imposes retaliatory tariffs—driven more by preference/solidarity than price sensitivityMay Macro Brief Consumer spending in flux
Multiple Chart
Accenture
View slide
Similar to the previous slide, this one presents data for Great Britain, showing the mean estimate of CO2 emissions from a beef burger and the percentage of respondents who couldn't estimate the distance.
Market Analysis and Trends
Environmental Services & Sustainability
This slide focuses on the British respondents' awareness of the carbon footprint of beef burgers, highlighting that 83% couldn't estimate the distance, with an average estimate of 24 miles.
Carbon footprint, beef burger, emissions, Great Britain, public perception
false
The amount of carbon dioxide released into the atmosphere as a result of making one beef burger is equivalent to driving how far in a car?Great Britain –mean inPERILS OF PERCEPTION
Mixed Chart
IPSOS
View slide
Bar chart showing market growth strategies on the left and market optimization strategies on the right.
Strategic Planning
Financial Services
Describes strategies for optimizing market footprint and focusing investments on high-priority markets.
market optimization, investment, strategy, priority markets, growth
false
Continue to optimize footprint and focus investment on priority marketsInvestor Deep Dive 2022
Mixed Chart
Credit Suisse
View slide
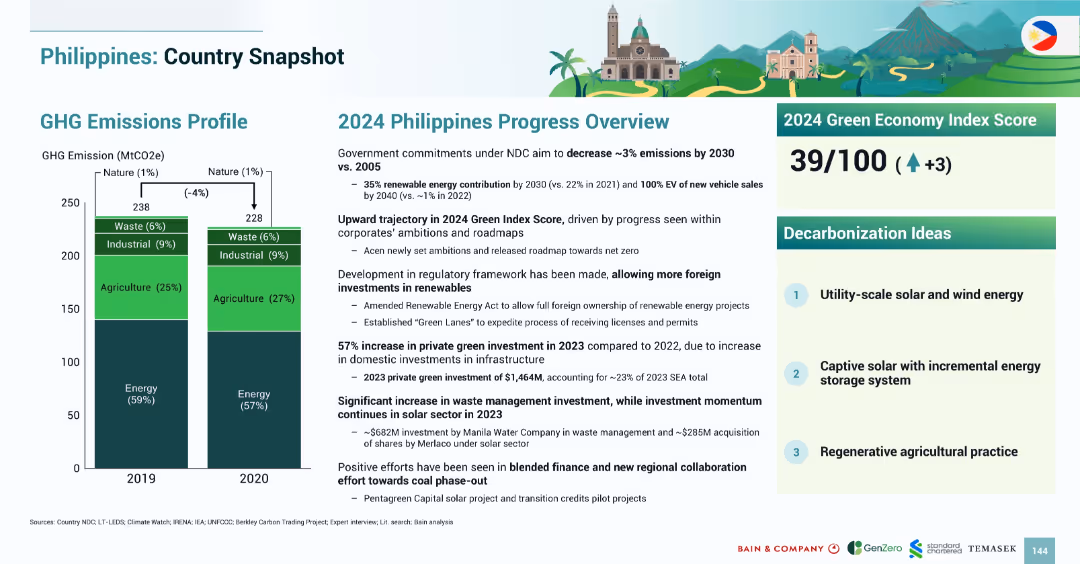
Similar structure to Malaysia snapshot with bar chart on left and textual progress overview and Green Index Score on right.
Strategic Planning
Government & Public Sector
The slide highlights the Philippines’ GHG emissions profile and national progress in 2024. Emissions dropped by 4% from 2019 to 2020. The 2024 Green Economy Index Score rose to 39. Foreign renewable investment has increased due to favorable policy changes. Key decarbonization priorities include utility-scale solar/wind and regenerative agriculture.
Philippines, emissions, renewable energy, policy, 2024, solar, agriculture, Green Index
false
Philippines: Country SnapshotSOUTHEAST ASIA’S GREEN ECONOMY 2024
Mixed Chart
Bain
View slide
Two sets of column charts are present. The top set displays regional/style-based expected EPS growth versus actual EPS growth in 2022, using horizontal bars. The bottom set uses vertical bars to show S&P 500 sectors' EPS growth. Red and gray color schemes distinguish between expected and actual figures.
Investment Analysis
Financial Services
This slide examines the expected versus actual earnings per share growth for different regions and S&P 500 sectors, providing insights for investors and market analysts.
EPS growth, corporate earnings, regional analysis, sector performance, financial forecasting, investment strategy
false
Corporate Earnings GrowthMonthly Market Monitor November 2023
Multiple Chart
Morgan Stanley
View slide
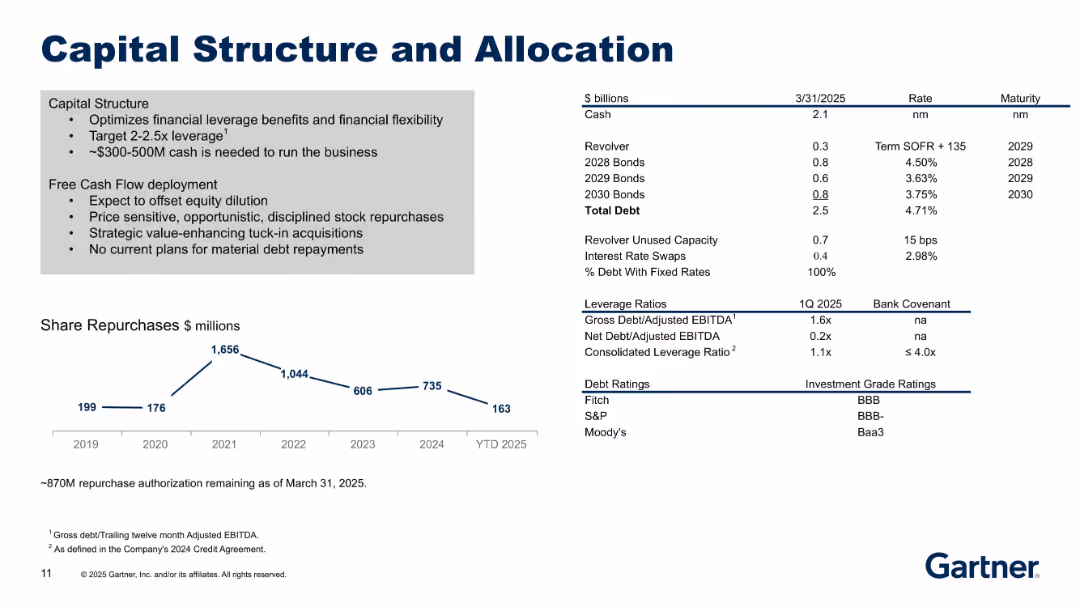
Identical layout and content to slide 18615.
Corporate Finance and Valuation
Financial Services
Duplicate of slide 18615, reiterating Gartner’s approach to capital management, debt structure, and repurchase strategies. May serve as reinforcement or repeated placement in a presentation.
leverage, capital structure, cash flow, debt, repurchases, allocation, financial strategy, Gartner
false
Capital Structure and AllocationFirst Quarter 2025 Results
Mixed Chart
Gartner
View slide
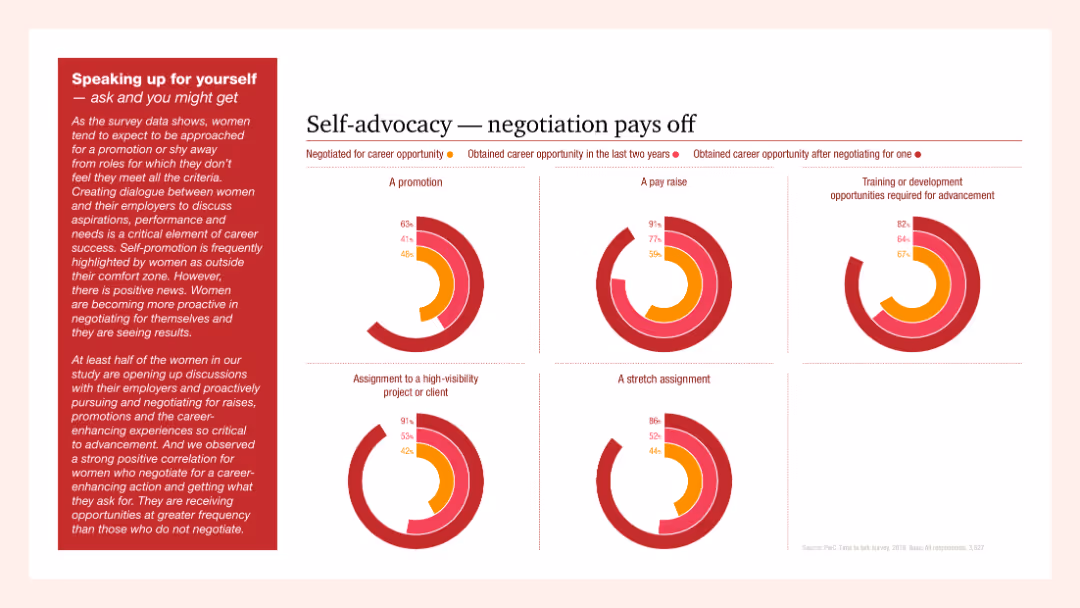
Multiple column charts showing the outcomes of self-advocacy in career advancement including promotions, pay raises, and high-visibility projects. Text emphasizes the importance of negotiation for career progression.
Human Resources and Talent Management
Professional Services
The slide illustrates the positive impacts of self-advocacy and negotiation on career opportunities for women, showing significant statistics on promotions, pay raises, and career advancement through self-advocacy.
self-advocacy, negotiation, career, women, advancement
false
Self-advocacy — negotiation pays offTime to talk: What has to change for women at work
Multiple Chart
PwC/Strategy&
View slide
Three sets of column charts displaying agreement percentages by age group on trusting business leaders, career fulfillment, and wealth disparity.
Market Analysis and Trends
Government & Public Sector
It examines how younger people compare to older cohorts regarding trust in business leaders, career goals, and views on income inequality.
youth, trust, career focus, wealth disparity, business leaders, column chart, age groups
false
The young are more trusting of business leaders and more focused on their careersA NEW WORLD DISORDER?
Multiple Chart
IPSOS
View slide
Contains multiple line charts comparing different interest rates over time.
Market Analysis and Trends
Financial Services
Shows trends in market-implied interest rates including the ECB deposit facility rate and the Federal Reserve interest on reserve balances, reflecting how market expectations have shifted over time.
interest rates, market trends, ECB, Federal Reserve
false
Evolution of market-implied interest rates In %Q1 2023 results
Multiple Chart
Deutsche Bank
View slide
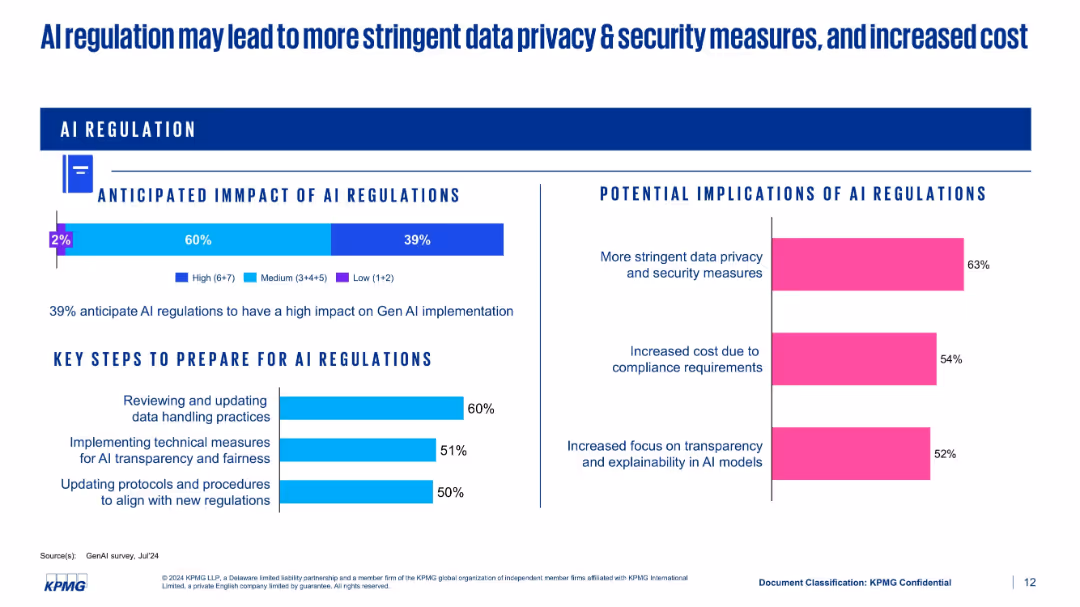
Split-panel layout showing regulatory impact, implications, and preparation steps using bar charts
Regulatory and Compliance
Artificial Intelligence
This slide discusses the anticipated impact of AI regulations. 39% expect high impact, with implications such as stricter data privacy measures and higher compliance costs. It also lists preparation strategies like updating protocols and implementing transparency measures.
AI regulation, compliance, data privacy, cost, preparation, transparency
false
AI regulation may lead to more stringent data privacy & security measures, and increased costGenAI Survey –2024 Key insights
Multiple Chart
KPMG
View slide
The slide features bar charts showing risks and opportunities percentages. Text boxes detail risks and opportunities, and a summary box highlights key takeaways.
Market Analysis and Trends
Industrial & Manufacturing
It shows survey results indicating a need for repositioning in industrial products functions due to digitalization, with focus on controlling, procurement, and logistics.
Digitalization, industrial products, risks, opportunities, controlling, procurement, logistics
false
~2/3 of leaders in Industrial Products confirm the need for functions to reposition Highest potential in Controlling, Procurement & Logistics10th Operations Efficiency Radar
Multiple Chart
Roland Berger
View slide
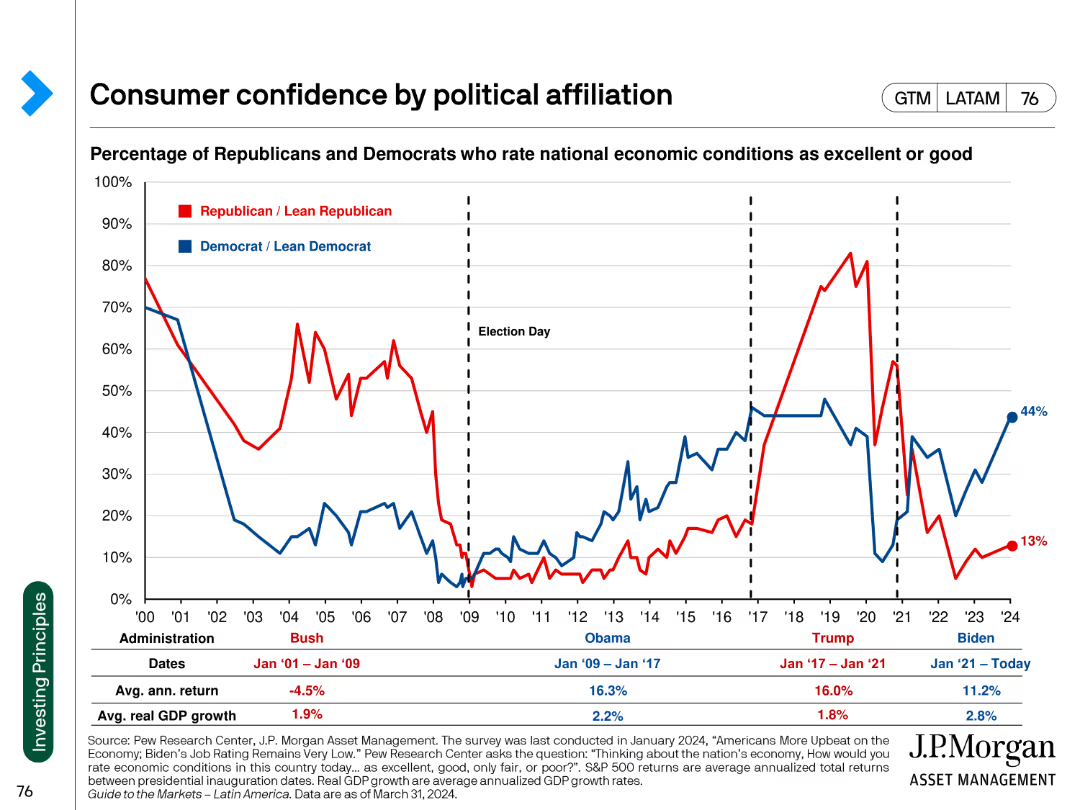
Line chart comparing the percentage of Republicans and Democrats rating national economic conditions as excellent or good. The chart spans multiple administrations.
Market Analysis and Trends
Financial Services
This slide shows the fluctuation in consumer confidence among political affiliations across different U.S. presidential administrations. It uses data to indicate partisan perspectives.
consumer confidence, political affiliation, economic conditions, administration, trend analysis
false
Consumer confidence by political affiliationGuide to the Markets Latin America | 2Q 2024
Single Chart
JP Morgan
View slide
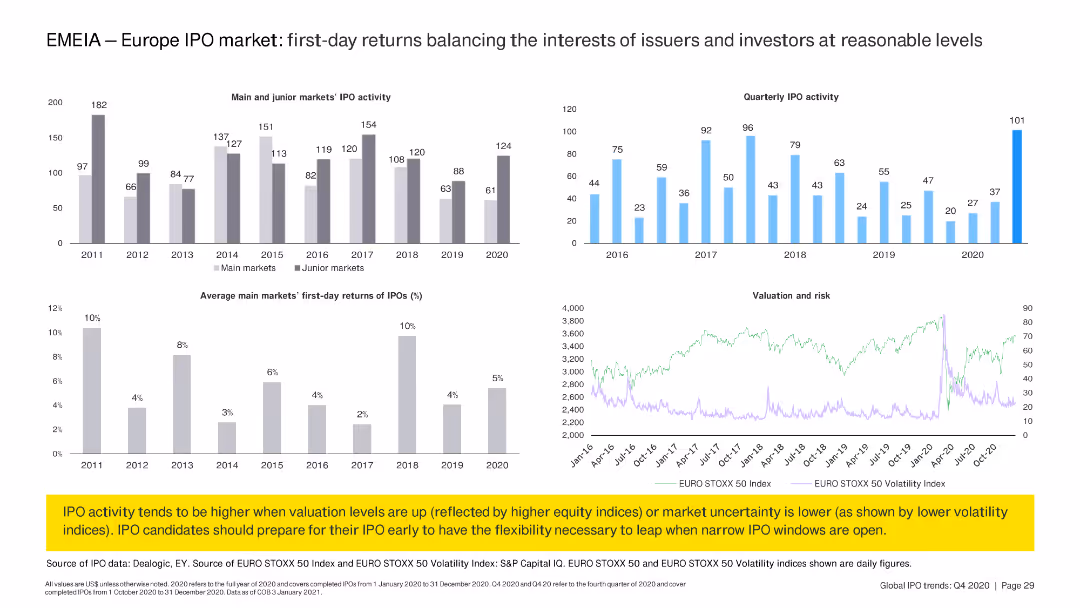
The slide includes two column charts displaying IPO activity and first-day returns in main and junior markets from 2011 to 2020. A line chart shows valuation and risk trends over time.
Market Analysis and Trends
Financial Services
Analyzes first-day returns of IPOs in Europe's main and junior markets, showing trends from 2011 to 2020. Highlights the relationship between IPO activity, valuation, and market risk.
IPO, Europe, first-day returns, market trends, valuation, risk, financial services, EMEIA
false
EMEIA — Europe IPO market: first-day returns balancing the interests of issuers and investors at reasonable levelsIs your business model resilient enough to weather any storm?
Multiple Chart
EY
View slide
Multiple bar charts represent the number one business threats across different regions, with contrasting colors to differentiate between the years. The layout is well-structured, allowing for easy comparison.
Risk Assessment and Management
Financial Services
It highlights regional differences in business threat perception, used for geographic-specific risk analysis and strategic regional planning.
regional threats, business concerns, risk analysis, cyber threats, policy uncertainty, geopolitical risk, strategic planning.
false
EXHIBIT 7 Each region cites a different number one threat, but there is a broad consistency in what is top-of-mind across the worldPwC's 22nd Annual Global CEO Survey
Multiple Chart
PwC/Strategy&
View slide
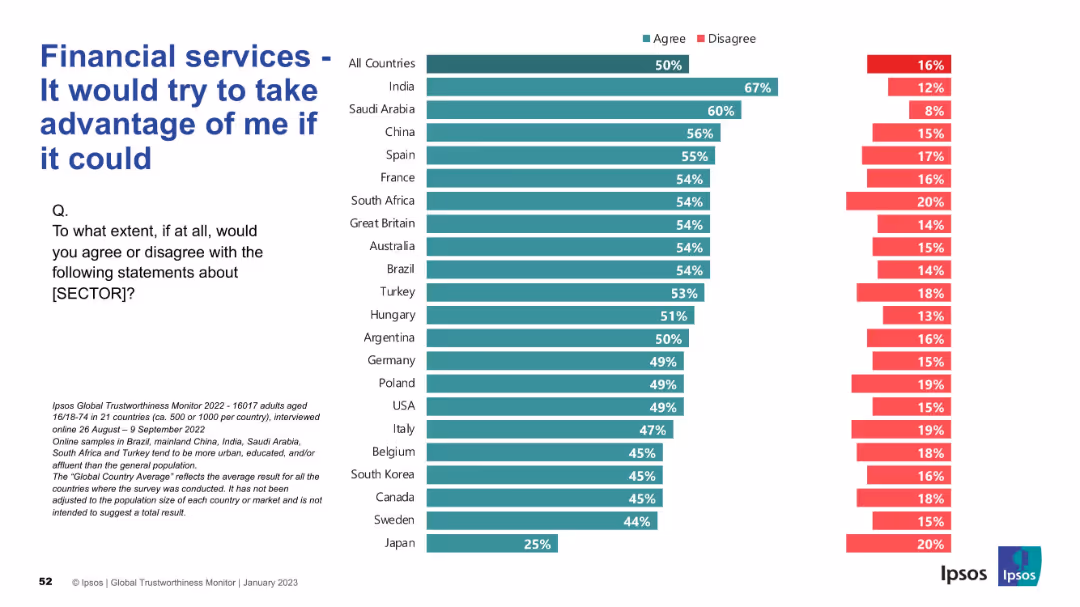
Inverted sentiment slide; high agreement interpreted negatively; same bar chart format
Risk Assessment and Management
Financial Services
This slide reveals a critical perspective, measuring suspicion toward financial services. High agreement in many countries (including India and Saudi Arabia) indicates a pervasive belief that financial services might exploit individuals.
exploitation, skepticism, risk, financial trust, Ipsos, perception, suspicion, survey, agreement
false
Financial services - It would try to take advantage of me if it couldIPSOS GLOBAL TRUSTWORTHINESS MONITOR January 2023
Mixed Chart
IPSOS
View slide
Contains bar charts comparing job losses and gains from 2020 to 2030 across various industries.
Market Analysis and Trends
Transportation & Logistics
Shows projected job market changes within automotive and energy sectors due to shifts in technology and market dynamics, like the rise of electric vehicles and energy production.
Automotive, Energy, Job Market, 2030, Electric Vehicles, Technology Shift, Market Dynamics, Employment Changes
false
... but leads to significant shifts between industriesChanging automotive work environment: Job effects in Germany until 2030
Mixed Chart
BCG
View slide
Slide includes lists and icons under headings "PROGRESS" and "WORKSTREAMS", detailing steps in a 3-year transformation plan.
Operational Efficiency
Consumer Goods
Explains the operational transformation roadmap with anticipated benefits like margin enhancement and support of financial targets.
transformation, operational efficiency, margin enhancement, financial targets, roadmap, icons
false
TRANSFORMATION PROGRESSBARCLAYS GLOBAL CONSUMER STAPLES CONFERENCE
Boxed
Barclays
View slide
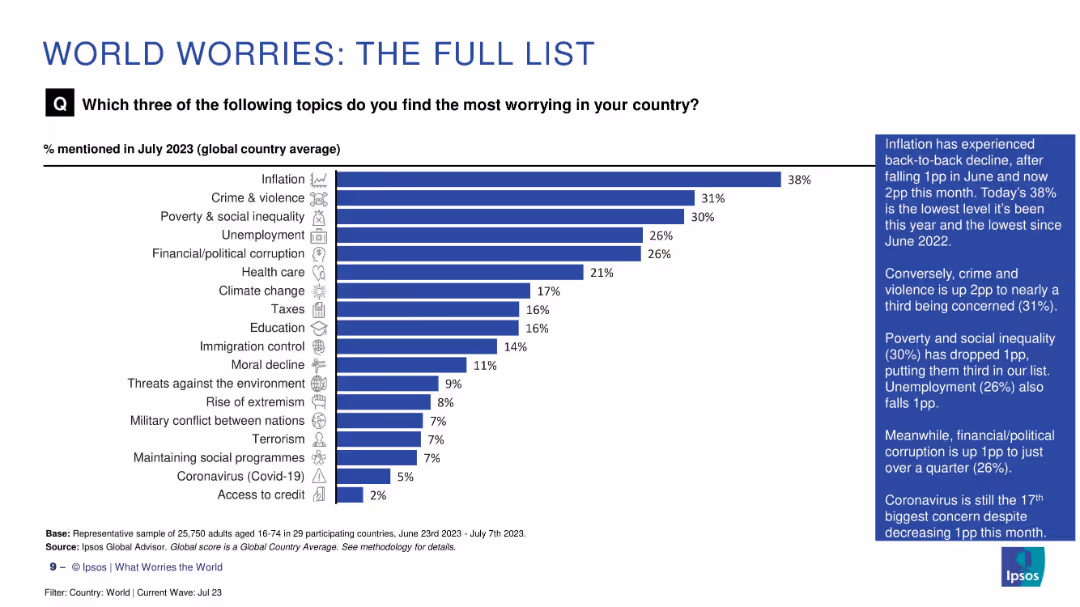
Vertical bar chart listing full range of global concerns by percentage in July 2023. Sidebar highlights key changes in concern levels.
Market Analysis and Trends
Professional Services
This slide provides a complete list of global public concerns, with inflation, crime, and inequality at the top. It captures shifts in worry levels over time, showing a broader range of societal anxieties beyond just economic or political issues.
global concerns, inflation, Ipsos survey, July 2023, public priorities, societal worries, full list
false
WORLD WORRIES: THE FULL LISTWHAT WORRIES THE WORLD? JULY 2023
Mixed Chart
IPSOS
View slide
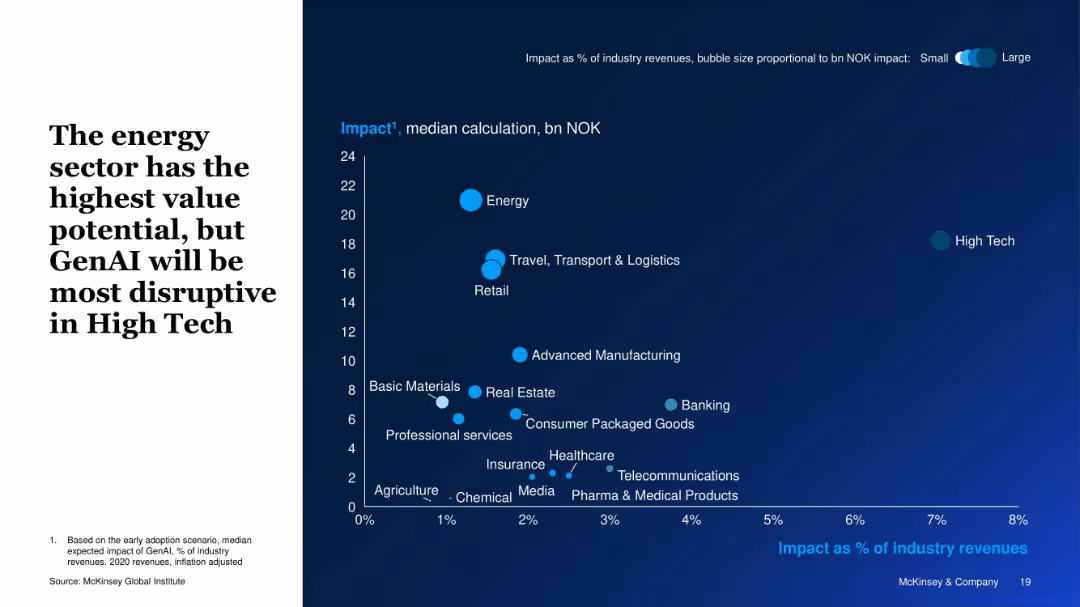
Bubble chart with axes showing impact as % of industry revenue vs. NOK value; bubble size represents overall impact.
Investment Analysis
Artificial Intelligence
This slide visually compares the expected GenAI impact across sectors. The energy sector offers the highest value (in NOK), while high tech is most disrupted (highest % revenue impact). Bubble sizes represent the magnitude of economic value potential.
Sector Impact, GenAI Disruption, Energy, High Tech, Value Potential, Bubble Chart, Revenue Impact, Industry Analysis
false
The energy sector has the highest value potential, but GenAI will be most disruptive in High TechThe economic potential of Generative AI in Norway
Single Chart
McKinsey
View slide
Table layout describing key measures and commitments of Germany's Hydrogen Strategy with icons illustrating different sectors like generation and infrastructure.
Regulatory and Compliance
Energy & Utilities
Describes Germany's hydrogen strategy with an emphasis on infrastructure, partnerships, and regulations to enhance the use of hydrogen as a sustainable energy source.
Germany, hydrogen, strategy, infrastructure, partnerships, 2020-2030
false
German government agrees on National Hydrogen StrategyChilean Hydrogen Pathway
Multiple Chart
McKinsey
View slide
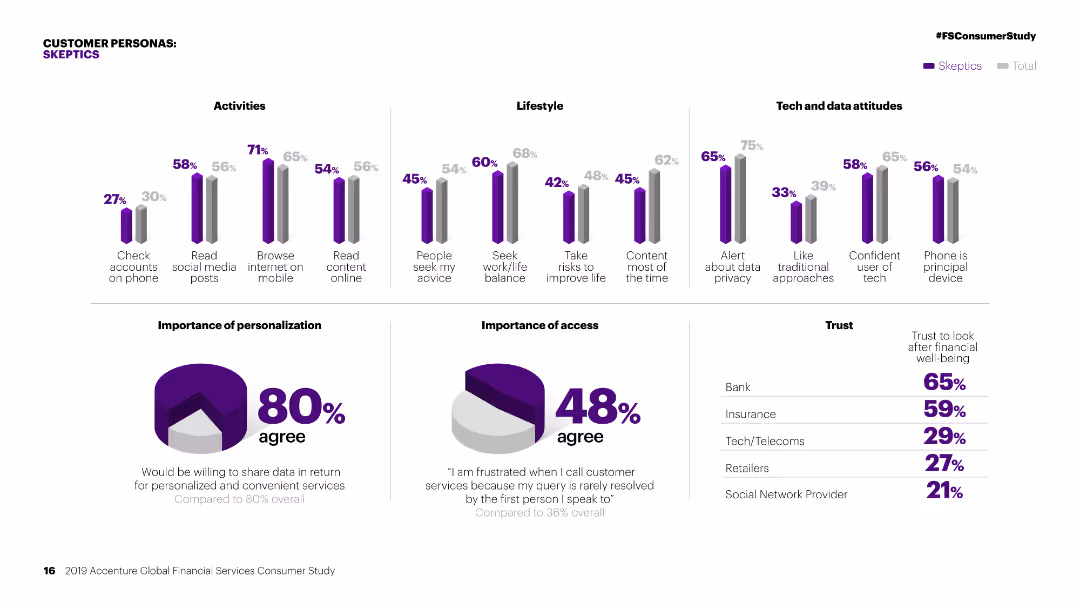
Column charts showing activities, lifestyle, and tech attitudes of 'Skeptics' compared to the total. Pie charts on personalization and access.
Customer and Market Segmentation
Financial Services
Detailed segmentation of 'Skeptics' in financial services, focusing on their activities, lifestyle, attitudes towards tech, and personalization preferences.
Personas, financial services, segmentation, skeptics, activities, lifestyle, tech attitudes, personalization, market study, access
false
CUSTOMER PERSONAS: SKEPTICS2019 Accenture Global Financial Services Consumer Study DISCOVER THE PATTERNS IN PERSONALITY
Multiple Chart
Accenture
View slide
Features a column chart comparing cost base targets from 2022 to 2025 and bullet points summarizing key actions executed and priorities for 2023.
Operational Efficiency
Financial Services
Summarizes cost reduction measures taken in 4Q22 and outlines priorities for 2023 to maintain expense discipline and operational efficiency.
cost transformation, expense reduction, priorities, operational efficiency, financial targets
false
Significant progress on cost transformation already achieved in 4Q224Q22 and Full Year 2022 Results Analyst and Investor Call
Mixed Chart
Credit Suisse
View slide
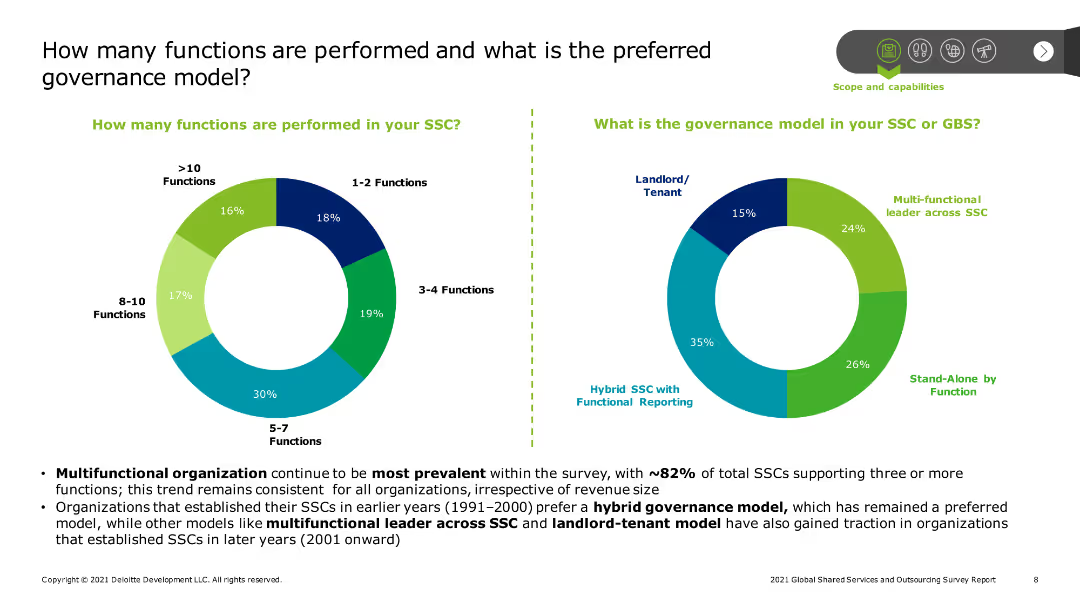
The slide features two pie charts. The left chart shows the distribution of functions performed by SSCs, ranging from 1-2 to more than 10 functions. The right chart displays preferred governance models, including multi-functional leader, stand-alone by function, and hybrid SSC.
Operational Efficiency
Professional Services
The slide analyzes the operational scope and governance models of Shared Service Centers (SSCs). It presents data on the number of functions performed by SSCs and the preferred governance structures, indicating trends towards multifunctionality and hybrid models.
Shared Service Centers, SSC functions, governance models, multifunctionality, hybrid SSC, operational efficiency, professional services, operational scope
false
How many functions are performed and what is the preferred governance model?2021 Global Shared Services and Outsourcing Survey Report
Multiple Chart
Deloitte
View slide
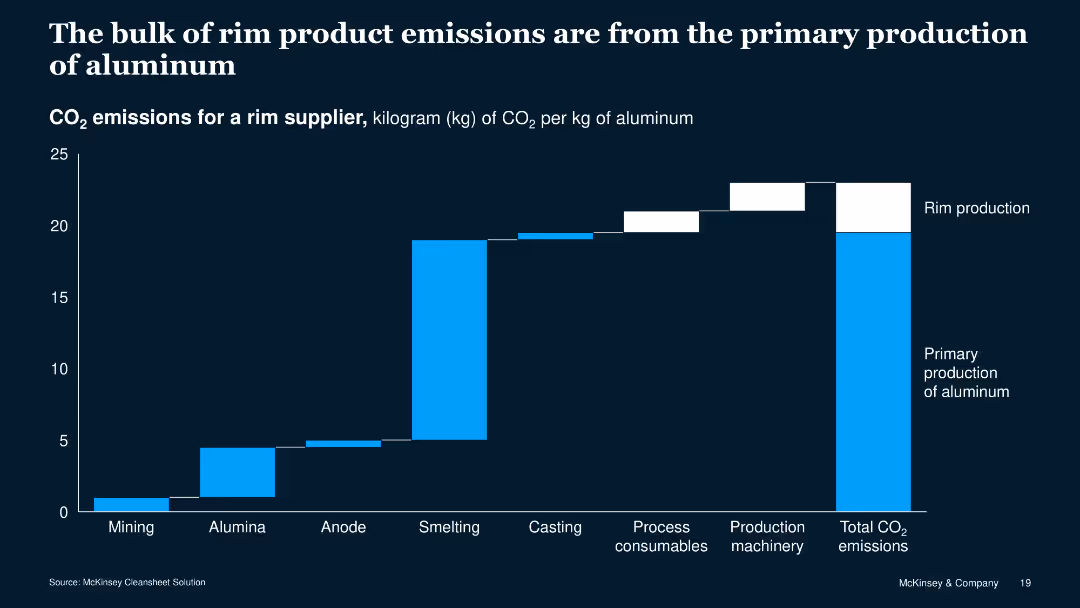
The slide features a column chart with blue and white bars showing CO2 emissions across different production stages of aluminum rims. The chart is against a dark blue background.
Risk Assessment and Management
Industrial & Manufacturing
This slide presents data on CO2 emissions from various stages of aluminum rim production, highlighting that primary production contributes most to the total emissions.
CO2 emissions, aluminum, production stages, data visualization, environment, manufacturing, risk, assessment, management, sustainability
false
The bulk of rim product emissions are from the primary production of aluminumBest Practices in Private Sector Sustainable Procurement
Single Chart
McKinsey
View slide
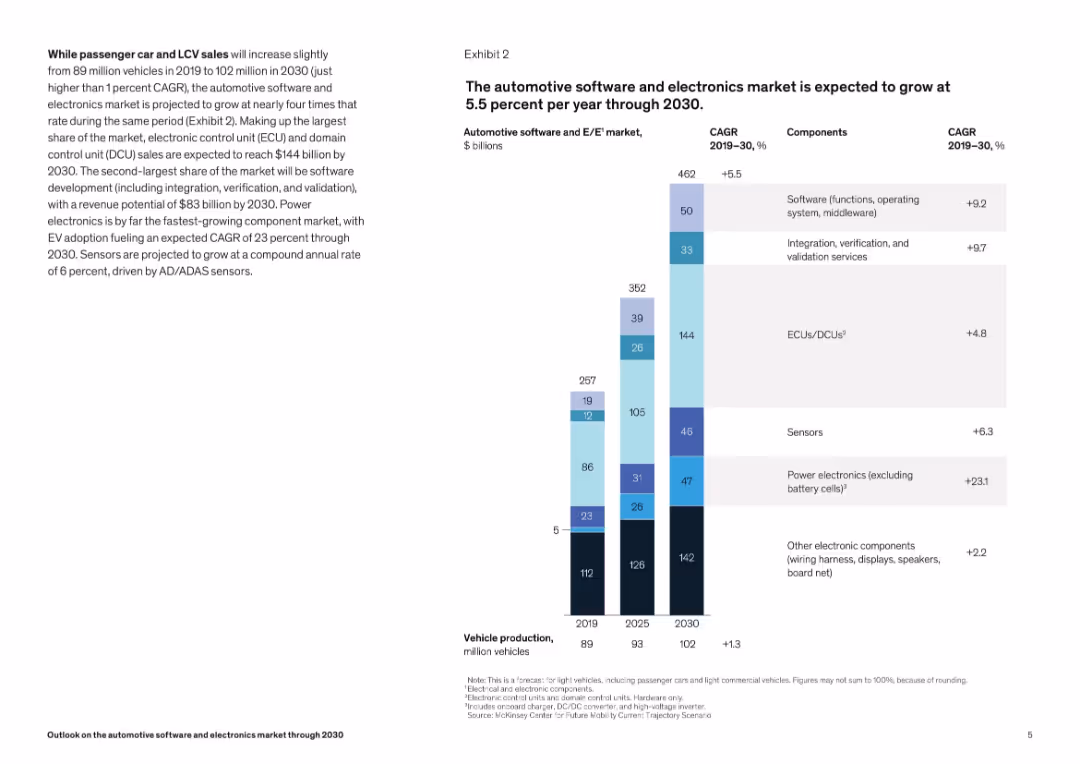
Vertical stacked bar chart by component (ECUs, software, sensors) with CAGR annotations. Right-aligned title and legend.
Technology and Digital Transformation
Industrial & Manufacturing
The slide breaks down projected growth in the automotive electronics sector, emphasizing components like ECUs, software, and power electronics. The chart highlights varying growth rates, with power electronics showing the fastest CAGR.
automotive electronics, CAGR, market growth, ECUs, sensors, power electronics, software, ADAS
false
The automotive software and electronics market is expected to grow at 5.5 percent per year through 2030.Outlook on the automotive software and electronics market through 2030
Mixed Chart
McKinsey
View slide
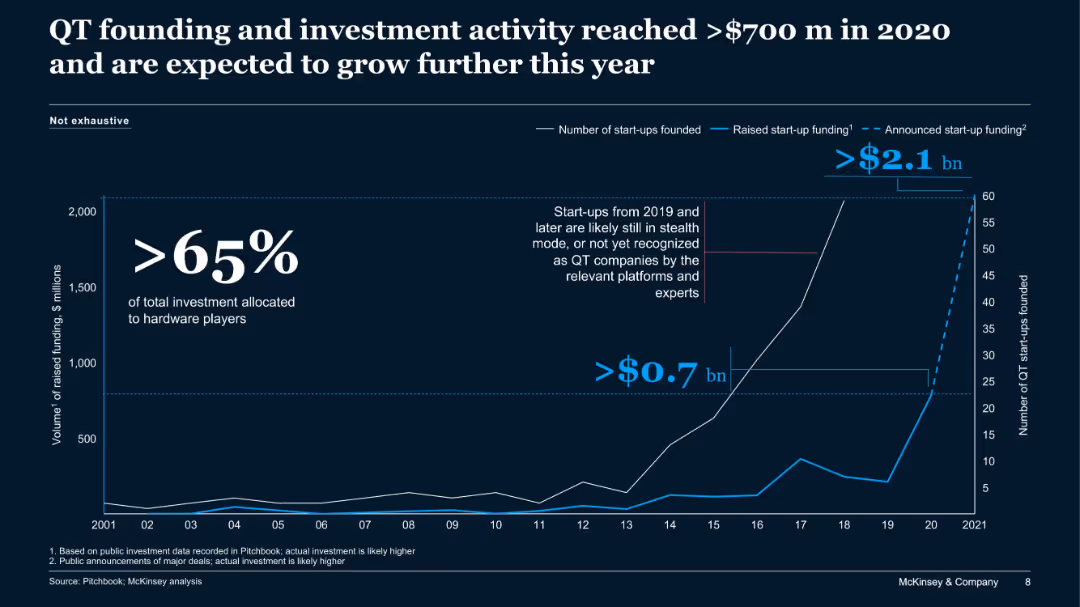
Line chart showing trends in QT start-up funding and number of start-ups from 2001 to 2021, with annotations for stealth and hardware players.
Sales and Business Development
Artificial Intelligence
This slide tracks growth in quantum technology (QT) funding and start-up activity, highlighting over $700M in 2020 and projections for continued growth, particularly in hardware-focused investments.
QT, quantum tech, start-ups, funding, venture capital, hardware, McKinsey
false
QT founding and investment activity reached >$700 m in 2020 and are expected to grow further this yearThe Quantum Technology Monitor September 2021
Single Chart
McKinsey
View slide
Various pie charts illustrating Knorr's global sales, profitability, and market segments. Includes a pie chart for market distribution and column charts for financial metrics.
Product and Service Analysis
Consumer Goods
Provides an in-depth analysis of Knorr’s performance across different market segments, emphasizing its profitability and widespread market presence. Discusses strategic positioning and product diversity.
Knorr, Global Sales, Profitability, Market Segments, Product Diversity
false
Knorr: A €4.4bn mega-brand in practically all countries where Unilever operatesUnilever at Deutsche Bank
Multiple Chart
Deutsche Bank
View slide
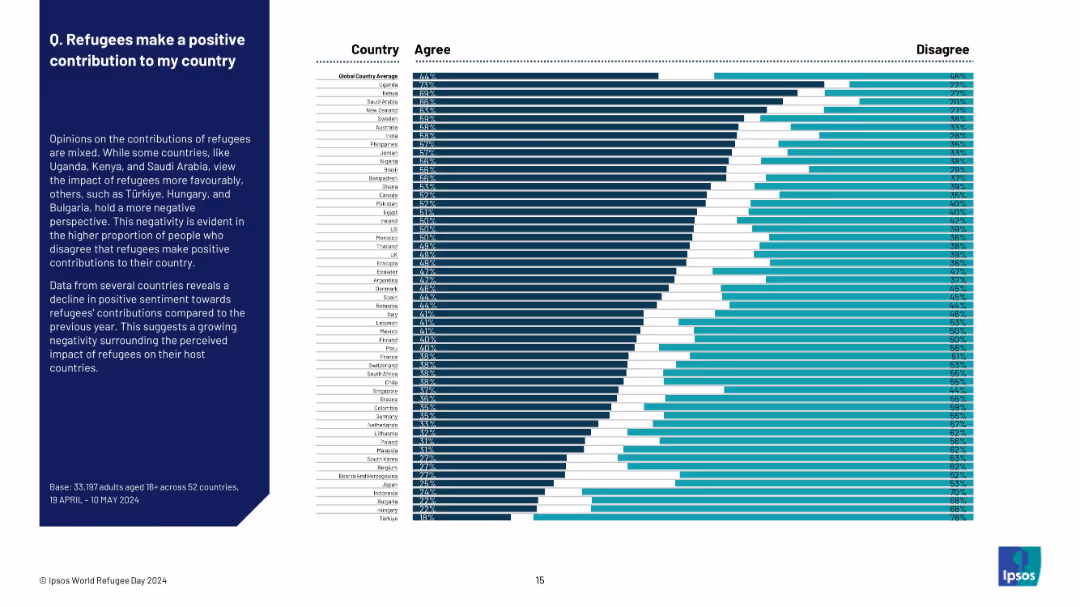
Horizontal bar chart by country showing agreement and disagreement. Explanatory paragraph on left, data on right. Title in bold, structured layout.
Regulatory and Compliance
Government & Public Sector
This slide examines the belief that refugees positively contribute to their host countries. Uganda and Kenya show highest agreement (67%), while Türkiye and Hungary show the least (under 20%). Overall global average agreement is 44%, indicating relatively low positive sentiment. The chart also suggests declining optimism compared to previous years.
refugee contribution, societal benefit, negative sentiment, Ipsos, immigration, public opinion, global attitudes, national rankings
false
Refugees make a positive contribution to my countryWORLD REFUGEE DAY
Mixed Chart
IPSOS
View slide
Features a line chart tracking the revenue of different types of mobile internet advertising in Hong Kong from 2015 to 2024, including mobile video, mobile search, and other mobile display advertising. Each line is color-coded, with highlighted circles emphasizing the CAGR for each category. The slide also includes bullet points summarizing the key drivers of mobile video advertising growth.
Market Analysis and Trends
Media & Entertainment
Focuses on the increasing significance of mobile video in internet advertising revenue in Hong Kong, detailing the growth rates and the impact of factors like 5G and social media platforms on this trend. The slide is intended to inform on the trajectory of mobile advertising expenditures and the evolving landscape of digital media consumption.
mobile video, advertising, growth, CAGR, Hong Kong, 2025, revenue, line chart
false
Mobile video is the key driver in Internet advertising growthGlobal & Entertainment Media Outlook 2021-2025: Hong Kong summary
Mixed Chart
PwC/Strategy&
View slide
This slide features a bar chart under "FIGURE 3" and bulleted points discussing the potential of worker time being augmented/automated by intelligent technologies.
Market Analysis and Trends
Technology & Software
The slide details which roles are most susceptible to automation and augmentation by intelligent technologies, with a focus on how worker activities evolve with these advancements.
Augmentation, Automation, Employment, Trends, AI
false
FIGURE 3: PERCENTAGE OF WORKER TIME POTENTIALLY AUGMENTED / AUTOMATED BY INTELLIGENT TECHNOLOGIESBridging the Skills Gap in the Future Workforce
Mixed Chart
Accenture
View slide
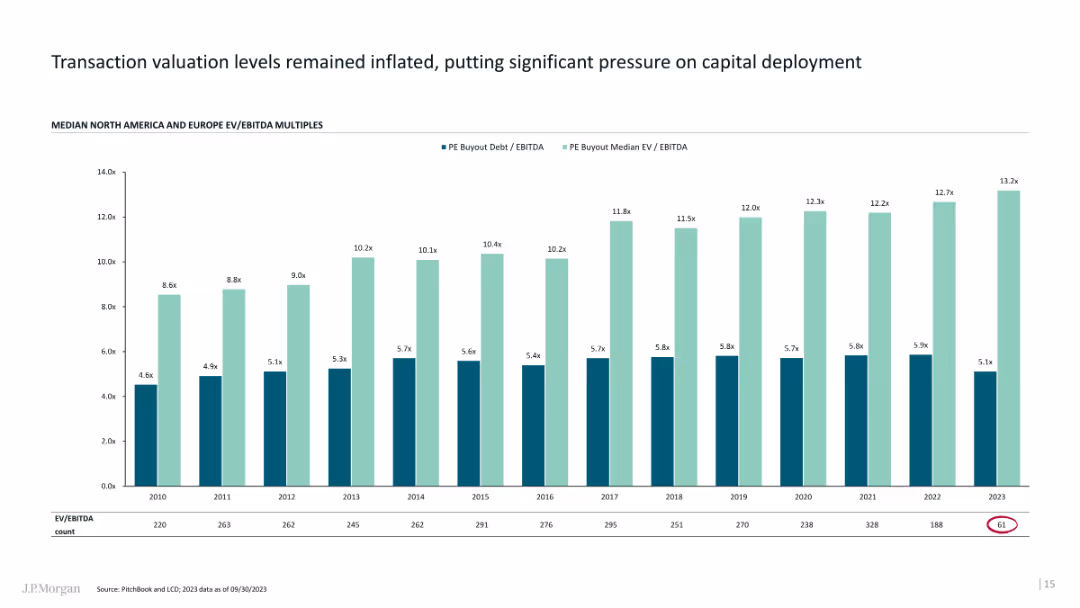
The slide includes column charts showing valuation multiples over time for different regions and types of buyouts.
Financial Performance
Financial Services
The slide examines the inflated transaction valuation levels and their impact on capital deployment strategies.
Transaction valuation, capital deployment, column charts, valuation multiples
false
Transaction valuation levels remained inflated, putting significant pressure on capital deployment12th IBA European Corporate and Private M&A Conference J.P. Morgan 2024 Global M&A Roadmap
Single Chart
JP Morgan
1
...
Next
Load More
Hold On!
We are searching in our database
If nothing, comes up, please try different filters!
Create a FREE account to continue browsing
Receive Instant Access to 1,000+ slides from companies like McKinsey, Google, and Goldman Sachs
First Name
Last Name
Email
Password
I agree to all
Terms & Privacy Policy
Thank you! Your submission has been received!
Oops! Something went wrong while submitting the form.
Have an account?
Sign in
Column Chart
Heatmap
Chevron
Org Chart
Infographic
Callouts
Timeline
List
Graphic
Picture
Process Flow
Diagram
Paragraph
Map
Table
Framework
Subtitle
Takeaway Box
Icon
Other Chart
Radar Chart
Waterfall Chart
Mekko Chart
Pie Chart
Scatter Plot
Line Chart
Bar chart
Bullet points