My Account
My Slides
Search by Category
Templates
View All Templates
Download Template Slides
Leave Feedback
Login
Logout
Get Started
Browse all Slides
Browse all Slides
Create a FREE Account
Instant access to 1,000+ real slides from top companies like McKinsey, BCG, Goldman Sachs, Google and many more!
First Name
Last Name
Email
Password
I agree to all
Terms & Privacy Policy
Thank you! Your submission has been received!
Oops! Something went wrong while submitting the form.
Have an account?
Sign in
Instant access to the internet's best slides
Get access to 40+ advanced filters and more
Advanced Search and Filters
Access to
10,000+ slides
Access to Category Pages
Save/Bookmark Slides
PowerPoint Template Library (New)
Choose your plan
MONTHLY
$12/month
Billed every month, cancel anytime.
YEARLY
$9/month
Billed $108 annually, cancel anytime.
Checkout for $12/month
Checkout for $108/yr
Secured by Stripe | AES-256 bit encryption
Spark Your Next Big Idea with New Presentation Templates
VIEW ALL Templates
Welcome,
Welcome
Upgrade to SlideStart
Pro
Instant access to 15,000+ slides
Show Featured Only
Checkbox 8
Companies
Mckinsey
Bain
BCG
EY
Deloitte
Accenture
PwC/Strategy&
JP Morgan
Goldman Sachs
Morgan Stanley
Citigroup
Deutsche Bank
Barclays
LEK
Kearney
Oliver Wyman
Booz Allen Hamilton
Gartner
IPSOS
Nielsen
Slide type
Header Horizontal
Framework
Vertical Flow
Single Chart
Single Chart
Text Only
Mixed Chart
Header Vertical
Graphic
Pillar
Multiple Chart
Agenda
Title
Table
Linear Flow
Upgrade to SlideStart
Pro
Instant access to 40+ advanced filters
Industry
Upgrade to SlideStart
Pro
Instant access to 40+ advanced filters
Technology
Healthcare
Financial Services
Consumer Goods
Energy & Utilities
Manufacturing
Retail
E-commerce
Logistics
Telecommunications
Real Estate
Professional Services
Education
Media
Entertainment
Hospitatlity
Tourism
Agriculture
Food Production
Government & Public Sector
Environmental
Sustainability
Use Case
Upgrade to SlideStart
Pro
Instant access to 40+ advanced filters
Sales and Business Development
Mergers and Acquisitions
Corporate Finance and Valuation
Performance Metrics and KPIs
Client Case Studies
Competitive Landscape
Product and Service Analysis
Customer and Market Segmentation
Organizational Structure
Human Resources and Talent Management
Industry Overview
Regulatory and Compliance
Risk Assessment and Management
Agriculture & Food Production
Hospitality and Tourism
Government
Environmental
Sustainability
Clear all
Thank you! Your submission has been received!
Oops! Something went wrong while submitting the form.
Show Featured Only
Checkbox 8
Companies
Mckinsey
Bain
BCG
EY
Deloitte
Accenture
PwC/Strategy&
JP Morgan
Goldman Sachs
Morgan Stanley
Citigroup
Deutsche Bank
Barclays
LEK
Kearney
Oliver Wyman
Booz Allen Hamilton
Gartner
IPSOS
Nielsen
Slide type
Text Only
Linear Flow
Vertical Flow
Single Chart
Header Horizontal
Mixed Chart
Header Vertical
Pillar
Multiple Chart
Graphic
Agenda
Title
Table
Framework
Industry
Technology
Healthcare
Financial Services
Consumer Goods
Energy & Utilities
Manufacturing
Retail
E-commerce
Logistics
Telecommunications
Real Estate
Professional Services
Education
Media
Entertainment
Hospitatlity
Tourism
Agriculture
Food Production
Government & Public Sector
Environmental
Sustainability
Use Case
Sales and Business Development
Mergers and Acquisitions
Corporate Finance and Valuation
Performance Metrics and KPIs
Client Case Studies
Competitive Landscape
Product and Service Analysis
Customer and Market Segmentation
Organizational Structure
Human Resources and Talent Management
Industry Overview
Regulatory and Compliance
Risk Assessment and Management
Agriculture & Food Production
Hospitality and Tourism
Government
Environmental
Sustainability
Clear all
Thank you! Your submission has been received!
Oops! Something went wrong while submitting the form.
Tag
View slide
Graphical elements and text boxes detail the loyalty program structures and impacts on a Japanese e-commerce and media company's market growth.
Customer and Market Segmentation
Retail & E-commerce
This slide showcases the success of a loyalty program in retaining market leadership and expanding market share, highlighting the incentives and rewards that encourage repeat customer engagement in a Japanese e-commerce context.
Loyalty programs, e-commerce, Japan, market growth
false
Loyalty: Japanese ecommerce & media companyDigital consumer spending in India: A $100 Bn opportunity
Framework
BCG
View slide
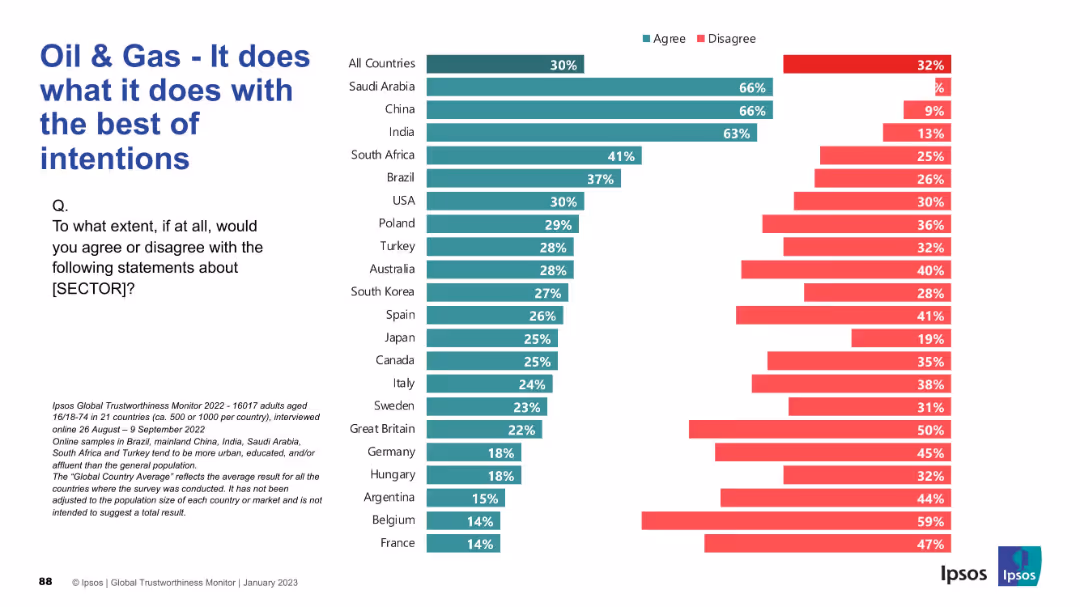
Bar chart comparing agreement and disagreement across countries with the statement. Left-aligned title and question, horizontal bars with green (agree) and red (disagree).
Market Analysis and Trends
Energy & Utilities
This slide presents public opinion across 21 countries on whether the oil & gas sector operates with the best of intentions. Agreement is highest in Saudi Arabia, China, and India, with European countries showing more disagreement.
Oil & Gas, Trust, Global Survey, Intentions, Public Perception, Ipsos, Country Comparison, Sector Sentiment, Energy, Opinions
false
Oil & Gas - It does what it does with the best of intentionsIPSOS GLOBAL TRUSTWORTHINESS MONITOR January 2023
Mixed Chart
IPSOS
View slide
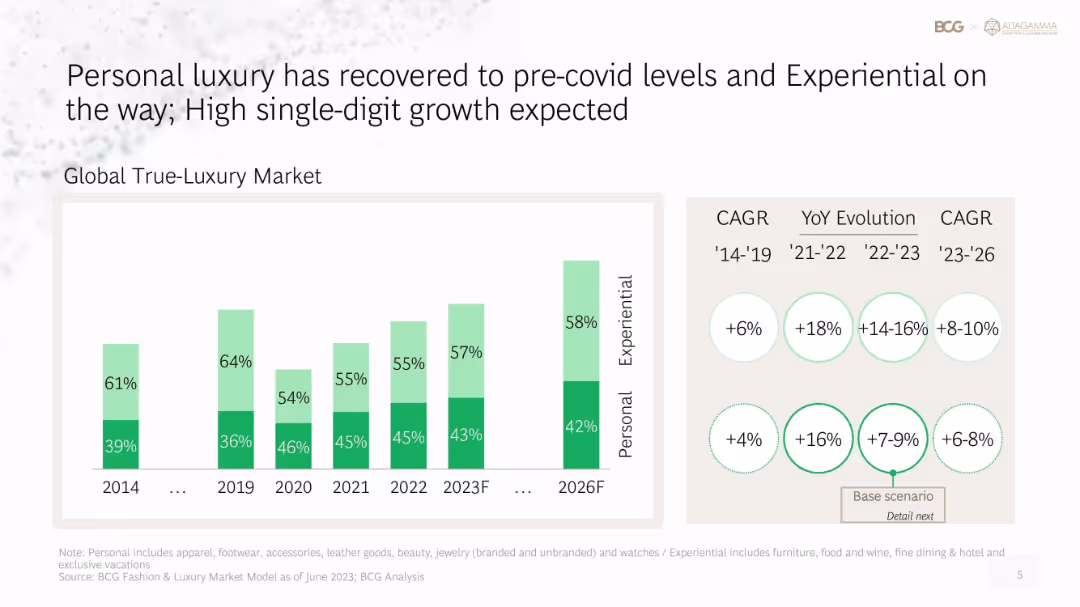
Bar graph of global true-luxury market split (personal vs. experiential), CAGR evolution shown in bubbles
Market Analysis and Trends
Consumer Goods
This slide showcases the rebound of the personal luxury market and the rise of experiential luxury. Growth metrics from 2014 to 2026 are visualized through a bar graph and CAGR bubbles, highlighting recovery from Covid and expected strong performance ahead.
luxury market, experiential, personal goods, CAGR, recovery, growth forecast, BCG, consumer behavior
false
Personal luxury has recovered to pre-covid levels and Experiential on the way; High single-digit growth expectedTrue-Luxury Global Consumer Insights
Single Chart
BCG
View slide
Circular diagram categorizing various frontier technologies (e.g., AI, blockchain) and a bar chart projecting the global market size of these technologies from 2018 to 2025.
Technology and Digital Transformation
Technology & Software
This slide categorizes emerging frontier technologies and projects their market sizes up to 2025. It highlights the expected growth in technologies like AI, IoT, and blockchain, emphasizing their potential impact on future economic landscapes.
Frontier Technologies, Market Size, AI, IoT, Blockchain
false
Selected technologies will see a tenfold increase in market size An analysis of relevant innovations up to 2050 is called forMegatrend 5 - Technology & Innovation
Mixed Chart
Roland Berger
View slide
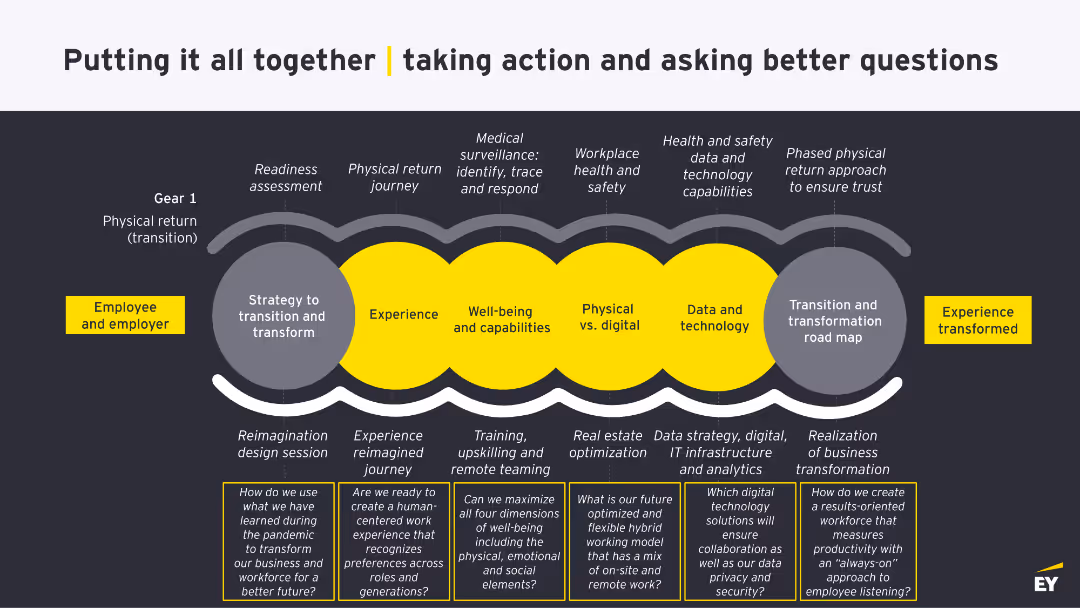
A diagram showing a multi-phase approach to transition and transformation, featuring elements like experience, well-being, physical vs. digital, data and technology.
Strategic Planning
Professional Services
This slide outlines a comprehensive strategy for transitioning and transforming business operations, focusing on employee experience, digital transformation, and safety measures.
Rewards, Benefits, Compensation, COVID-19, Employee Expectations
false
Putting it all together | taking action and asking better questionsPhysical return and work reimagined study
Linear Flow
EY
View slide
A slide with multiple data presentations: bar graphs and a line graph, along with text explanations.
Risk Assessment and Management
Financial Services
This slide discusses commercial real estate (CRE) loan portfolios, risk management, and market competition. It's used for financial analysis and risk assessment in real estate banking.
CRE, Risk Management, Portfolio, Loans, Market, Banking, Real Estate, Analysis
false
Maintaining risk discipline – CRECOMMERCIAL BANKING 2020
Multiple Chart
JP Morgan
View slide
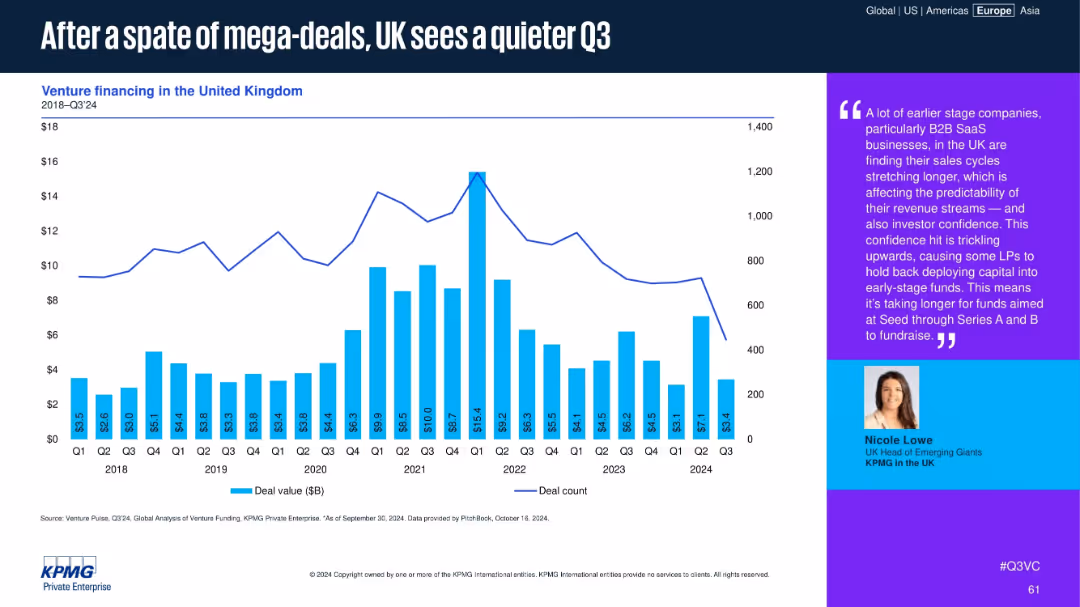
Bar chart overlaid with a line graph showing venture financing deal value and count in the UK from 2018 to Q3 2024. Commentary on the right side with expert quote and photo.
Market Analysis and Trends
Financial Services
UK venture financing shows a notable Q3 slowdown after previous mega-deals, especially among early-stage B2B SaaS firms. The commentary highlights LP hesitancy and longer fundraising cycles amid uncertain revenue predictability.
UK, venture financing, SaaS, deal volume, early-stage, LP confidence, Q3 slowdown, fundraising, seed funds, Series A
false
After a spate of mega-deals, UK sees a quieter Q3Venture Pulse Q3 2024
Mixed Chart
KPMG
View slide
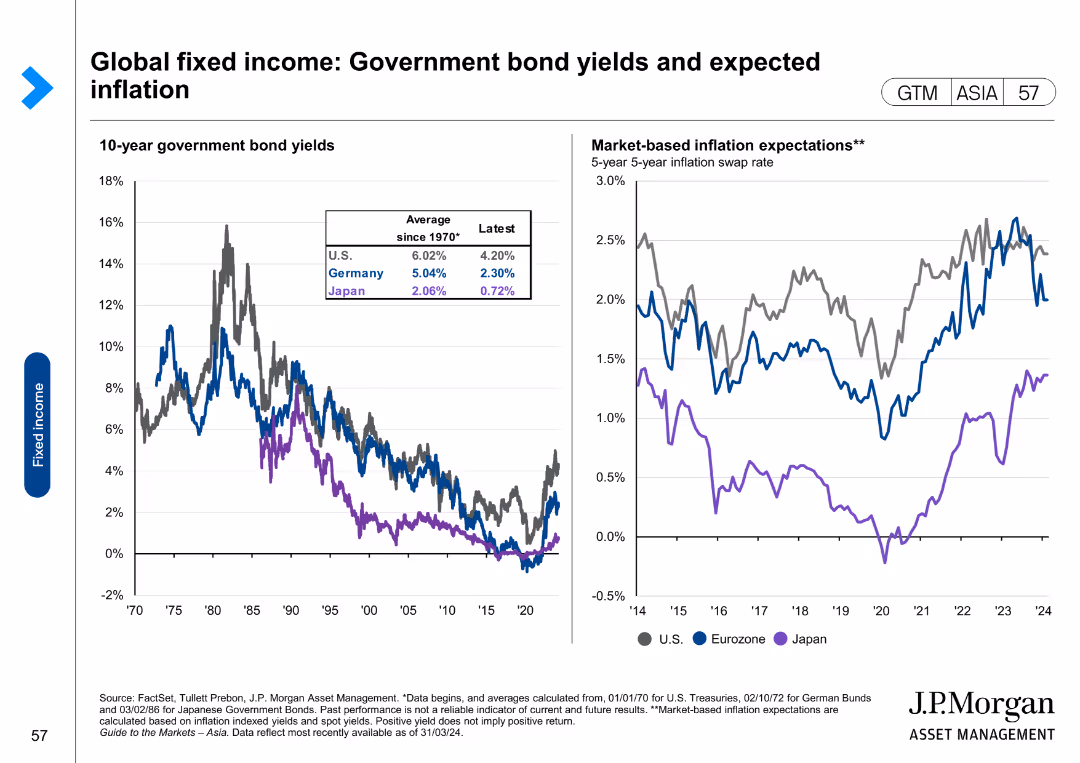
The slide includes two line charts. The first chart shows 10-year government bond yields for the U.S., Germany, and Japan over time. The second chart shows market-based inflation expectations for the same regions.
Financial Performance
Financial Services
This slide examines government bond yields and expected inflation for the U.S., Germany, and Japan, providing insights into fixed income performance and economic expectations.
Government bonds, yields, expected inflation, U.S., Germany, Japan, fixed income, financial performance
false
Global fixed income: Government bond yields and expected inflationGuide to the Markets Asia | 2Q 2024
Multiple Chart
JP Morgan
View slide
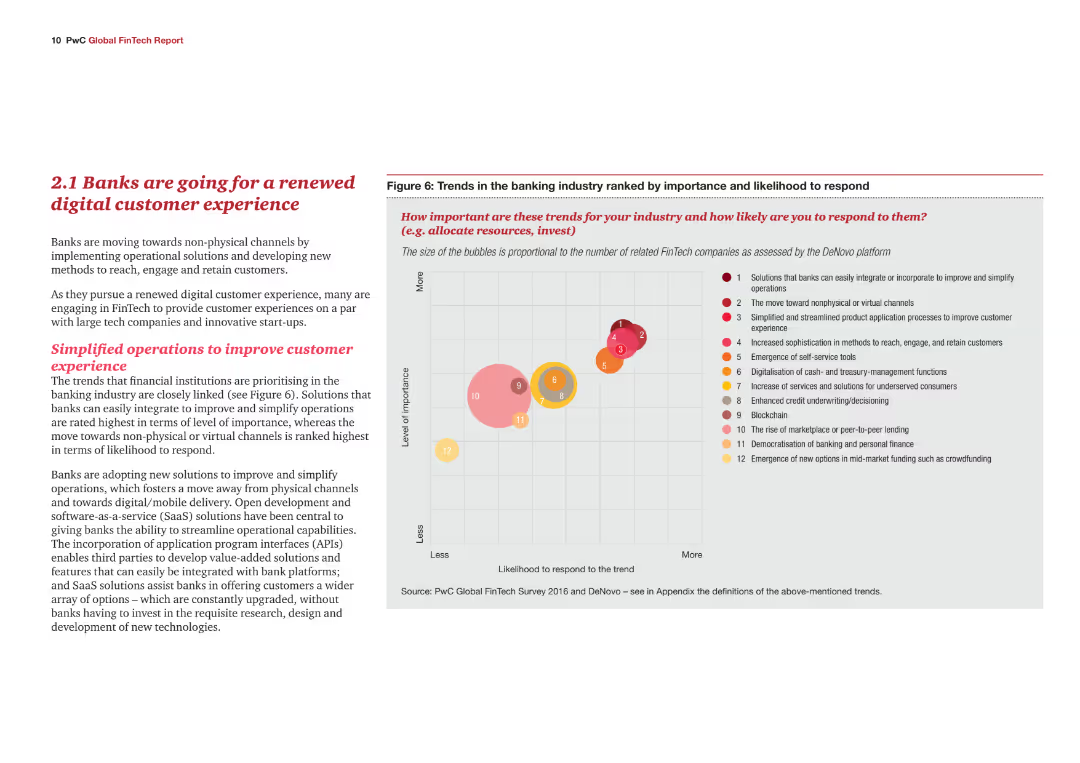
A content slide with text explaining the trends in the banking industry towards digital customer experiences. Includes a bubble chart ranking various trends in terms of importance and likelihood to respond.
Market Analysis and Trends
Financial Services
This slide highlights the shift in the banking industry towards enhancing digital customer experiences. It identifies key trends and their importance, supported by a bubble chart that ranks these trends based on their perceived significance and likelihood of adoption.
Banking, digital customer experience, trends, importance, likelihood to respond, bubble chart
false
2.1 Banks are going for a renewed digital customer experienceBlurred lines: How FinTech is shaping Financial Services
Mixed Chart
PwC/Strategy&
View slide
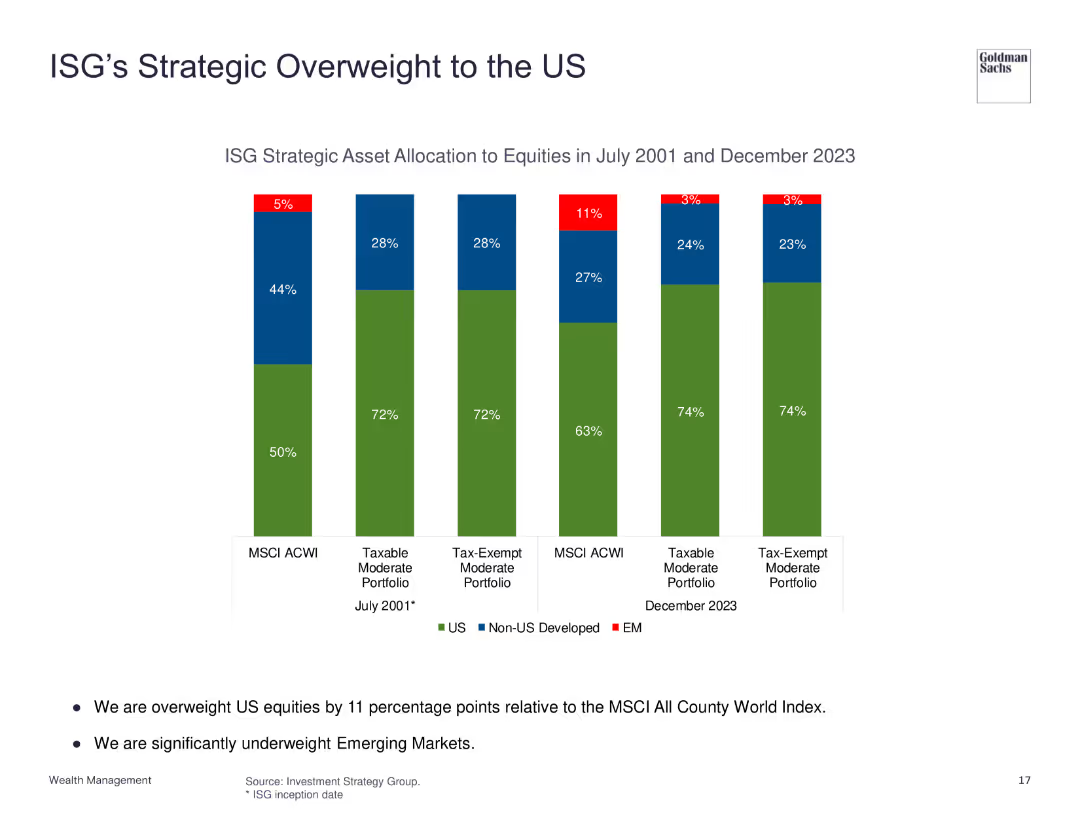
The slide shows column charts comparing ISG's asset allocation to equities in 2001 and 2023, highlighting an increased overweight to US equities.
Strategic Planning
Financial Services
The slide illustrates ISG's strategic decision to overweight US equities, showing the changes in asset allocation over time and the focus on US market investments compared to non-US developed and emerging markets.
ISG, Strategy, Asset Allocation, US Equities, Overweight
false
ISG’s Strategic Overweight to the USInvestment Strategy Group
Single Chart
Goldman Sachs
View slide
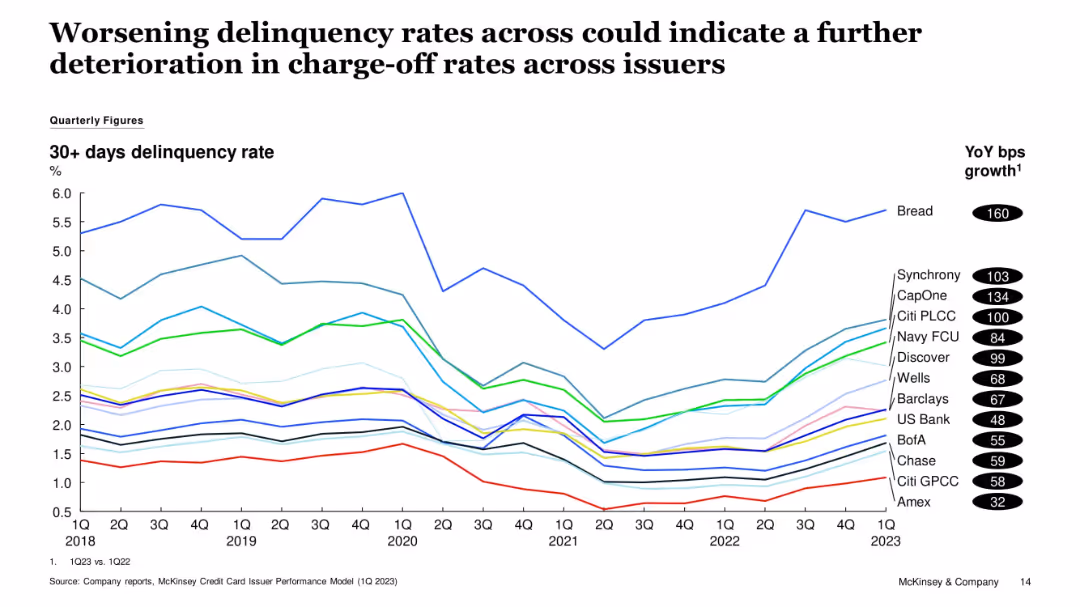
Time series line chart showing 30+ days delinquency rates by issuer from 1Q18 to 1Q23. Bread shows the highest increase. YoY bps growth listed on the right.
Risk Assessment and Management
Financial Services
The chart shows a worsening trend in delinquency rates among issuers, especially Bread, CapOne, and Synchrony. This suggests potential for higher future charge-off rates. The data spans 5 years with consistent issuer tracking.
Delinquencies, Credit Cards, CapOne, Synchrony, Bread, Risk Trends
false
Worsening delinquency rates across could indicate a further deterioration in charge off rates across issuersUS Credit Card Issuer Performance, 1Q 2023
Single Chart
McKinsey
View slide
Slide with headers and structured bullet points on one side and a flow diagram on the other, with a red and black design theme.
Financial Performance
Industrial & Manufacturing
Describes the Input-Output modeling used to assess the Tempest program's economic contribution to the UK supply chain.
Input-Output analysis, supply chain, GVA, employment, Tempest, economic contribution, UK
false
Input-Output analysis is used to estimate the effect on GVA and employment through the supply chainAssessment of the expected economic impact of the Tempest Programme (2021-2050)
Diagram
PwC/Strategy&
View slide
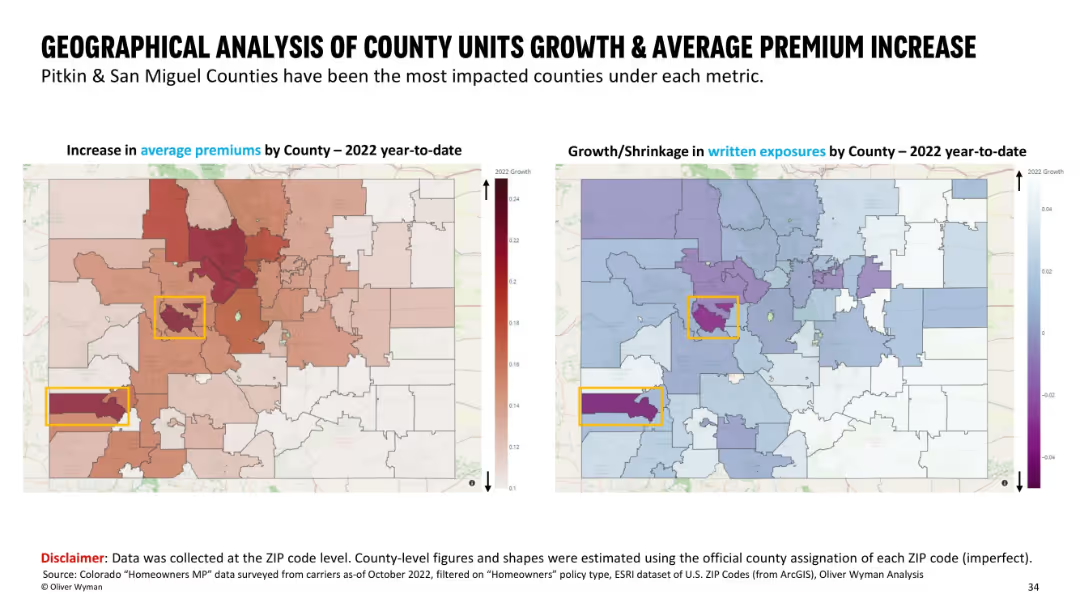
Side-by-side maps with county boundaries; left shows premium increases using a red heatmap, right shows growth/shrinkage in exposures with a blue/purple color scheme. Highlighted counties are boxed in yellow.
Market Analysis and Trends
Financial Services
This slide presents a county-level geographical comparison in Colorado, showing average premium increases and written exposure changes for 2022 YTD. Pitkin and San Miguel counties are highlighted as the most impacted. Visual heatmaps help emphasize regional differences in insurance metrics across ZIP codes mapped to counties.
geographic, premium increase, insurance, county analysis, written exposures, ZIP code, heatmap, Colorado
false
GEOGRAPHICAL ANALYSIS OF COUNTY UNITS GROWTH & AVERAGE PREMIUM INCREASEHomeowner availability study
Multiple Chart
Oliver Wyman
View slide
Comprising a mix of text and graphical elements, this slide utilizes horizontal bar charts to depict statistical data on reasons for employment changes, with clearly delineated sections and color-coding for easy comprehension.
Market Analysis and Trends
Professional Services
This slide provides a detailed analysis of the factors leading to women quitting jobs, emphasizing the lack of flexibility in working hours. It's suitable for analyzing workforce trends and informing policies on work flexibility.
flexibility, employment, women, quitting, data
false
Lack of flexibility in working hours is driving women to quit Women @ Work 2023: 4 Women are seeking more flexibility and making career choices accordingly
Multiple Chart
Deloitte
View slide
The slide presents data via column charts and mobile app screenshots. It shows a trend from 2019 to 2022 in digital payments, mobile engagement, and use of the Chase app.
Market Analysis and Trends
Financial Services
Demonstrates customer trends in digital and mobile banking. Highlights the shift to digital payments and increase in mobile app usage for financial management with statistical data and representative imagery.
digital, mobile engagement, banking, app usage, payment trends, financial management, statistical data, Chase, user interface, market shift
false
Our customers engage with Chase to make payments and manage their financesInverstors Day 2023
Multiple Chart
JP Morgan
View slide
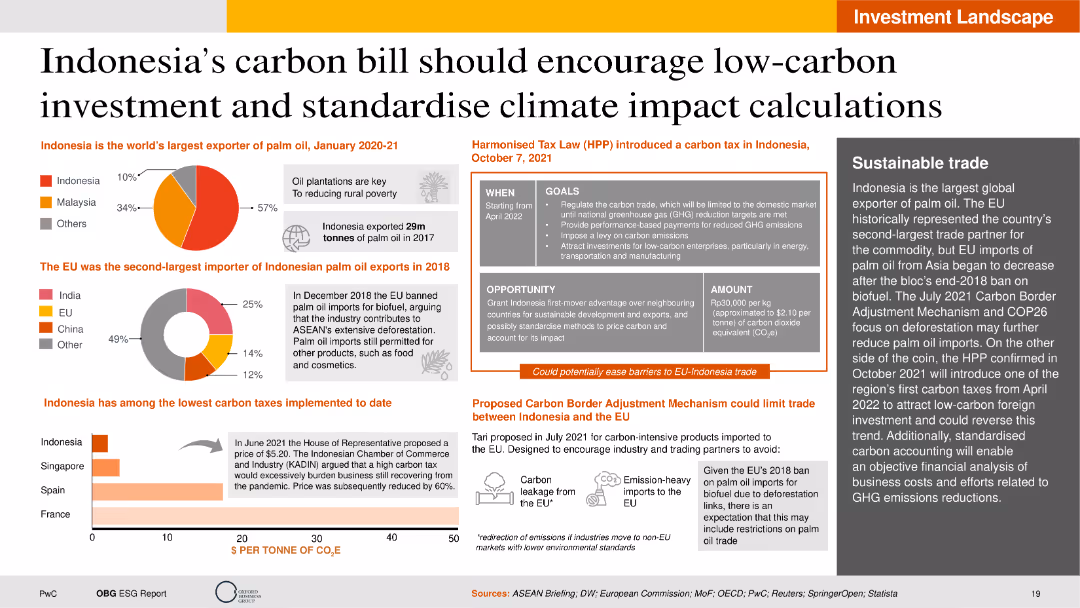
This slide contains pie charts, column charts, and tables, providing visual representations of Indonesia's carbon bill, global palm oil exportation data, and carbon tax implementations. The layout is detailed, with varied graphical data and supporting text.
Regulatory and Compliance
Energy & Utilities
The slide explains the implications of Indonesia's carbon bill in encouraging low-carbon investments and standardizing climate impact calculations. It details the global export of palm oil, EU import bans, and the harmonized tax law for carbon taxation in Indonesia. It also presents a comparative analysis of carbon taxes implemented by different countries and the potential effects of the carbon border adjustment mechanism.
Carbon bill, low-carbon investment, palm oil export, carbon tax, EU ban
false
Indonesia’s carbon bill should encourage low-carbon investment and standardise climate impact calculationsIndonesia’s Sustainable Transformation
Multiple Chart
PwC/Strategy&
View slide
This slide presents a simple graph with a horizontal continuum labeled from "Low Severity" to "Severely Adverse," with "Frequency" as the vertical axis. The graph is accompanied by a title and an explanatory subtitle.
Risk Assessment and Management
Financial Services
The slide focuses on managing across the risk continuum, with a visual representation of risk severity versus frequency. It can be used to discuss risk management strategies, particularly in preparing for varying degrees of financial risk scenarios.
risk appetite, cycle preparedness, frequency, severity, financial
false
Risk Appetite and Cycle PreparednessGoldman Sachs Investor Day
Text Only
Goldman Sachs
View slide
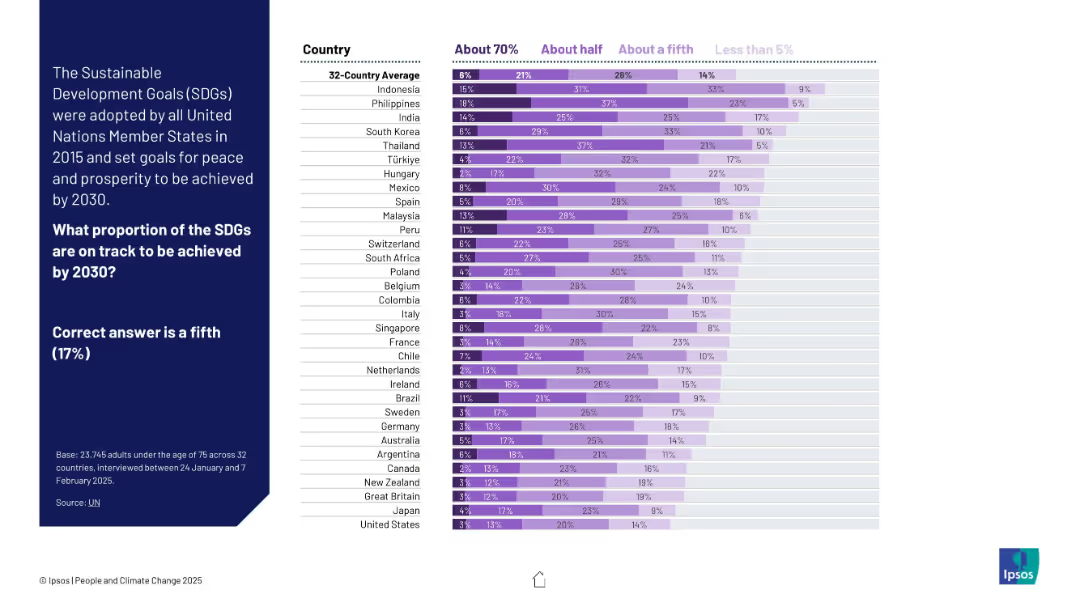
Stacked bar chart using shades of purple to show estimates across countries. Left panel provides correct answer (17%) for reference.
Industry Overview
Government & Public Sector
The chart shows how people estimate progress toward UN Sustainable Development Goals by 2030. Many overestimate; few select the accurate proportion (about one-fifth).
SDGs, sustainable development, UN goals, public awareness, global perception, Ipsos, progress tracking, purple chart, development targets, 2030 goals
false
What proportion of the SDGs are on track to be achieved by 2030?PEOPLE AND CLIMATE CHANGE
Mixed Chart
IPSOS
View slide
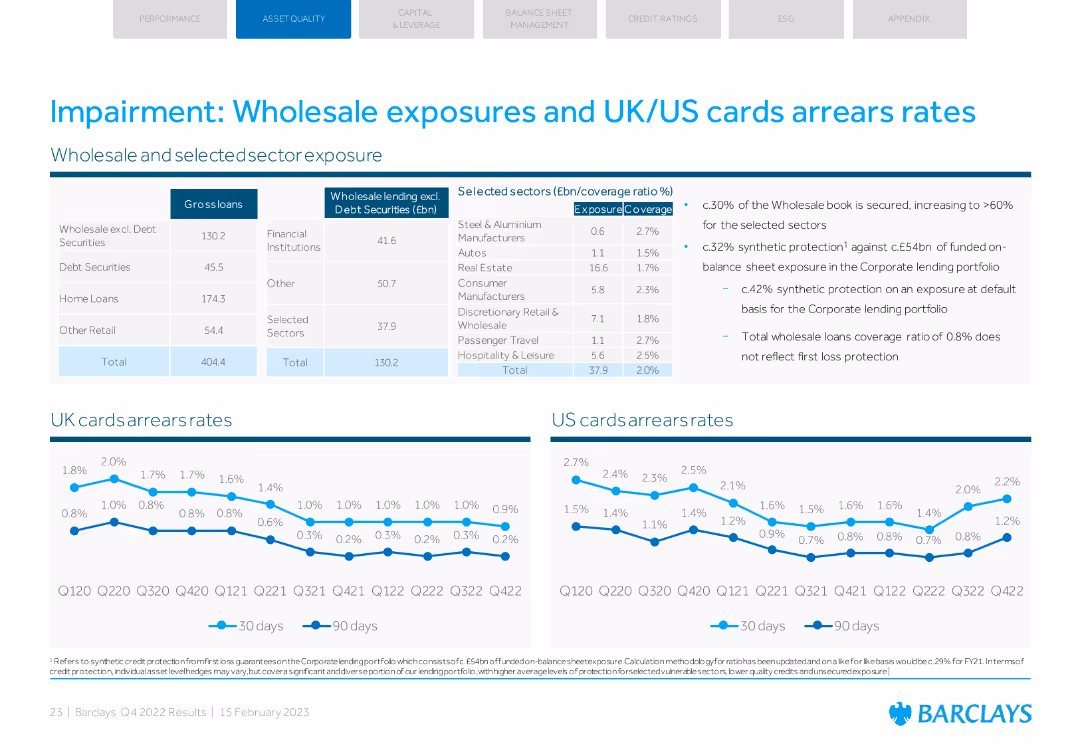
Tables and line charts showing gross loans, lending by sector, and arrears rates for UK and US cards.
Risk Assessment and Management
Financial Services
Detailed analysis of wholesale exposures and arrears rates for UK and US cards, with sector-specific data.
wholesale exposure, arrears rates, UK cards, US cards, sector exposure
false
Impairment: Wholesale exposures and UK/US cards arrears ratesBarclays PLC Q4 2022 Fixed Income Investor Presentation
Multiple Chart
Barclays
View slide
Panel layout with income by business and type; cost bar charts and risk-weighted assets at bottom
Financial Performance
Financial Services
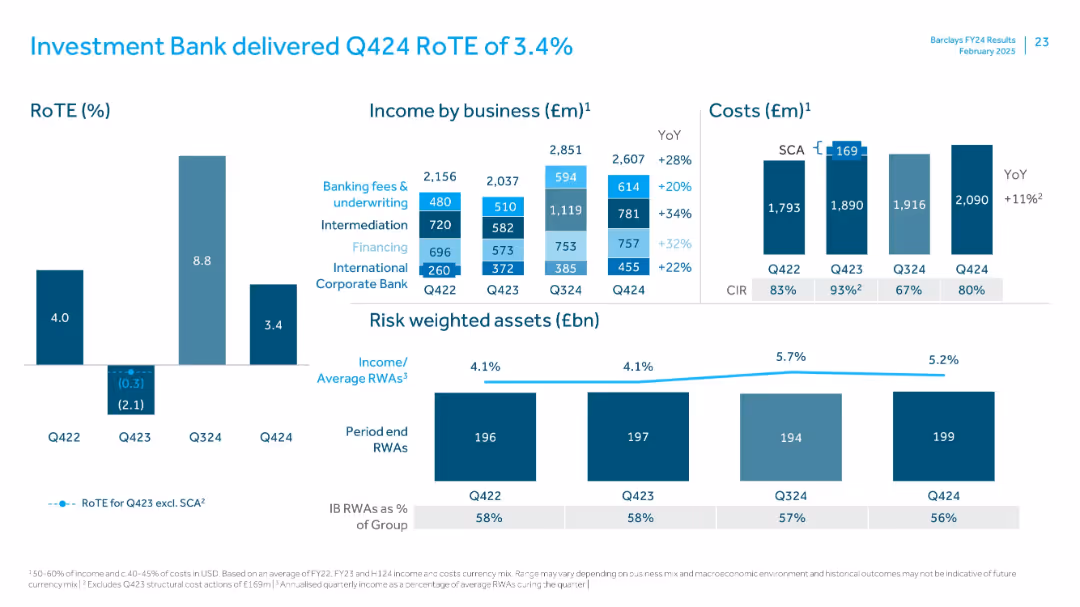
Breaks down Investment Bank’s income across key services—fees, intermediation, financing. RoTE is relatively low. Expenses and risk-weighted assets are charted, with commentary on CIR improvement and business mix effects.
Investment Bank, RoTE, income breakdown, risk-weighted assets, CIR, financing, underwriting
false
Investment Bank delivered Q424 RoTE of 3.4%FY 2024 Results Presentation
Multiple Chart
Barclays
View slide
The slide includes a dashboard with pie charts and column charts, showcasing customer accounts, revenue per product, and revenue per customer type, all displayed clearly.
Financial Performance
Energy & Utilities
The slide offers insights into customer accounts and revenue distribution by product and customer type, using various graphical representations to illustrate the data effectively.
customer accounts, revenue, product, customer type, utilities
false
Additional Information Customer Accounts and Revenue per Product and Customer Type*SAP Innovation Awards 2022 Entry Pitch Deck
Multiple Chart
EY
View slide
The slide features a pie chart showing the resources CFOs need to deliver on their priorities, such as investment, alignment, skills, and bandwidth. The text provides an overview of the key factors affecting CFOs' ability to achieve their goals.
Human Resources and Talent Management
Financial Services
Discusses the resources necessary for CFOs to achieve their business priorities, including investment in IT infrastructure, stakeholder alignment, and team skills. The pie chart visually represents the distribution of these resources, highlighting the critical areas for successful financial management.
CFO, Resources, Priorities, Investment, Skills
false
Key research findings Chart 5 – Resources CFOs need to deliver on their prioritiesThe importance of being human in a digital world
Mixed Chart
Deloitte
View slide
Horizontal bar charts comparing agreement and disagreement on statements about societal change, conflict, immigration, and leadership, with a focus on specific concerns.
Market Analysis and Trends
Government & Public Sector
This slide addresses concerns related to rapid societal changes, such as values conflict, immigration issues, and weak leadership, highlighting agreement and disagreement levels.
societal change, conflict, immigration, leadership, concerns, bar chart, agreement, disagreement
false
Perceptions of a society changing too fast are often linked to concerns over values conflict, immigration and weak leadershipA NEW WORLD DISORDER?
Mixed Chart
IPSOS
View slide
The slide has a title, three key points with icons, and a small text disclaimer at the bottom. It uses a clean layout with red and black text.
Investment Analysis
Financial Services
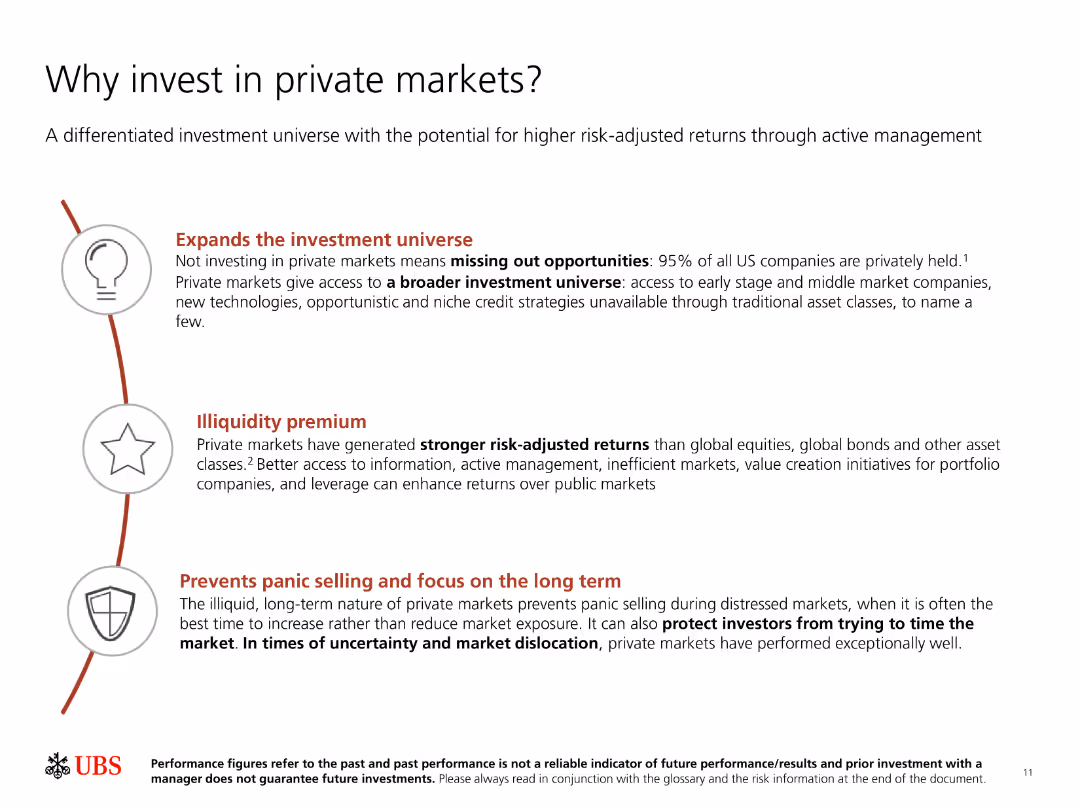
Highlights reasons to invest in private markets, including expanding investment universe, capturing illiquidity premium, and avoiding panic selling during downturns.
Private markets, investment, returns, illiquidity premium, risk management
false
Why invest in private markets?Private markets asset allocation guide
Vertical Flow
UBS
View slide
Circular flowchart divided into segments like Contract Authoring, Performance Management, and Financial Management, with SirionLabs at the center. Uses a color gradient to differentiate the areas of application.
Technology and Digital Transformation
Technology & Software
Outlines SirionLabs' comprehensive approach to managing complex contracts through integrated solutions in various management areas, emphasizing the synergy between technology and contract lifecycle management.
SirionLabs, Solution, Contract, Management, Technology
false
Sirion’s end-to-end solution for managing complex contractsThe Future of Procurement: Why is Technology Lagging Behind?
Framework
Kearney
View slide
Bar chart waterfall showing EBITDA change from 9M 2022 to 9M 2023 with explanatory annotations, titled headers and summary at top.
Financial Performance
Industrial & Manufacturing
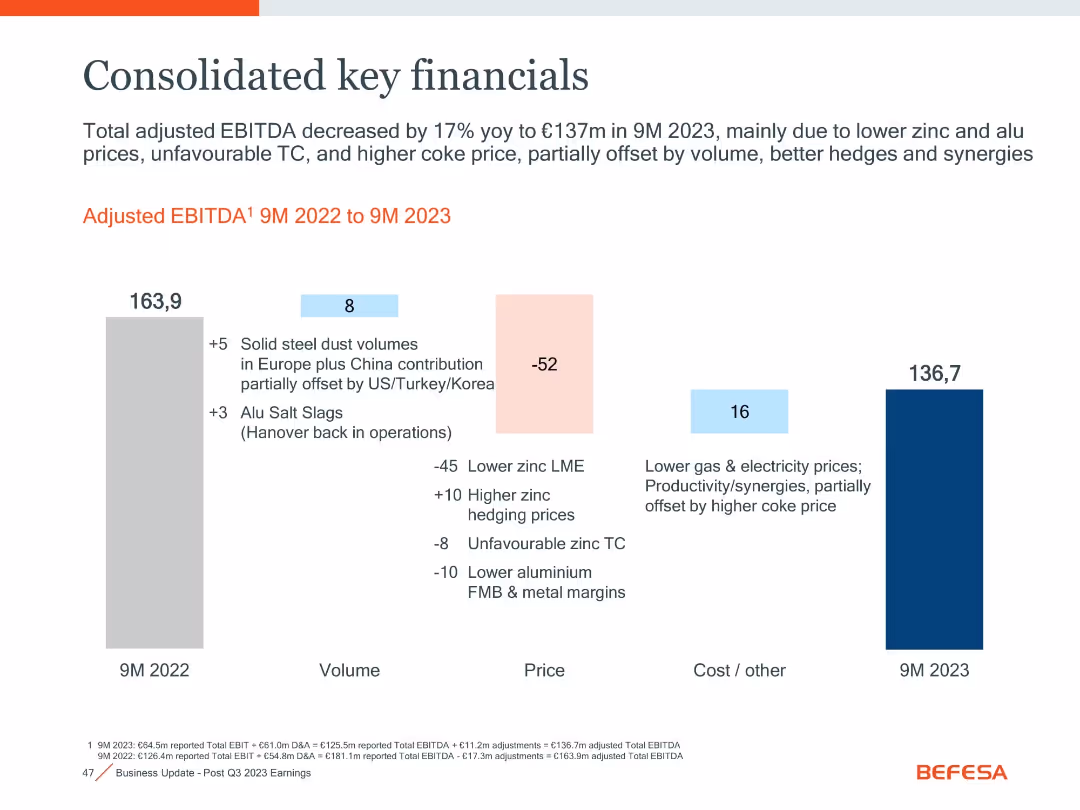
Shows 17% YoY decline in adjusted EBITDA to €137m in 9M 2023, attributed to lower zinc/aluminum prices and higher costs, partially offset by improved volumes, hedges, and synergies.
EBITDA, zinc prices, aluminum margins, hedging, synergies, YoY comparison
false
Consolidated key financialsGoldman Sachs 4th Annual Carbonomics Conference
Single Chart
Goldman Sachs
View slide
The slide features a detailed flowchart showing biomass feedstock market dynamics, including land demand, land use, consumption pattern, biomass residues, primary biomass, and bioenergy consumption. It illustrates the drivers for biomass residues and primary biomass.
Market Analysis and Trends
Energy & Utilities
This slide analyzes the market dynamics of biomass feedstock, detailing the factors influencing land demand, consumption patterns, and the production of biomass residues and primary biomass, as well as their implications for bioenergy consumption.
biomass feedstock, market dynamics, land demand, land use, consumption pattern, biomass residues, primary biomass, bioenergy consumption
false
Biomass feedstock market dynamicsDeveloping sustainable carbon circularity Looking at advanced applications and business models
Linear Flow
Kearney
View slide
Circular diagram representing the innovation cycle, with segments for inception, value creation, adoption & diffusion, and impacts. Text explains the dynamic process of innovation in economic and social contexts.
Technology and Digital Transformation
Technology & Software
The slide presents the innovation cycle, illustrating the stages from inception to wider impacts. It discusses the dynamic nature of innovation, emphasizing the importance of R&D, adoption, and diffusion for achieving significant economic and social benefits.
Innovation Cycle, R&D, Economic Impact
false
Technology and innovation are deeply entangled with economy and society Successful technology asserts itself passing through the innovation cycleMegatrend 5 - Technology & Innovation
Linear Flow
Roland Berger
View slide
Horizontal bar chart showing most important issues facing Britain in March 2025.
Market Analysis and Trends
Government & Public Sector
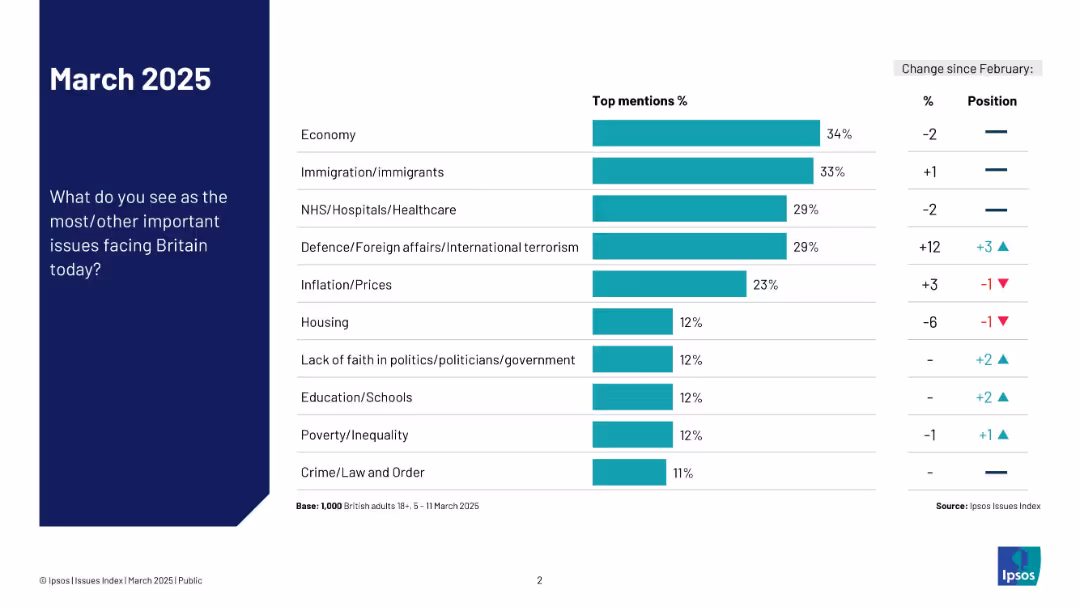
The chart displays survey responses on the most important issues in Britain, with the economy, immigration, and healthcare as the top concerns. A sidebar notes changes in rankings compared to February 2025, highlighting shifts in public attention to topics like defense and inflation.
Britain, public opinion, 2025, issues, Ipsos, survey, economy, healthcare, politics, immigration
false
March 2025Ipsos Issues Index March 2025
Mixed Chart
IPSOS
View slide
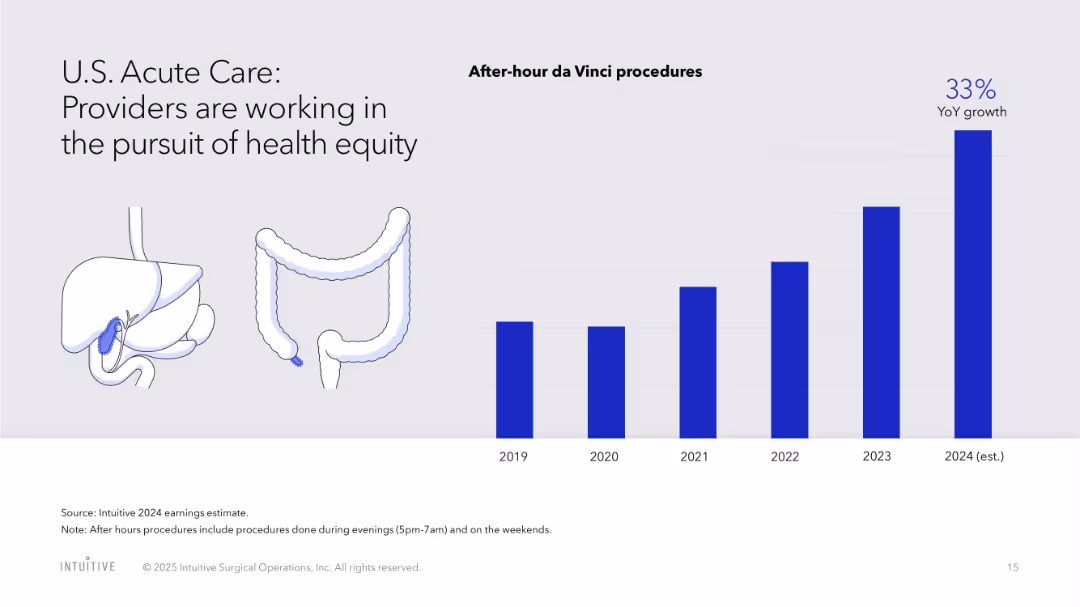
Bar chart for after-hour procedures and illustrative visuals of human anatomy
Human Resources and Talent Management
Healthcare & Pharmaceuticals
Emphasizes the expansion of after-hour da Vinci procedures to enhance healthcare equity, alongside visuals of organs typically treated.
acute care, health equity, after-hours surgery, access, da Vinci, growth, healthcare disparity
false
U.S. Acute Care: Providers are working in the pursuit of health equityJ.P. Morgan Healthcare Conference 2025
Single Chart
JP Morgan
View slide
This slide has a complex layout, divided into three main sections with headers and explanatory text below each section. It features two columns of text-based lists, a matrix of labeled squares, and footnotes. The design is blue and white with high contrast.
Industry Overview
Technology & Software
The slide provides an overview of significant technologies and areas of interest within Web3, including applications, technologies, and digital assets like DeFi, gaming, and the metaverse. It’s structured to educate on the foundational aspects of Web3 and how they're employed across different domains.
Web3, DeFi, Metaverse, Digital Assets, Technology
false
What are the most noteworthy technologies and areas of interest?McKinsey Technology Trends Outlook 2022 Web3
Header Vertical
McKinsey
View slide
Slide displays multiple column charts comparing year-over-year changes in market share and client engagement across banking services such as investments and payments.
Market Analysis and Trends
Financial Services
Details strategies to increase revenue through enhanced client services and market share growth in banking sectors like investment and commercial banking.
banking, revenue, growth, market, services
false
Accelerate franchise momentum Significant revenue opportunitiesBarclays Global Financial Services Conference
Multiple Chart
Barclays
View slide
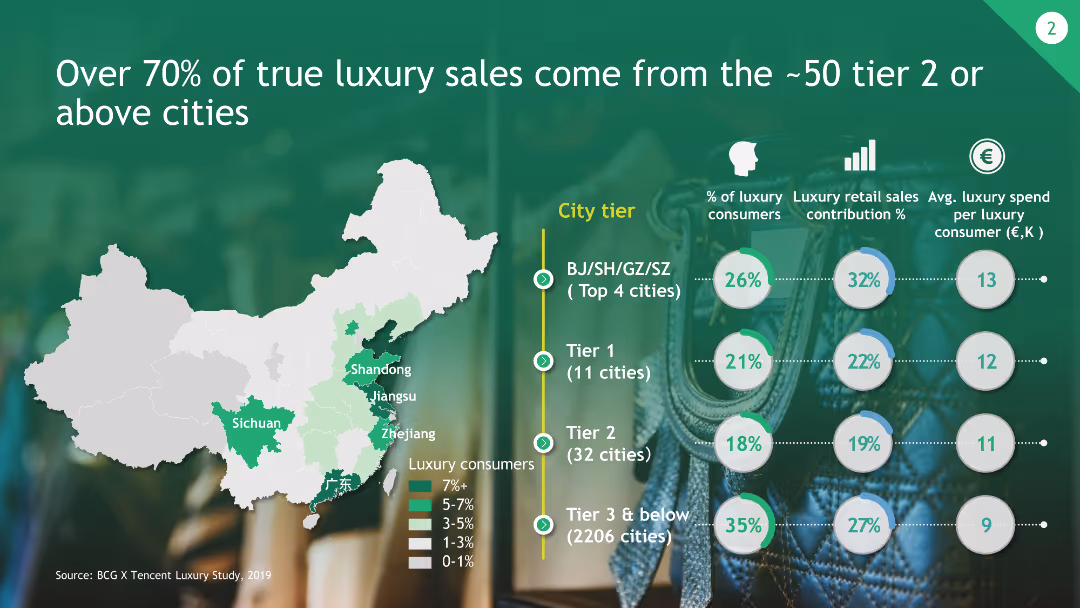
The slide includes a map of China highlighting tiered cities and their contribution to luxury sales, along with circular graphs representing consumer percentages and average spend.
Market Analysis and Trends
Consumer Goods
This slide shows that the majority of luxury sales come from approximately 50 tier 2 or above cities in China, with detailed data on consumer contributions and spending.
Luxury Sales, Tier Cities, Market Contribution, China, Consumer Data
false
Over 70% of true luxury sales come from the ~50 tier 2 or above citiesChina Luxury Digital Playbook
Multiple Chart
BCG
View slide
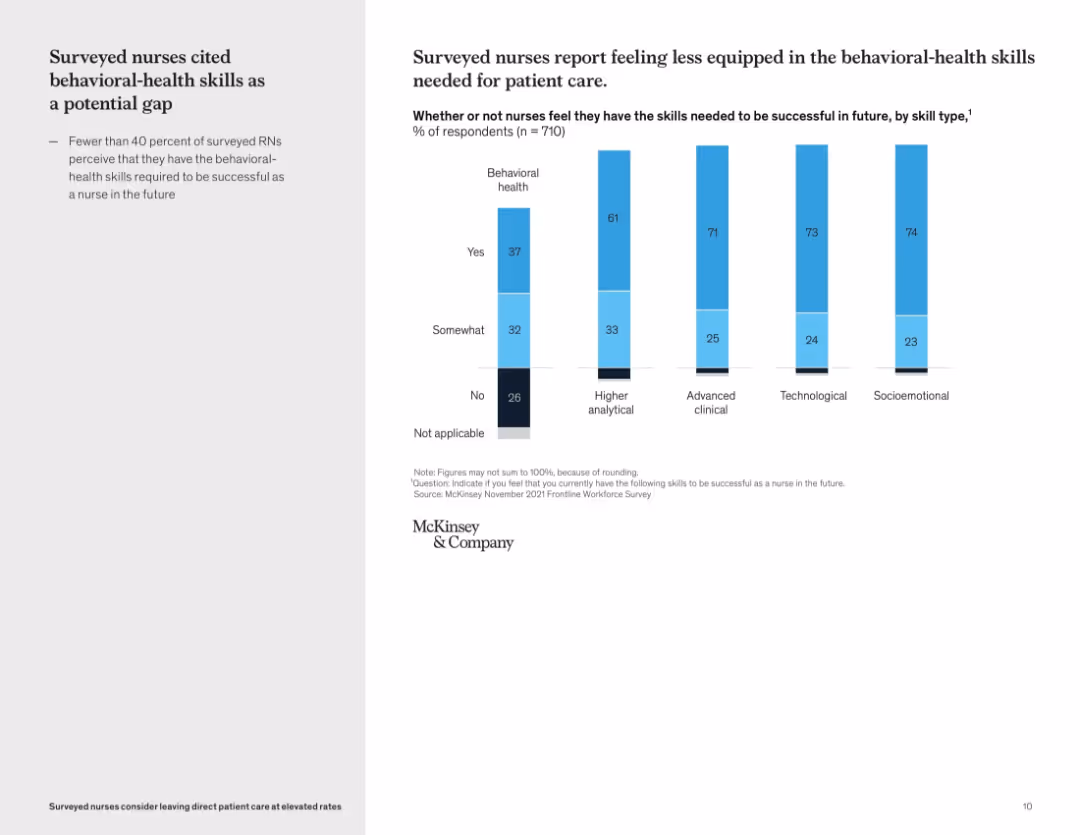
Vertical bar graph showing self-perceived skill gaps by skill type; left-side text summary
Organizational Structure and Change
Healthcare & Pharmaceuticals
This slide reveals that many nurses feel underprepared in behavioral-health skills compared to other domains like technological or clinical capabilities. Only 37% of nurses feel confident in their behavioral health skills, pointing to a critical development area for future readiness.
skills gap, behavioral health, workforce training, nursing education, competency assessment, professional development
false
Surveyed nurses cited behavioral-health skills as a potential gapSurveyed nurses consider leaving direct patient care at elevated rates
Mixed Chart
McKinsey
View slide
A column chart showing the most preferred device for video streaming across different age groups, with devices color-coded and arranged vertically.
Market Analysis and Trends
Media & Entertainment
The slide indicates that smart TVs are the most preferred devices for video viewing across all age groups, with a notable preference among older viewers.
video, viewing, devices, age groups, preferences
false
For video viewing, bigger (screen) is betterSpring 2022 National Client Meeting
Single Chart
Nielsen
View slide
The slide combines graphical representations of JPMC's market share in various banking sectors with icons of Fortune's top 5 companies, creating a strong visual impact with its segmented circular graphic and bold text captions.
Industry Overview
Financial Services
Showcasing JPMC's industry dominance and comparing it to the most admired companies globally, the slide is utilized for market positioning and corporate presentations.
market position, JPMC, banking sectors, Fortune 500, admired companies, industry dominance, corporate presentation.
false
Unparalleled strength of JPMorgan ChaseInverstors Day 2023
Framework
JP Morgan
View slide
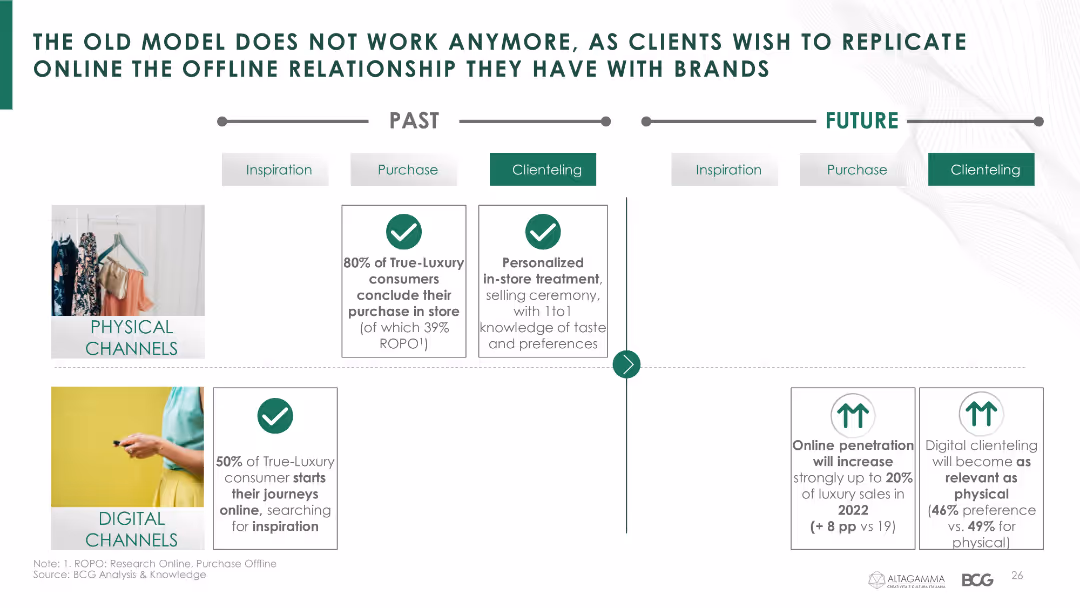
This slide has a comparative layout showing past and future models for physical and digital channels. It includes icons, images, and text boxes to differentiate key points.
Market Analysis and Trends
Retail & E-commerce
The slide highlights the shift in consumer behavior from physical to digital channels, emphasizing the need for brands to replicate offline relationships online.
Consumer behavior, physical channels, digital channels, luxury market, online penetration, digital clienteling, purchasing journey, clienteling, trends
false
THE OLD MODEL DOES NOT WORK ANYMORE, AS CLIENTS WISH TO REPLICAT E ONLINE THE OFFLINE RELATIONSHIP THEY HAVE WITH BRANDSTrue-Luxury Global Consumer Insights 7th Edition
Table
BCG
View slide
Utilizes a series of column charts with descriptive text, using colors like red, orange, and beige to differentiate data points and time frames.
Regulatory and Compliance
Government & Public Sector
Examines the backlog of cases in courts, clearance rates, and the age of matters at the time of finalization to identify areas for process improvement.
Court backlog, clearance rates, case age, legal process, judicial efficiency, case management, finalization rates
false
Measures of backlog among courtsReview of efficiency of the operation of the federal courts
Multiple Chart
PwC/Strategy&
View slide
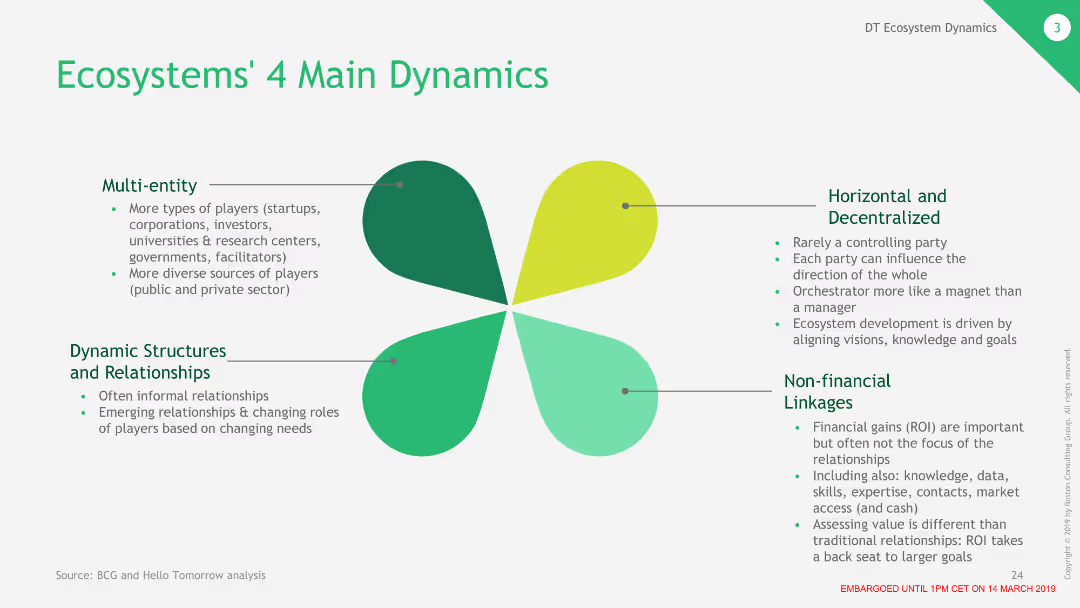
The slide features a four-leaf clover diagram, with each leaf representing one of the main dynamics of ecosystems: multi-entity, horizontal and decentralized, dynamic structures, and non-financial linkages.
Strategic Planning
Technology & Software
This slide outlines the four primary dynamics of ecosystems in deep tech, focusing on the variety of participants, decentralized nature, dynamic relationships, and importance of non-financial connections.
Ecosystems, Dynamics, Participants, Decentralized
false
Ecosystems' 4 Main DynamicsThe Dawn of the Deep Tech Ecosystem
Framework
BCG
View slide
Similar to the previous slide, this one uses a comparative chart layout to show credit ratings from major agencies for holding companies.
Competitive Landscape
Financial Services
It highlights credit ratings for UBS and competitors' holding companies, detailing their ratings and outlooks as of September 2023.
credit ratings, peer comparison, holding company, Moody's, S&P, Fitch, UBS, financial, September 2023
false
Credit ratings peer comparison Long-term senior unsecured debt – holding company, as of 11.9.23Second quarter 2023 Fixed Income investor presentation
Table
UBS
View slide
The slide features a map of Europe on the left, highlighting countries in blue. On the right, there are three vertical sections with numbers 1, 2, and 3, each containing text. The layout is simple and visually balanced.
Strategic Planning
Professional Services
The slide outlines the benefits of KnowledgePanel's expansion across Europe, highlighting increased brand recognition, revenue gains, and expanded market presence.
Europe, KnowledgePanel, expansion, strategy, benefits
false
KNOWLEDGEPANEL®EXPANSIONOur Path to Ipsos 2025: A Strategic Update
Graphic
IPSOS
View slide
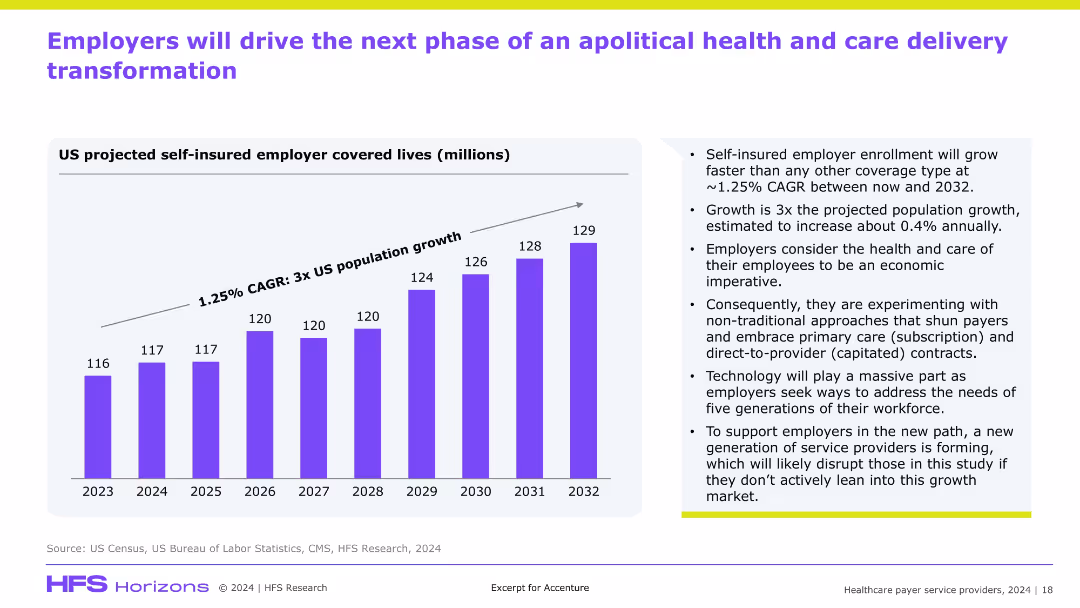
Bar graph on left showing self-insured employer lives from 2023–2032; right side features supporting bullet points; clean, modern style with purple graph and gradient background.
Market Analysis and Trends
Healthcare & Pharmaceuticals
This slide projects a rise in self-insured employer coverage through 2032, growing faster than the general population. It emphasizes employer-led transformation in healthcare through new care models (e.g., subscription, capitated), driven by economic imperatives and supported by technology, suggesting disruption opportunities for service providers.
self-insured, employers, healthcare transformation, subscription, capitated, disruption
false
Employers will drive the next phase of an apolitical health and care delivery transformationHealthcare Payer Service Providers, 2024
Mixed Chart
Accenture
View slide
The slide shows a column chart illustrating operating expenses progression in USD mn from 3Q16 to 2019 targets, with simple color coding.
Operational Efficiency
Financial Services
The slide highlights the track to reduce quarterly expenses to approximately USD 110 mn by 4Q19, showing the ambition levels for 2018 and 2019.
operating expenses, cost reduction, expense progression, financial targets, operational efficiency
false
Continued reduction of operating expensesCredit Suisse Investor Day 2016
Single Chart
Credit Suisse
View slide
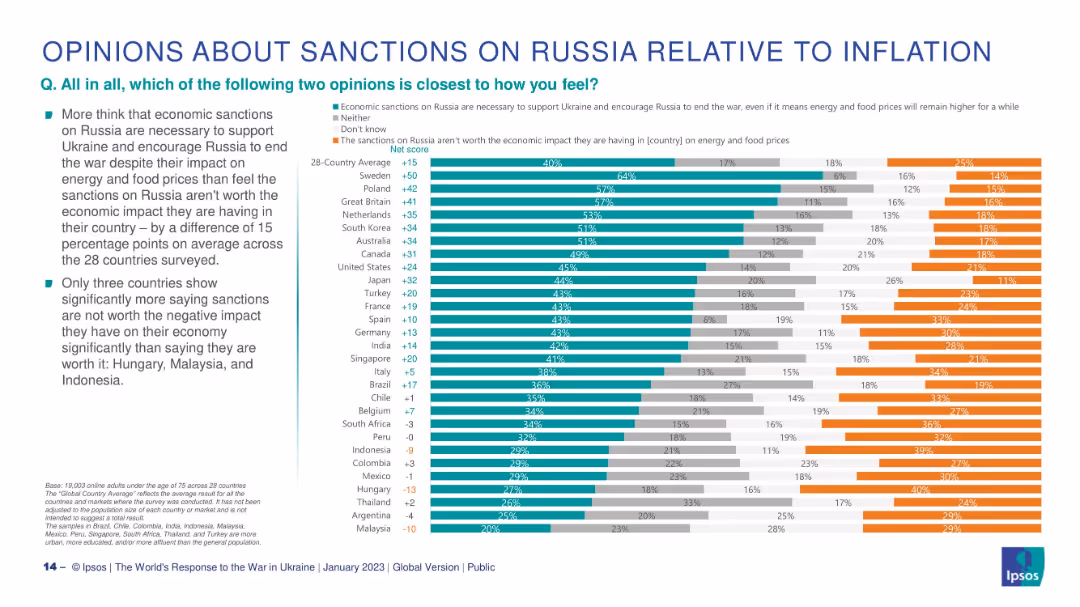
Horizontal stacked bar chart per country; green = pro-sanctions, orange = anti-sanctions, gray = neutral/don’t know.
Pricing Strategies
Government & Public Sector
This slide explores whether citizens think economic sanctions on Russia are justified despite inflation. It shows a 28-country net score comparison with only 3 countries (Hungary, Malaysia, Indonesia) predominantly opposing sanctions due to economic consequences.
sanctions, inflation, economic impact, Ukraine, public opinion, Ipsos, international response
false
OPINIONS ABOUT SANCTIONS ON RUSSIA RELATIVE TO INFLATIONTHE WORLD’S RESPONSE TO THE WAR IN UKRAINE
Mixed Chart
IPSOS
View slide
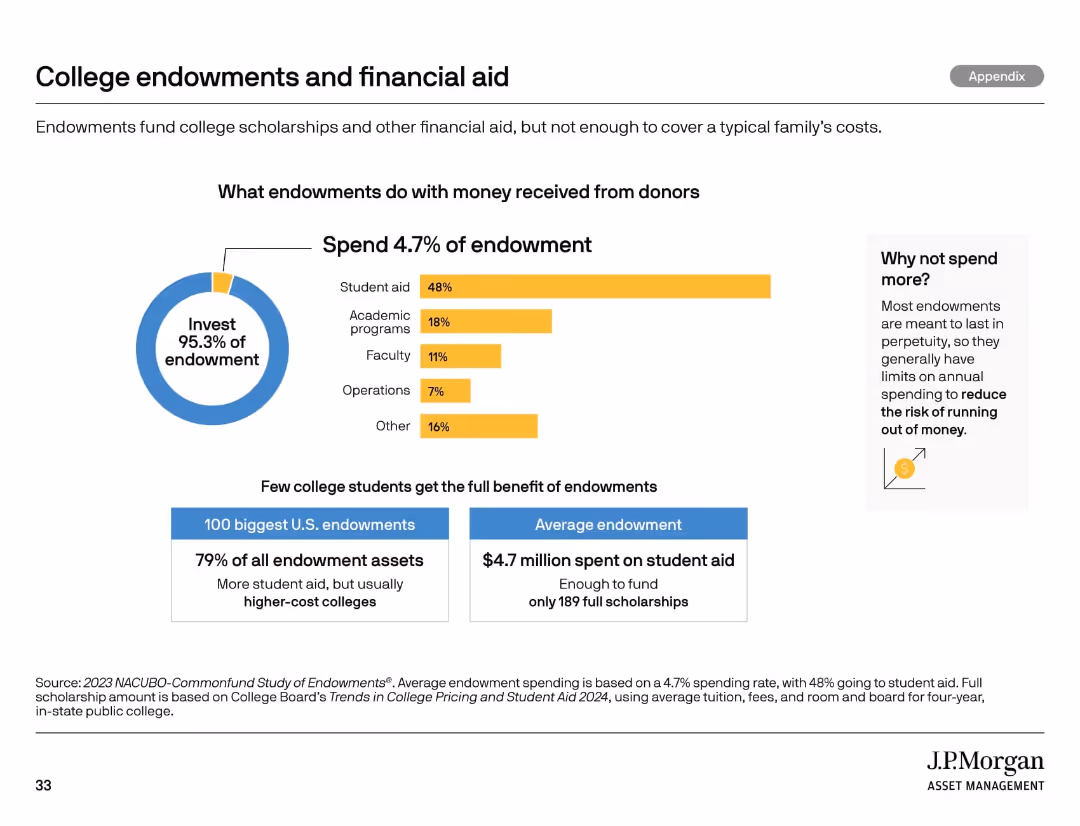
Pie chart and bar segments showing spending categories of college endowments. Includes callouts and stats.
Market Analysis and Trends
Education & Training
Analyzes how colleges allocate endowment funds, showing that only 4.7% is spent annually with a focus on student aid. It highlights the limited reach of endowments and questions sustainability and impact on student support.
endowments, financial aid, spending, college funding, student aid
false
College endowments and financial aidCollege Planning Essentials A comprehensive guide to saving and investing
Multiple Chart
JP Morgan
View slide
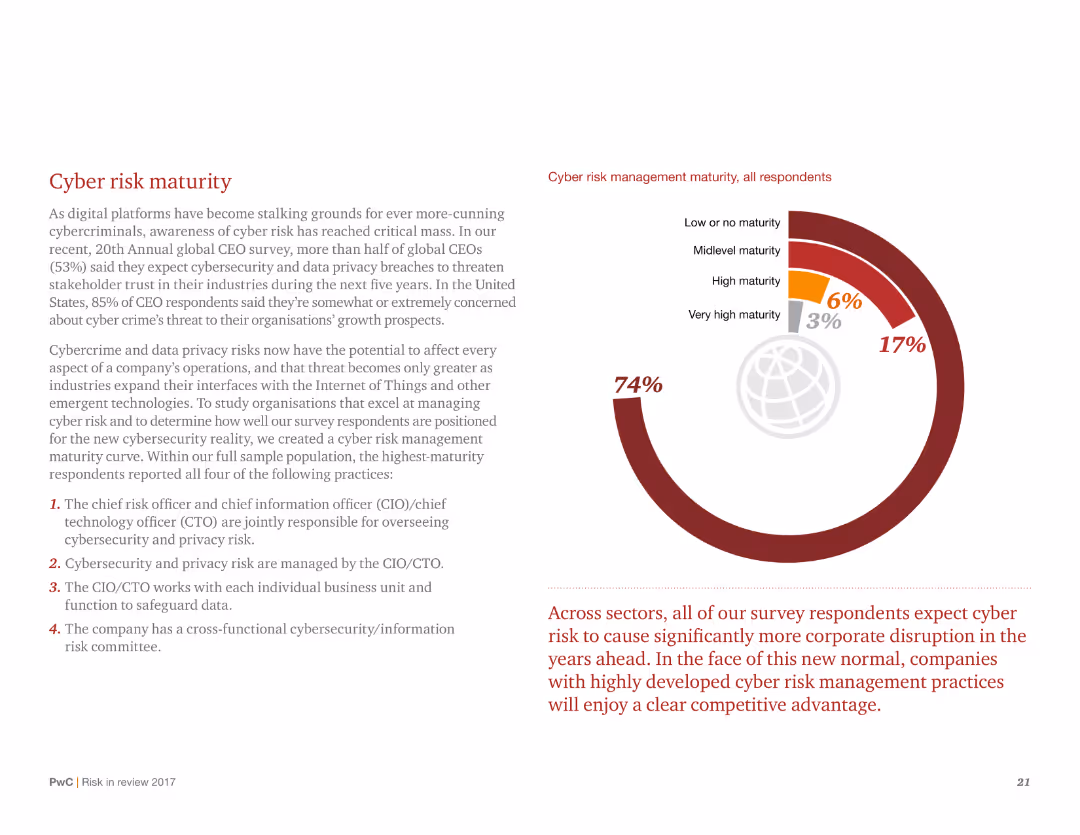
A donut chart illustrating cyber risk management maturity levels among respondents, with detailed text explaining the practices of high-maturity organizations.
Risk Assessment and Management
Technology & Software
Discusses the maturity levels of cyber risk management and outlines the four key practices adopted by high-maturity organizations to manage cybersecurity and data privacy risks.
Cyber risk, maturity, cybersecurity, data privacy, management practices, donut chart, respondents, high maturity
false
Cyber risk maturityRisk in review Managing risk from the front line
Mixed Chart
PwC/Strategy&
View slide
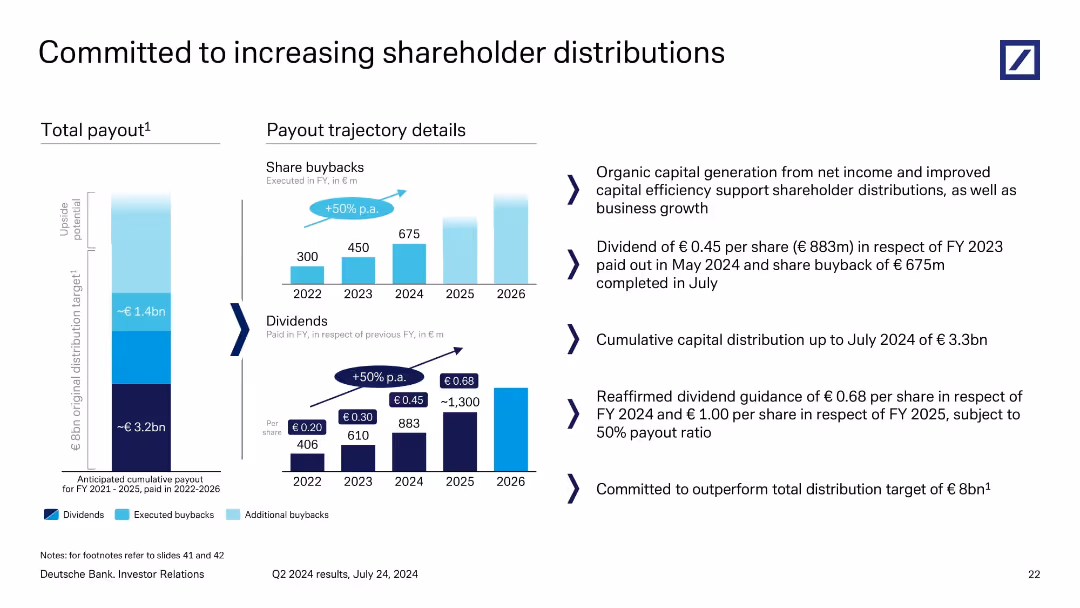
Split view with stacked bar chart on the left illustrating payout progression and bar graph on the right showing dividends and share buybacks. Bulleted narrative on right side.
Strategic Planning
Financial Services
Outlines Deutsche Bank’s commitment to shareholder returns via dividends and share buybacks. Sets cumulative capital distribution target of €8bn through 2025–26. Confirms recent payouts and provides forward guidance on increased shareholder returns.
dividends, share buybacks, payouts, shareholder distributions, guidance
false
Committed to increasing shareholder...Q2 2024 results
Multiple Chart
Deutsche Bank
View slide
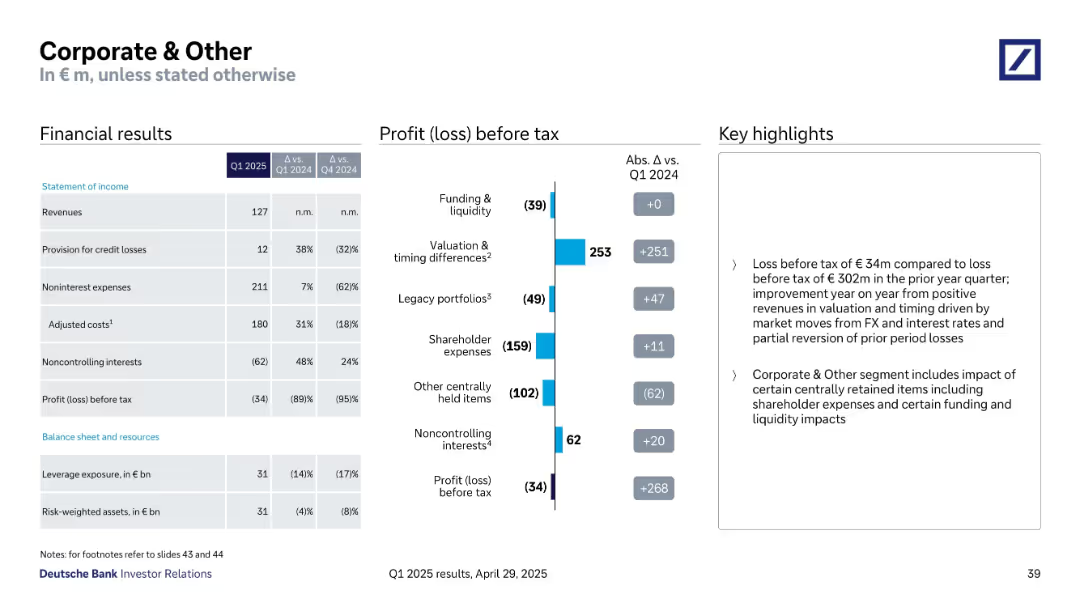
Left-aligned financial tables, middle bar chart showing loss components, and right-aligned text highlights.
Financial Performance
Financial Services
Highlights the Q1 2025 financial results of the “Corporate & Other” segment, showing significant year-on-year improvement in profit/loss before tax, driven by valuation changes and partial reversals of past losses. Key metrics like revenues, costs, and leverage exposure are detailed.
Corporate segment, financial results, profit before tax, valuation, expenses, leverage, Deutsche Bank
false
Corporate & OtherQ1 2025 results
Mixed Chart
Deutsche Bank
View slide
The slide features two sections: a column chart showing earnings per share from 2018 to 2022, and a bar chart indicating dividends and share buybacks. The layout is financial-focused and uses clear visualizations for data.
Investment Analysis
Financial Services
The slide highlights Ipsos' financial returns to investors, showing an increase in earnings per share, dividends, and share buybacks, emphasizing the company's commitment to shareholder value.
investors, returns, earnings per share, dividends, buybacks
false
RETURN TO INVESTORSOur Path to Ipsos 2025: A Strategic Update
Multiple Chart
IPSOS
View slide
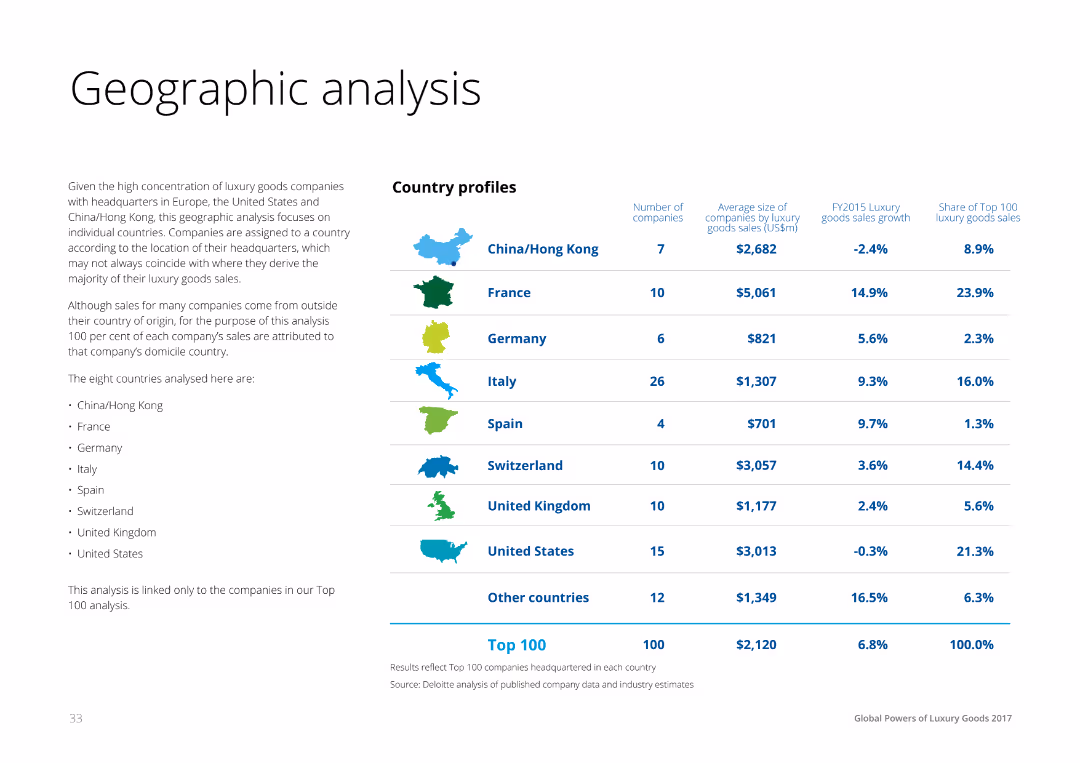
Text on the left with a table on the right showing country profiles for luxury goods markets, including the number of companies, average sales size, growth rates, and share of top 100 sales for countries like China, France, Germany, etc.
Market Analysis and Trends
Consumer Goods
This slide presents a geographic analysis of luxury goods markets, comparing countries by the number of companies, average sales size, growth rates, and market share. It provides insights into regional market dynamics and growth opportunities.
Geographic, Analysis, Luxury, Market, Countries
false
Geographic analysis Given the high concentration of luxury goods companies with headquarters in EuropeGlobal Powers of Luxury Goods 2017 The new luxury consumer
Table
Deloitte
View slide
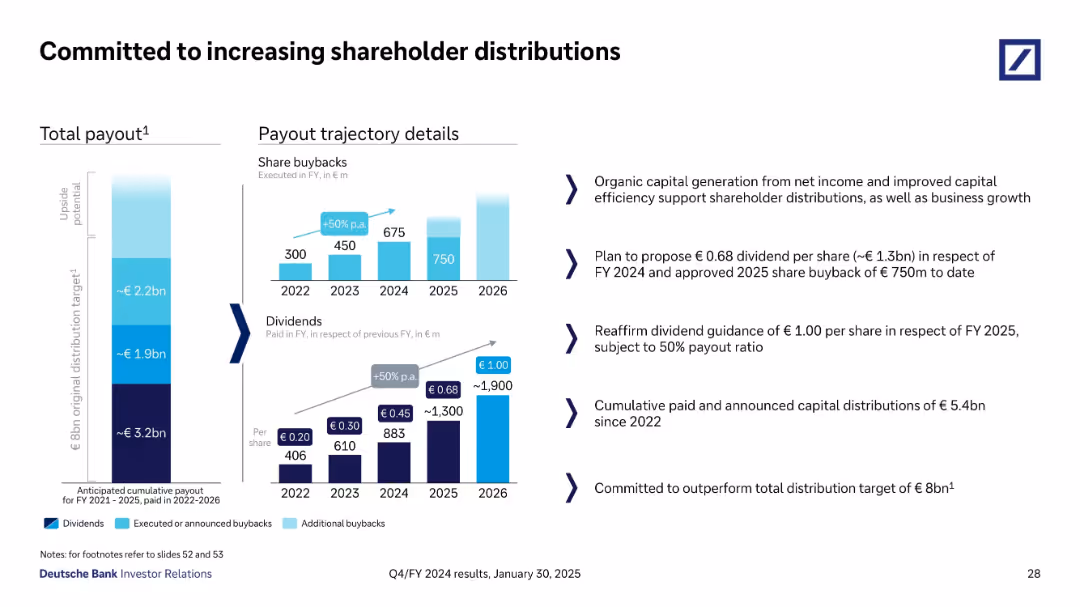
Split layout with vertical payout chart, bar charts of buybacks/dividends, and strategy bullet points
Strategic Planning
Financial Services
This slide outlines Deutsche Bank’s strategy to increase shareholder distributions through dividends and share buybacks. It shows a trajectory aiming for €8bn in distributions from FY 2021–2026, including a proposed €0.68 dividend for FY 2024 and €750m in buybacks for 2025.
Shareholder Return, Dividends, Buybacks, Strategy, FY2024, FY2025
false
Committed to increasing shareholder distributionsQ4/FY 2024 results
Multiple Chart
Deutsche Bank
View slide
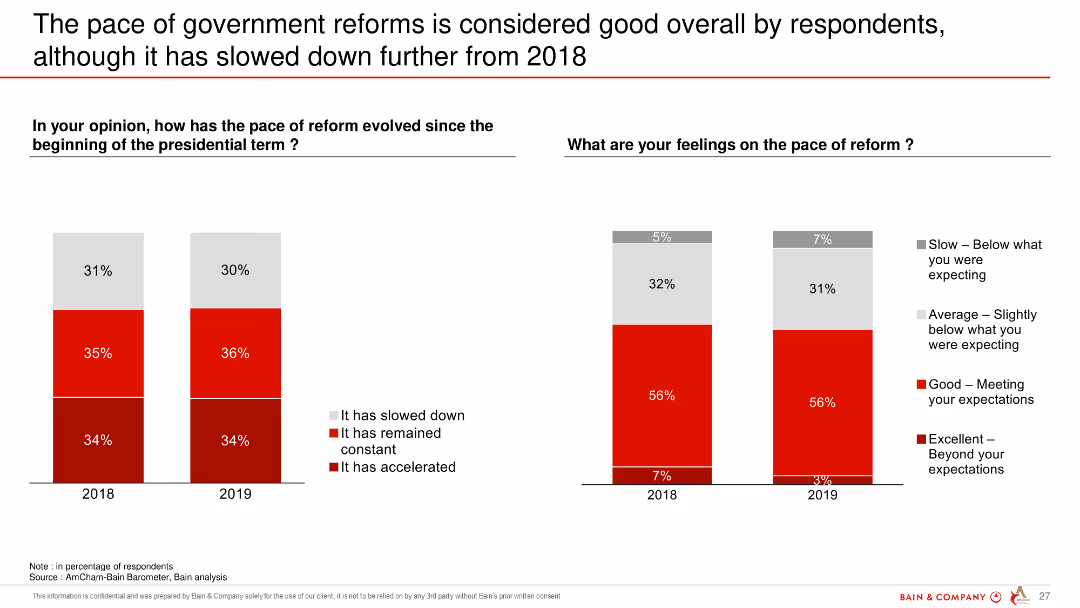
The slide contains two column charts comparing the pace of government reforms and respondents' feelings on the pace over two years (2018 and 2019). The bars show varying levels of satisfaction.
Regulatory and Compliance
Government & Public Sector
This slide shows that respondents generally perceive government reforms positively, but there is a slight decline in satisfaction from 2018 to 2019.
government reforms, satisfaction, survey, comparison, 2018, 2019, pace of reform
false
The pace of government reforms is considered good overall by respondents, although it has slowed down further from 2018AmCham – Bain Barometer 20th – Edition
Multiple Chart
Bain
View slide
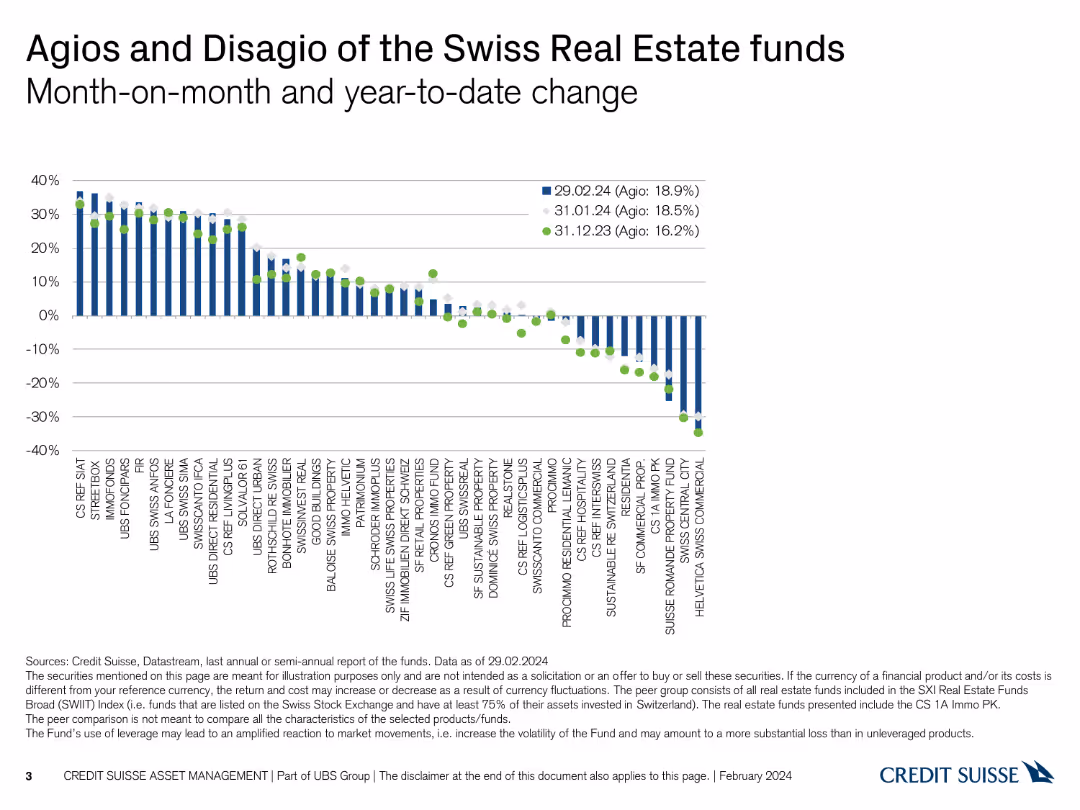
Column chart showing month-on-month and year-to-date changes in agios and disagios of Swiss real estate funds.
Market Analysis and Trends
Real Estate & Construction
Analyzes the monthly and yearly changes in agio/disagio percentages of Swiss real estate funds, tracking performance over time.
real estate, agio, disagio, monthly change, yearly change
false
Agios and Disagio of the Swiss Real Estate funds Month on month and year to date changeSwiss Real Estate Funds At a glance
Single Chart
Credit Suisse
View slide
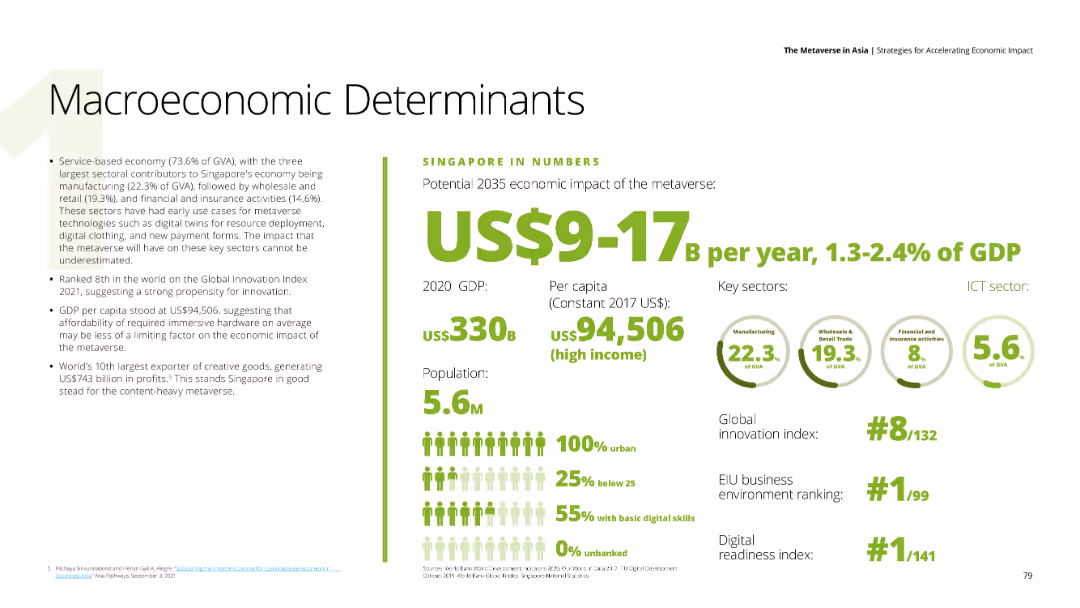
Detailed text on Singapore's economic impact of the metaverse, with numerical data on GDP, per capita income, and key sectors like manufacturing, wholesale trade, and financial activities. Background is white with green and black text.
Market Analysis and Trends
Financial Services
Evaluates Singapore's strong economic position and potential metaverse impact, mentioning GDP, innovation index ranking, and key sectors contributing to the economy.
Singapore, metaverse, economic impact, GDP, innovation index
false
Macroeconomic Determinants SINGAPORE IN NUMBERSThe Metaverse in Asia Strategies for Accelerating Economic Impact
Mixed Chart
Deloitte
View slide
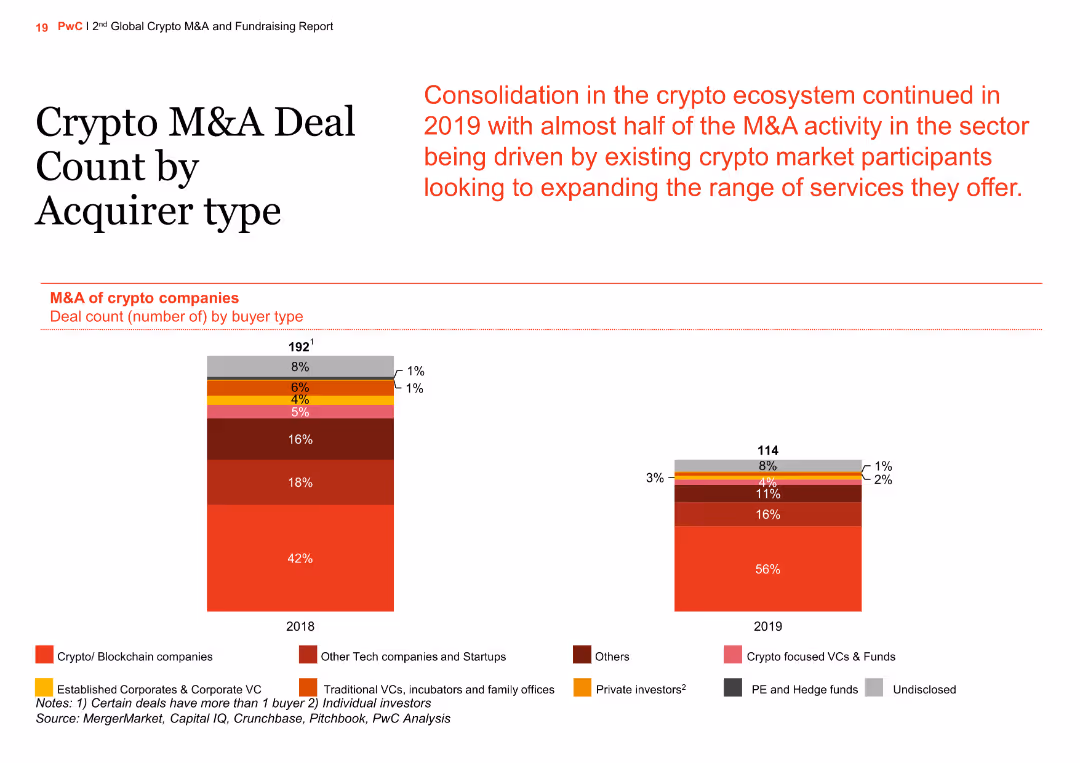
The slide shows a column chart comparing M&A deal counts by acquirer type for 2018 and 2019. Acquirer types include crypto/blockchain companies, tech startups, established corporates, VCs, and private investors.
Market Analysis and Trends
Financial Services
The slide provides an overview of the types of acquirers involved in crypto M&A deals, noting a significant increase in acquisitions by crypto/blockchain companies and a consolidation trend in the ecosystem.
crypto, M&A, acquirer type, column chart, comparison
false
Crypto M&A Deal Count by Acquirer type2nd Global Crypto M&A and Fundraising Report
Multiple Chart
PwC/Strategy&
View slide
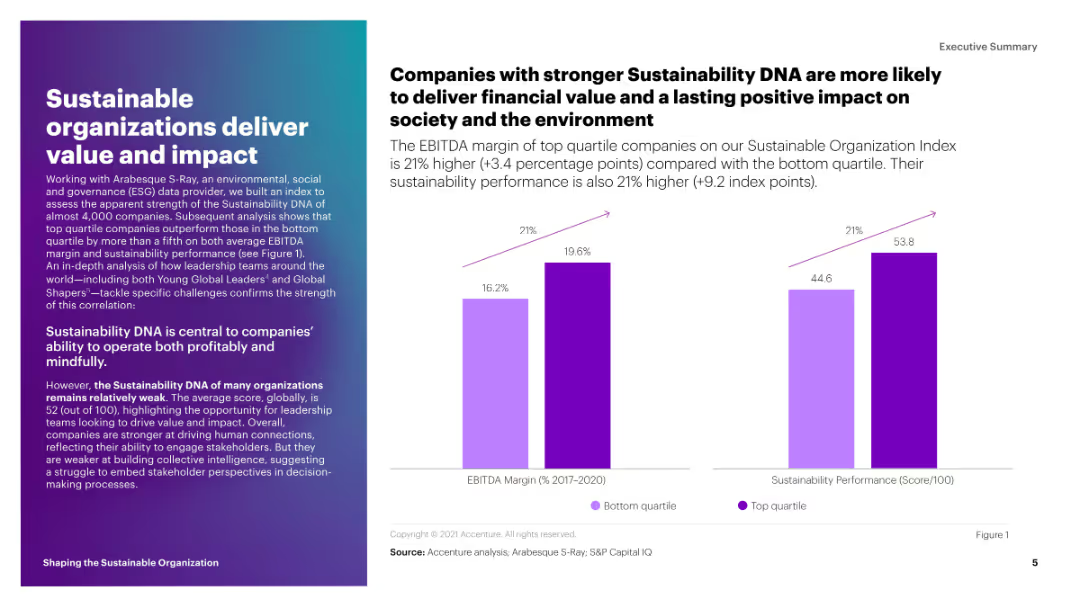
This slide includes a column chart comparing the EBITDA margin and sustainability performance score of top quartile companies to those in the bottom quartile. The bars are in shades of purple.
Strategic Planning
Environmental Services & Sustainability
The slide shows that companies with stronger sustainability DNA have higher EBITDA margins and sustainability performance scores. It emphasizes the financial and societal benefits of sustainability.
sustainability, EBITDA, performance, impact, top quartile
false
Companies with stronger Sustainability DNA are more likely to deliver financial value and a lasting positive impact on society and the environmentShaping the Sustainable Organization
Mixed Chart
Accenture
View slide
Includes line graphs that project economic recovery trajectories under a scenario of virus recurrence with a strong global rebound, with detailed GDP indexes.
Financial Performance
Financial Services
Projects optimistic economic recovery scenarios following a possible recurrence of COVID-19, showing a robust rebound in major economies.
GDP, recovery, COVID-19, economic rebound, scenarios
false
Scenario A2: virus recurrence, with strong world reboundCovid 19: Briefing Materials
Single Chart
McKinsey
View slide
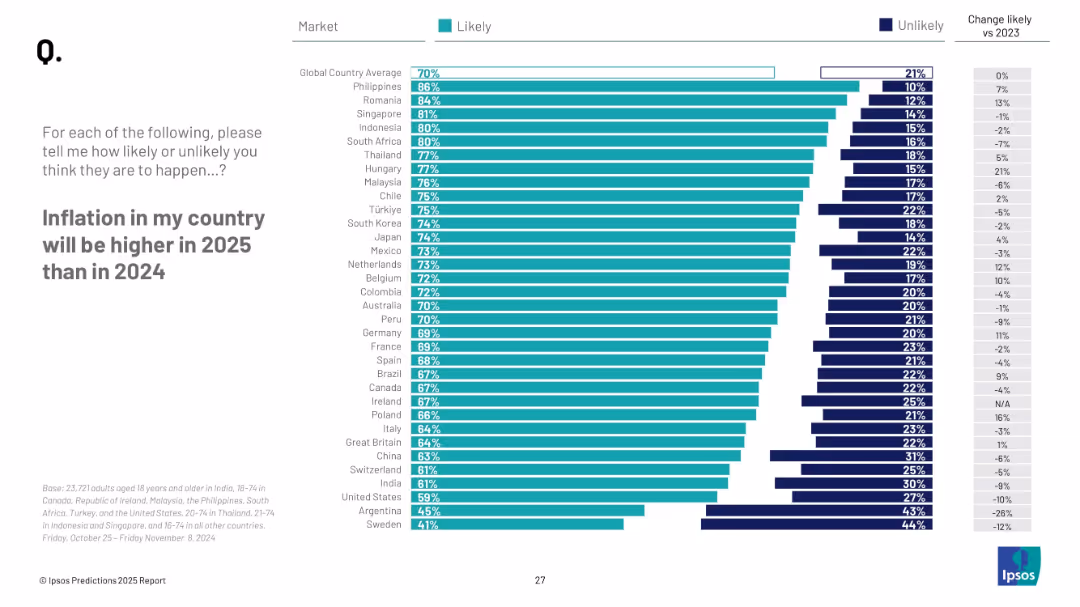
Horizontal bar chart with countries ranked by likelihood of higher inflation in 2025; includes a column on change from 2023.
Market Analysis and Trends
Financial Services
This slide visualizes consumer expectations about inflation in their own countries for 2025. It contrasts likelihood across markets and includes year-over-year trend shifts.
inflation expectations, economic perception, country trends, Ipsos, 2025, cost of living, price increases
false
Inflation in my country will be higher in 2025 than in 2024PREDICTIONS 2025 REPORT
Mixed Chart
IPSOS
View slide
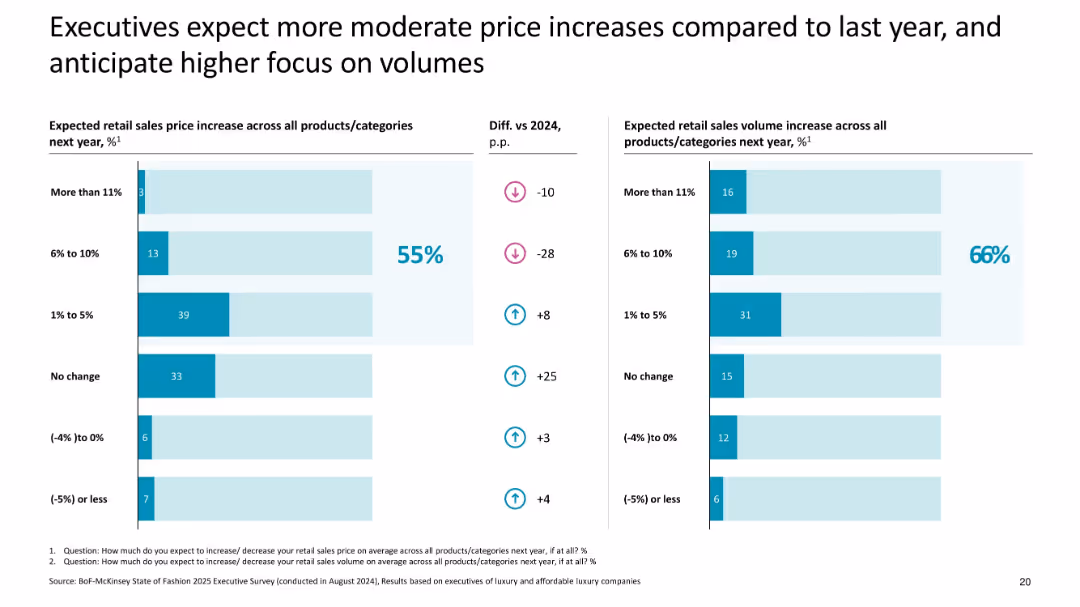
Dual bar charts with pricing and volume expectations; uses % comparisons and trend arrows
Pricing Strategies
Consumer Goods
Highlights expected moderation in retail price increases across luxury categories in 2025, with 55% of execs forecasting small increases and 66% expecting sales volume growth, shifting focus from pricing to volume.
pricing, volume, 2025 forecast, executive expectations, luxury, moderate increases, price strategy
false
Executives expect more moderate price increases compared to last year, and anticipate higher focus on volumesThe State of Luxury January 2025
Multiple Chart
McKinsey
View slide
Clean design with categorized text blocks outlining reasons leaders should pay attention to space technology trends, including market growth and new business models.
Strategic Planning
Technology & Software
Highlights the growth and potential of the space market, emphasizing the reasons for industry leaders to engage with space technology trends.
space market, growth potential, business models, software focus, industry leaders
false
Why should leaders pay attention? McKinsey Technology Trends Outlook 2022 Future of space technologies
Pillar
McKinsey
View slide
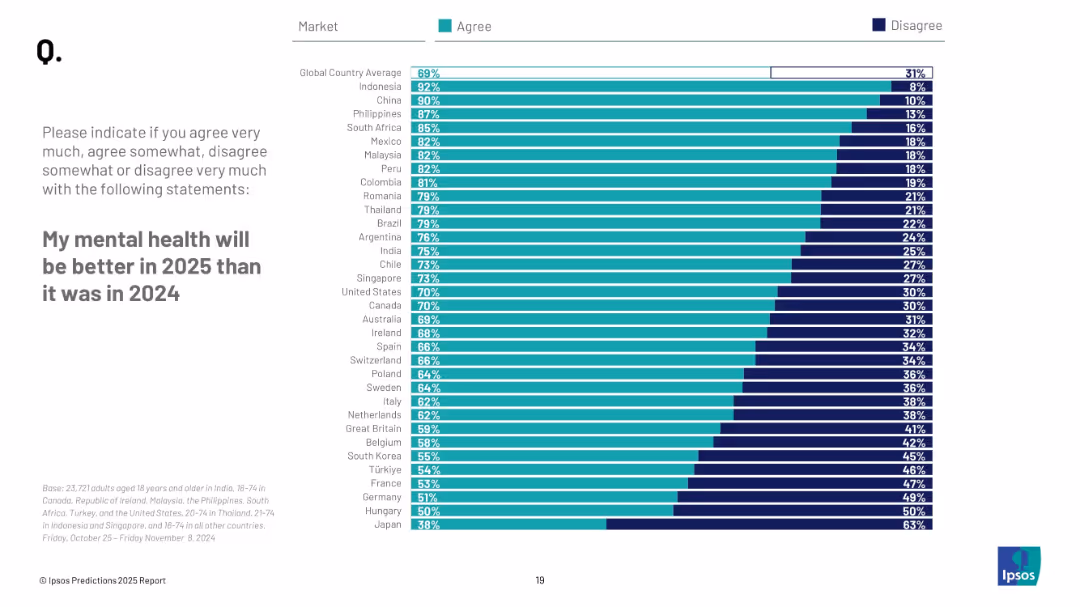
Horizontal bar chart with "Agree" and "Disagree" columns; left-aligned title and instructions; countries ranked by optimism in mental health.
Market Analysis and Trends
Healthcare & Pharmaceuticals
This slide displays how optimistic individuals are regarding their mental health in 2025 compared to 2024. It breaks down agreement/disagreement percentages per country with a global average.
mental health, optimism, wellbeing, survey, countries, Ipsos, 2025, expectations, global trends
false
My mental health will be better in 2025 than it was in 2024PREDICTIONS 2025 REPORT
Mixed Chart
IPSOS
View slide
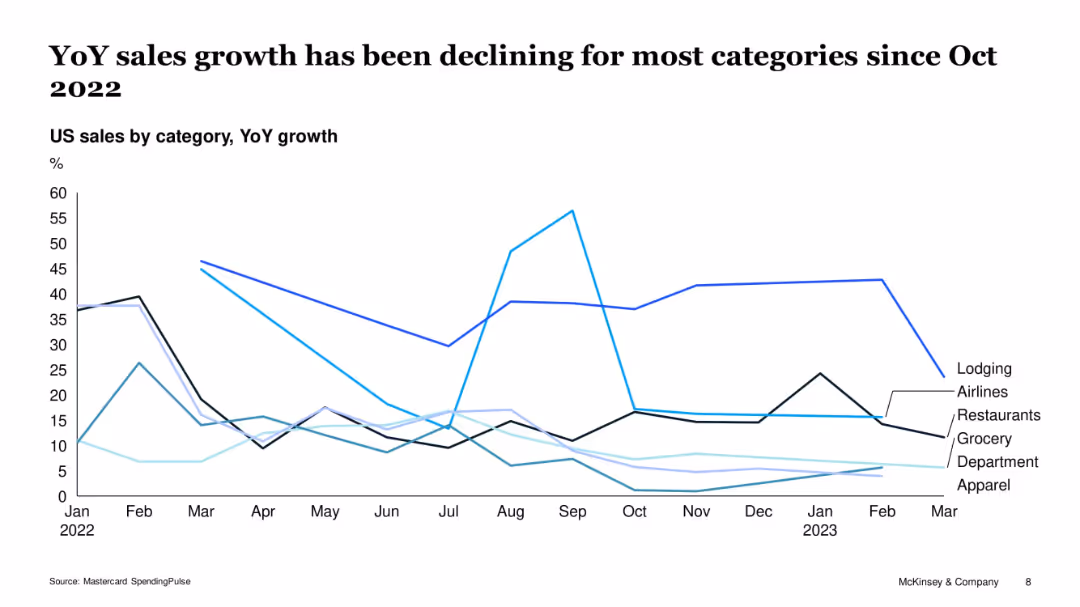
Multi-line chart tracking category-wise YoY sales growth (e.g., lodging, airlines, apparel)
Performance Metrics and KPIs
Retail & E-commerce
The chart illustrates the sharp drop in year-over-year sales growth across key consumer categories post-October 2022. Lodging and airlines initially saw large spikes but declined, while apparel and department stores experienced consistent underperformance, indicating broad retail headwinds.
sales growth, categories, apparel, restaurants, lodging, Mastercard, decline, YoY
false
YoY sales growth has been declining for most categories since Oct 2022US Credit Card Issuer Performance, 1Q 2023
Single Chart
McKinsey
View slide
Featuring a circular graph with variously sized and colored bubbles, it visualizes data on innovation, interest, investment, and adoption by technology trend.
Technology and Digital Transformation
Professional Services
Continuation of the introduction, this slide provides quantitative data on technology trends using an innovative graph style.
Innovation, Investment, Technology, Trends, Data, Analysis, AI, Energy
false
Introduction Exhibit 1McKinsey Technology Trends Outlook 2022 Report
Single Chart
McKinsey
View slide
Contains multiple logos and a colored block diagram categorizing various business aspects such as "Cockpit of the Future" and "Technology Platforms". Colorful and structured.
Industry Overview
Transportation & Logistics
Describes Faurecia's strategic partnerships across different sectors, emphasizing on technology and sustainable mobility, highlighting the integration with various industries and academia.
partnerships, technology, academia, sustainability, mobility, ecosystem, innovation
false
Faurecia’s strategic ecosystem is a key differentiation factor for Cockpit of the Future & Sustainable MobilityDeutsche Bank Global Auto Industry Conference
Diagram
Deutsche Bank
View slide
A mix of text, graphics, and data points addressing the need for digital trust technologies due to growing cybersecurity threats.
Technology and Digital Transformation
Technology & Software
Emphasizes the importance of cybersecurity in light of increasing threats, rising costs, and the need for regulatory compliance.
cybersecurity, digital trust, risk management, technology impact
false
Why should leaders pay attention? 2McKinsey Technology Trends Outlook 2022 Trust architectures and digital identity
Text Only
McKinsey
View slide
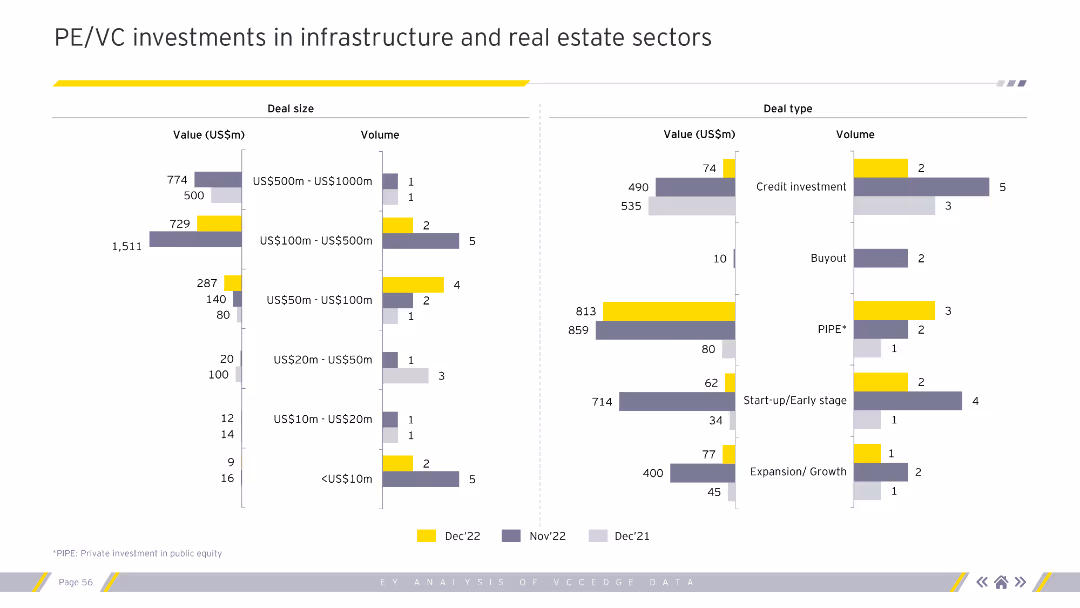
The slide features two bar charts. The left bar chart shows deal sizes by value and volume. The right bar chart shows deal types by value and volume.
Investment Analysis
Real Estate & Construction
This slide compares the PE/VC investments in infrastructure and real estate sectors based on deal size and type.
PE, VC, infrastructure, real estate, investments, deal size, deal type, volume, value
false
PE/VC investments in infrastructure and real estate sectorsIs private equity rewriting what value means? Explore the emergence of NextWaveprivate equity and its impact on the economy and society
Multiple Chart
EY
View slide
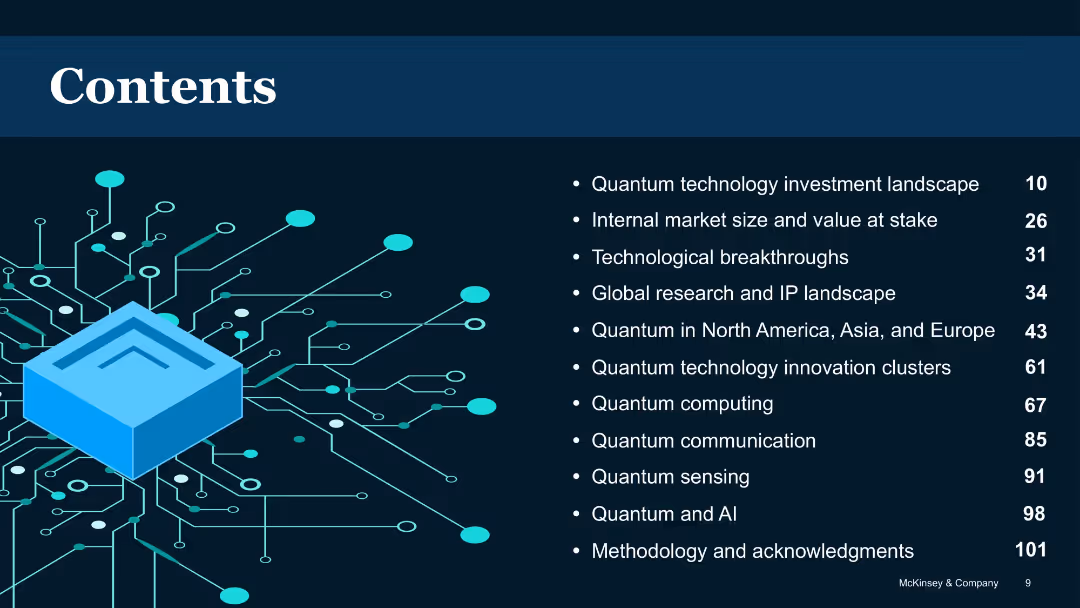
Dark background with blue circuit illustration and list-style table of contents
Industry Overview
Artificial Intelligence
Provides a structured overview of the report’s sections, including topics like investment landscape, technological breakthroughs, global perspectives, and specific quantum technologies like computing, sensing, and communication.
Table of contents, report structure, quantum sections, chapter list
false
ContentsQuantum Technology Monitor
Agenda
McKinsey
View slide
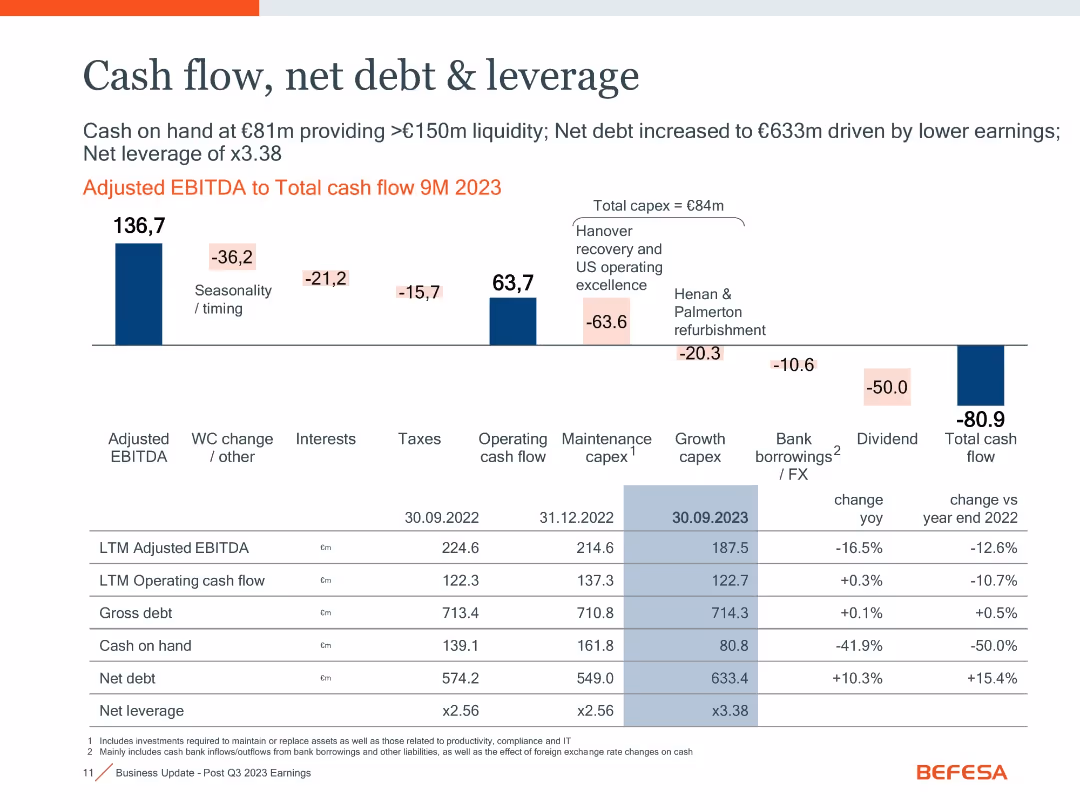
Waterfall chart with financial metrics and a table comparing key indicators over time
Financial Performance
Industrial & Manufacturing
Illustrates cash flow changes and leverage metrics. Shows adjusted EBITDA to total cash flow with detailed breakdowns. Net debt increased to €633m due to lower earnings and capex, leading to 3.38x leverage.
cash flow, net debt, leverage, EBITDA, capex, liquidity
false
Cash flow, net debt & leverageGoldman Sachs 4th Annual Carbonomics Conference
Mixed Chart
Goldman Sachs
View slide
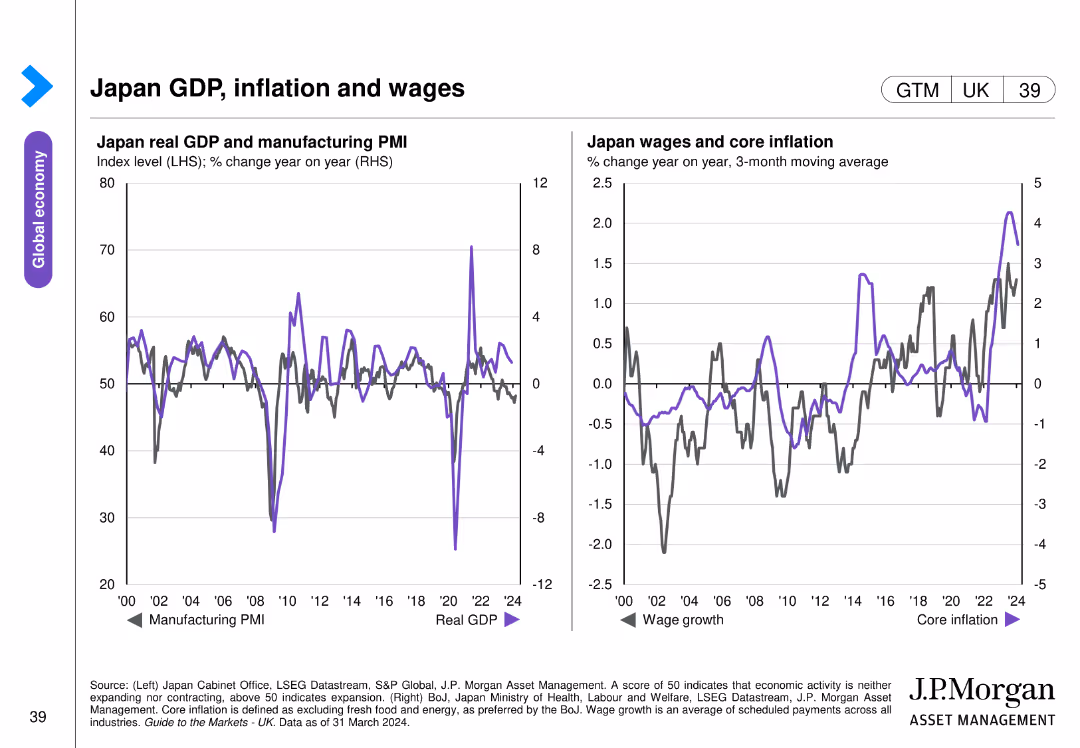
Two charts: one shows Japan's real GDP and manufacturing PMI, and the other depicts Japan's wage growth and core inflation trends over several years.
Market Analysis and Trends
Financial Services
This slide analyzes the economic indicators for Japan, including GDP, manufacturing PMI, wage growth, and core inflation. Used for economic performance review and forecasting in the Japanese market.
Japan, GDP, inflation, wages, PMI
false
Japan GDP, inflation and wagesGuide to the Markets UK | Q2 2024
Multiple Chart
JP Morgan
View slide
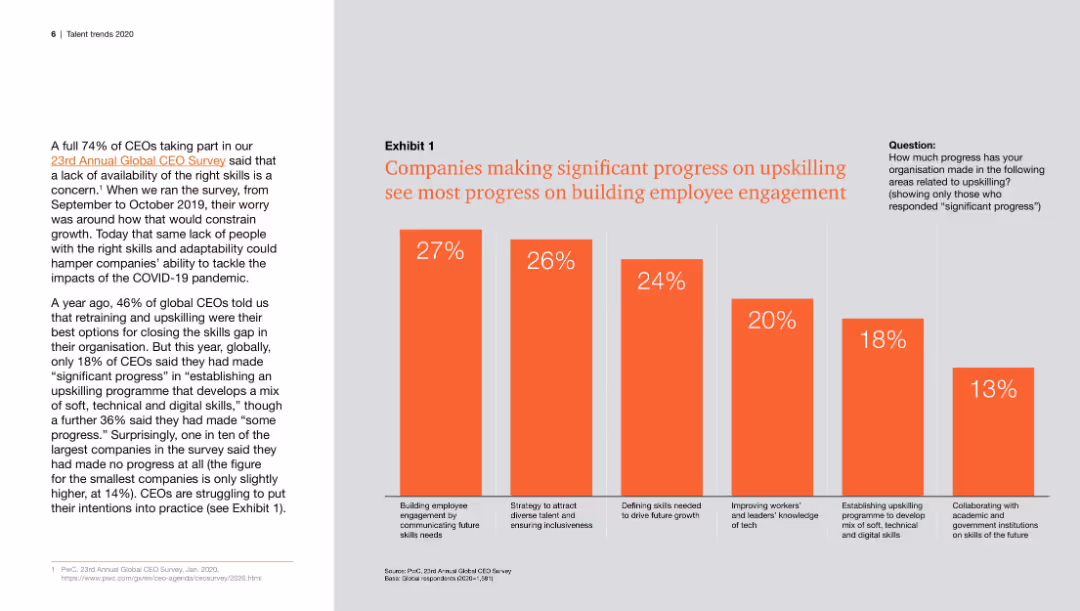
Features a column chart illustrating the correlation between progress in upskilling and improvements in employee engagement, with different percentages for various engagement strategies.
Human Resources and Talent Management
Professional Services
This slide highlights the relationship between significant progress in upskilling programs and the corresponding improvements in employee engagement, showing data from a CEO survey.
upskilling, employee engagement, progress, CEOs, survey
false
Exhibit 1 Companies making significant progress on upskilling see most progress on building employee engagementTalent trends 2020 Upskilling: Building confidence in an uncertain world Findings from PwC’s 23rd Annual Global CEO Survey
Mixed Chart
PwC/Strategy&
View slide
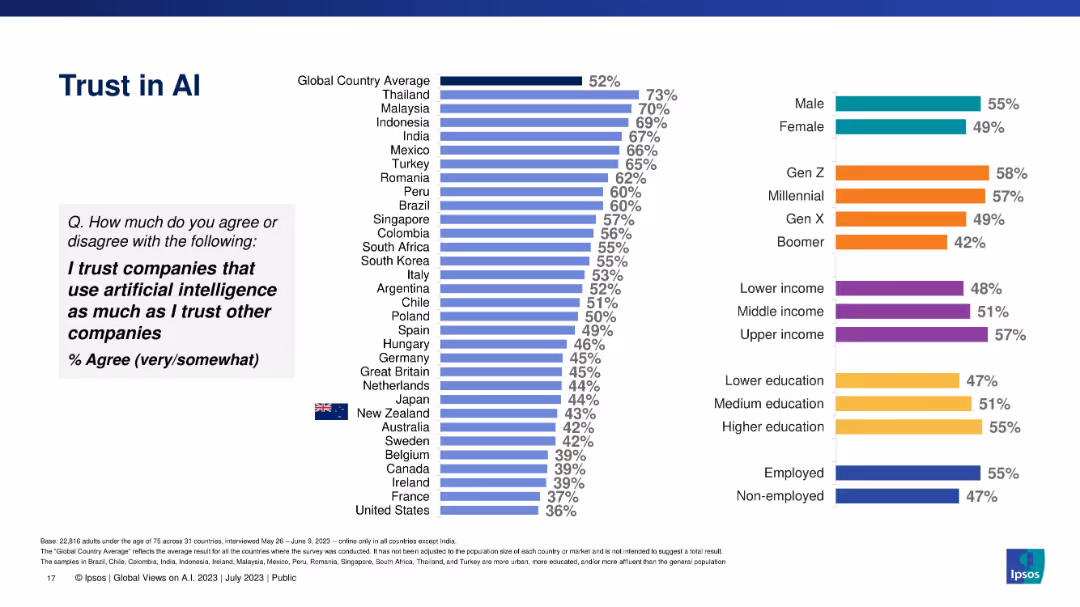
Vertical bar chart displaying trust in AI-using companies vs. other companies, segmented globally.
Risk Assessment and Management
Artificial Intelligence
Explores whether people trust AI-using companies as much as traditional companies, showing global and demographic variations, with Thailand leading and U.S. trailing.
trust, corporate AI, consumer confidence, demographic variation, Ipsos, ethical business
false
Trust in AIGLOBAL VIEWS ON A.I. IN 2023
Multiple Chart
IPSOS
View slide
Consists of financial result tables and column chart displaying net revenues. The slide is text-heavy, providing a dense array of figures and statistics. The graphs use shades of blue for different revenue categories, set against a white background.
Financial Performance
Financial Services
Provides detailed financial metrics and analysis for consumer and wealth management, suitable for financial reporting or discussing strategic business decisions.
Consumer, Wealth Management, Net Revenues, Banking
false
Consumer & Wealth ManagementSecond Quarter 2022 Earnings Results Presentation
Mixed Chart
Goldman Sachs
View slide
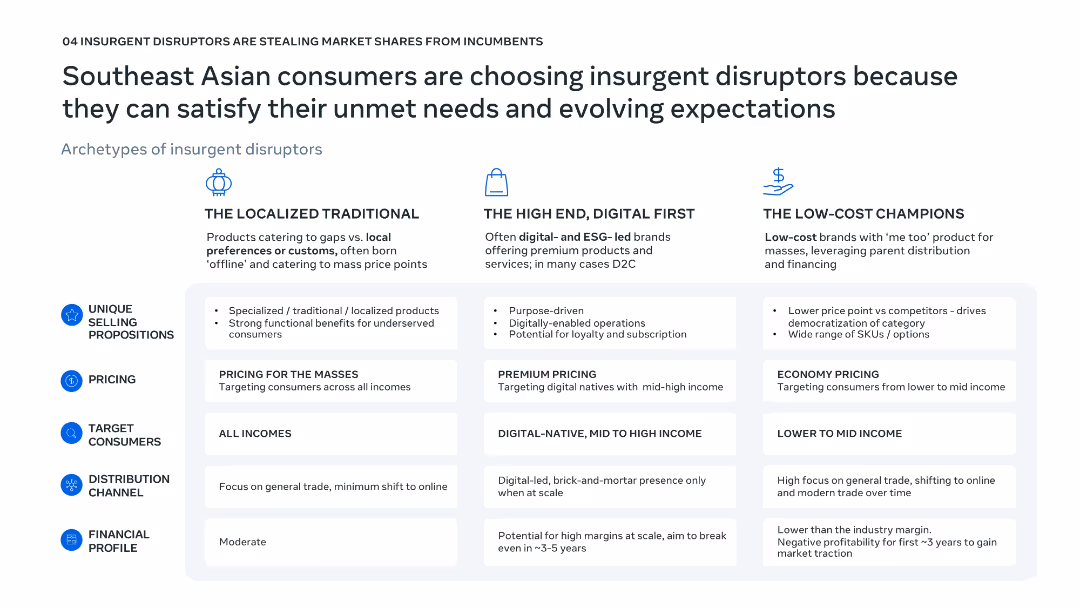
Three-column comparative layout; icons and bold headings distinguish disruptor archetypes; bullet points within shaded boxes for consistent structure.
Competitive Landscape
Consumer Goods
This slide classifies three types of insurgent disruptors in Southeast Asia—Localized Traditional, High-End Digital First, and Low-Cost Champions—by outlining their pricing, consumers, distribution, and financial traits. It demonstrates how these disruptors meet evolving consumer demands unmet by incumbents.
insurgent disruptors, localization, premium pricing, low-cost, Southeast Asia
false
Southeast Asian consumers are choosing insurgent disruptors because they can satisfy their unmet needs and evolving expectationsBold moves: Leading Southeast Asia's next wave of consumer growth
Table
Bain
View slide
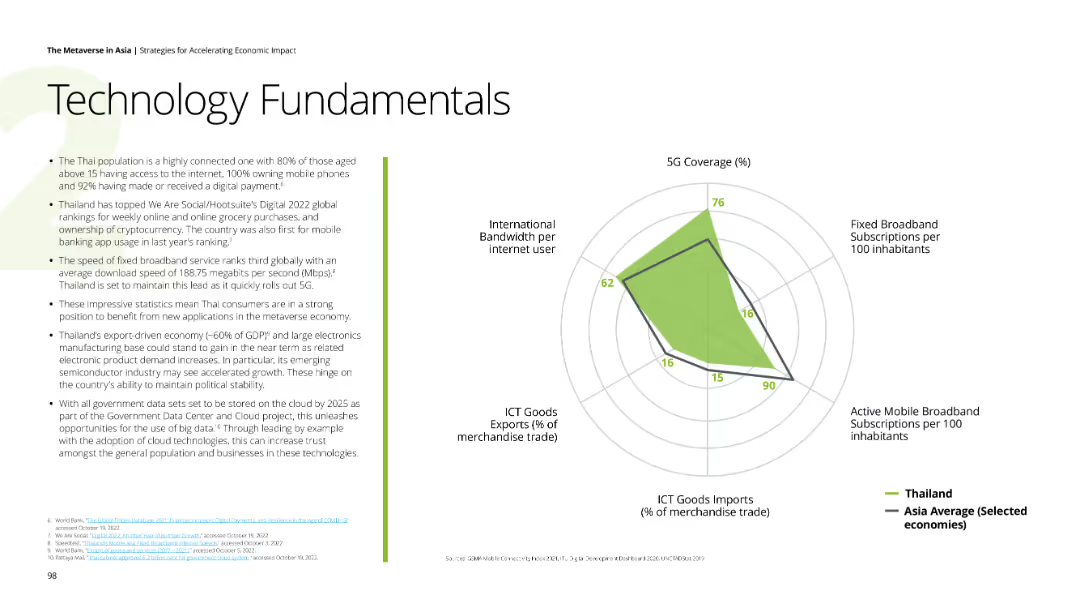
The slide features a radar chart comparing Thailand’s tech metrics against the Asia average. Textual information on the left discusses Thailand’s connectivity, broadband speed, and digital economy initiatives.
Technology and Digital Transformation
Telecommunications
Discusses Thailand’s technological advancements, including 5G coverage, broadband speed, and digital economy, with a focus on enhancing consumer and business tech use.
5G, broadband, digital economy, Thailand, connectivity
false
Technology Fundamentals The Thai population is a highly connected one with 80% of those aged above 15 having access to the internet,The Metaverse in Asia Strategies for Accelerating Economic Impact
Mixed Chart
Deloitte
View slide
Contains a column chart showcasing the growth of deposits over time segmented by different business units within the organization.
Financial Performance
Financial Services
Used to demonstrate the consistent increase in deposits across various segments of a financial institution, reflecting healthy financial growth and stability.
Deposits, Growth, Trends, Line Graph, Financial Stability, Banking, Performance, Analysis
false
Steady Average Deposit Growth as we Win New Clients & Deepen with Existing OnesFirst Quarter 2023 Earnings Results Presentation
Single Chart
Citigroup
View slide
Features a column chart showing the capital expenditure (capex) of major telco operators from 2016 to 2020, with a line graph overlay representing capex to revenue ratio. Color-coded for each operator to show investment patterns relative to revenue.
Operational Efficiency
Telecommunications
Discusses the capital investment trends in the telecommunications industry, highlighting how smaller operators are increasingly investing in expanding their 4G networks, contrasted with Telkom's steady investment strategy.
capex, 4G network, investment, Telkom, telecommunications industry, revenue ratio
false
Telkom capex has remained constant, with smaller players investing slightly more to expand their 4G networkIndonesia case study
Multiple Chart
BCG
View slide
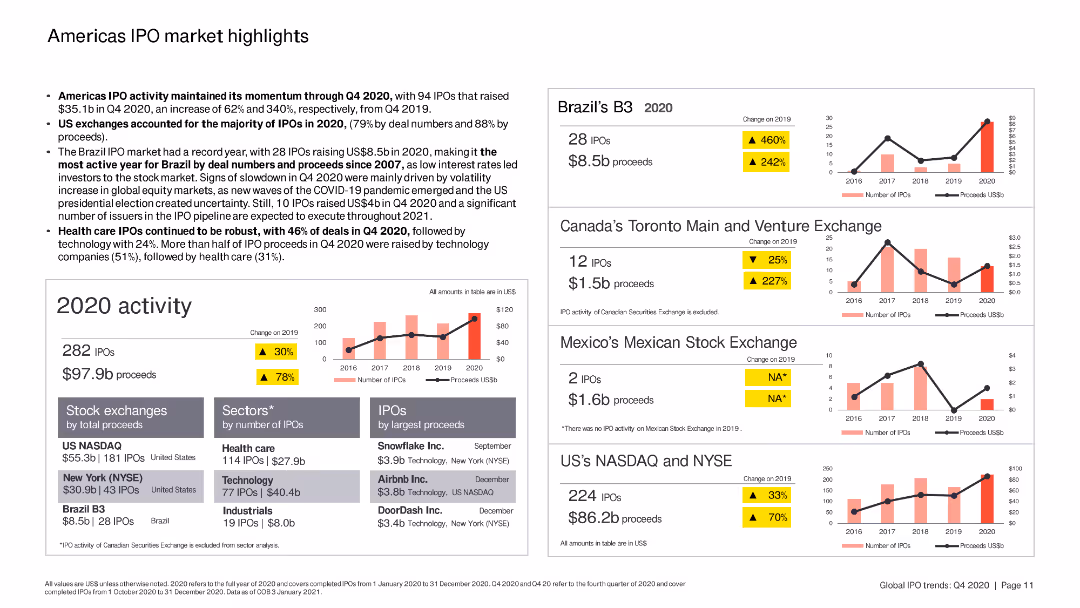
The slide includes column charts and bar charts summarizing IPO activity in the Americas, with specific focus on Brazil, Canada, and the US.
Market Analysis and Trends
Financial Services
The slide highlights key IPO trends in the Americas, focusing on the performance of various stock exchanges, sectors, and top IPOs by proceeds in 2020.
Americas, IPO, Brazil, Canada, US
false
Americas IPO market highlightsIs your business model resilient enough to weather any storm?
Multiple Chart
EY
View slide
Column charts depict the evolution of the CET1 ratio with additional insights provided through callouts, against a backdrop of regulatory requirements.
Strategic Planning
Financial Services
Communicates the firm's strong capital position and its preparedness for future volatility and regulatory changes.
capital generation, CET1 ratio, resilience, strategic planning, column charts, JPMorgan
false
Strong capital generation and a resilient balance sheet positions us well for the futureFirm Overview 2022
Mixed Chart
JP Morgan
View slide
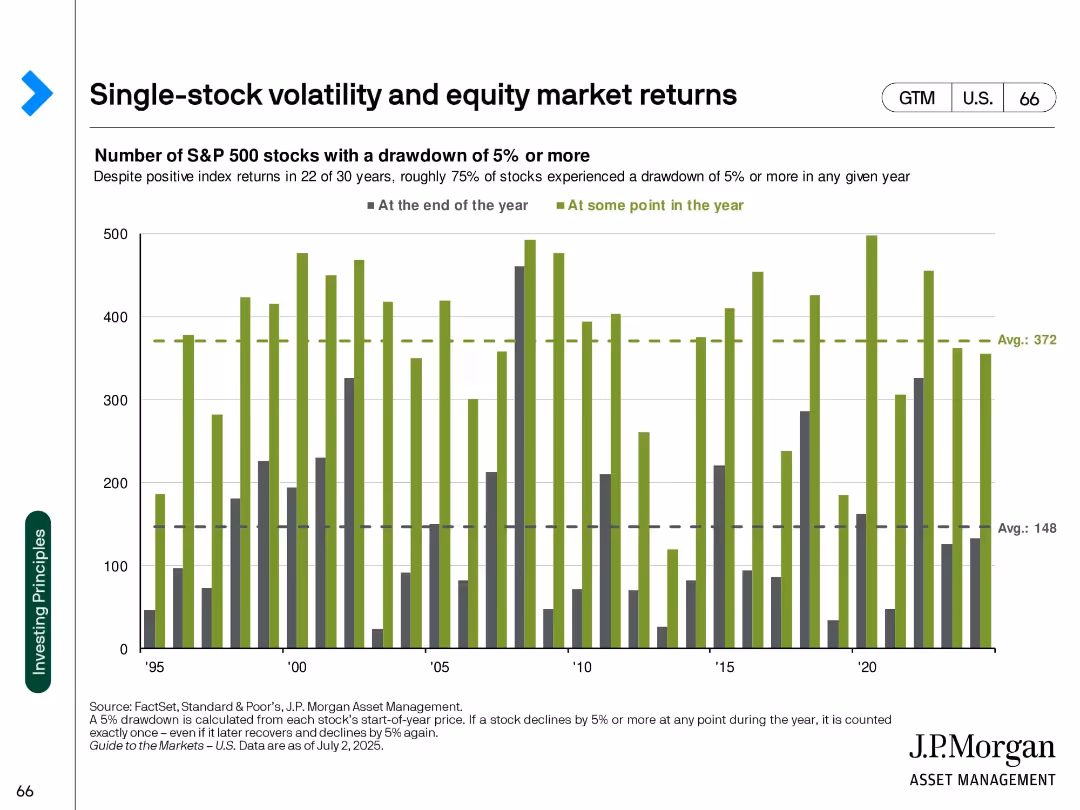
Bar chart with two colored bars per year showing stock drawdowns
Risk Assessment and Management
Financial Services
Highlights that despite strong index-level returns, a majority of S&P 500 stocks experience individual drawdowns of 5% or more each year. Emphasizes intra-year volatility risks.
volatility, drawdowns, single stock risk, S&P 500, market behavior, equity investing, downside risk
false
Single-stock volatility and equity market returnsGuide to the Markets U.S. 3Q 2025
Single Chart
JP Morgan
View slide
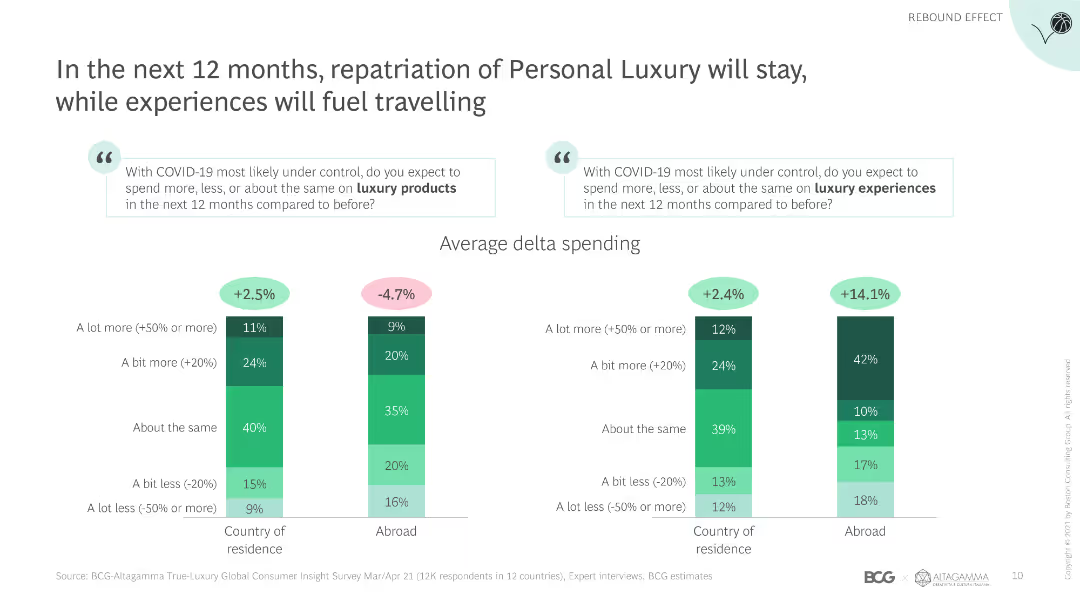
This slide includes column charts comparing spending on luxury products and experiences across different countries, with accompanying text explaining the findings.
Market Analysis and Trends
Retail & E-commerce
The slide analyzes consumer spending trends on luxury products and experiences in the next 12 months, with a focus on repatriation and travel-related luxury spending.
Luxury spending, repatriation, travel, consumer trends, luxury products, experiences, spending patterns, market analysis, next 12 months
false
In the next 12 months, repatriation of Personal Luxury will stay, while experiences will fuel travellingTrue-Luxury Global Consumer Insights 8th Edition
Multiple Chart
BCG
View slide
The slide presents a diagram of the industrial technology stack, illustrating various components and sample companies involved in the process-level, system integration, and instruments levels.
Competitive Landscape
Industrial & Manufacturing
The slide categorizes different companies and technologies involved in industrial automation, highlighting the complexity and diversity of the industrial technology stack.
industrial technology, stack, companies, components, process-level, system integration, instruments
false
There are currently several constituent groups participating in the industrial technology stackIntroduction to a dynamic market with numerous investment opportunities
Framework
LEK
View slide
The slide shows ranked lists and pie charts discussing reasons for employees leaving current firms. The background is split between blue and white, with icons symbolizing each reason.
Human Resources and Talent Management
Professional Services
Examines the primary reasons employees consider leaving, with a focus on misalignment with company vision and compensation issues. Ideal for employee retention strategy development.
employee retention, company vision, compensation, job change reasons, retention strategies, pie charts
false
From employee surveys, misalignment with company vision and culture is a greater reason for early-stage employees to leave, while compensation is a greater reason for late-stage firm employeesASEAN Growth and Scale Talent Playbook
Header Horizontal
Kearney
View slide
Column chart presenting revenues, color-coded for different sectors, and easy-to-read layout.
Financial Performance
Financial Services
Details the net revenues of global banking and markets, showcasing the increased wallet share and returns over years.
Revenues, banking, growth
false
Global Banking & Markets: Increased wallet share and financing driving growth and attractive returnsFull Year and Fourth Quarter 2023 Earnings Results Presentation
Single Chart
Goldman Sachs
View slide
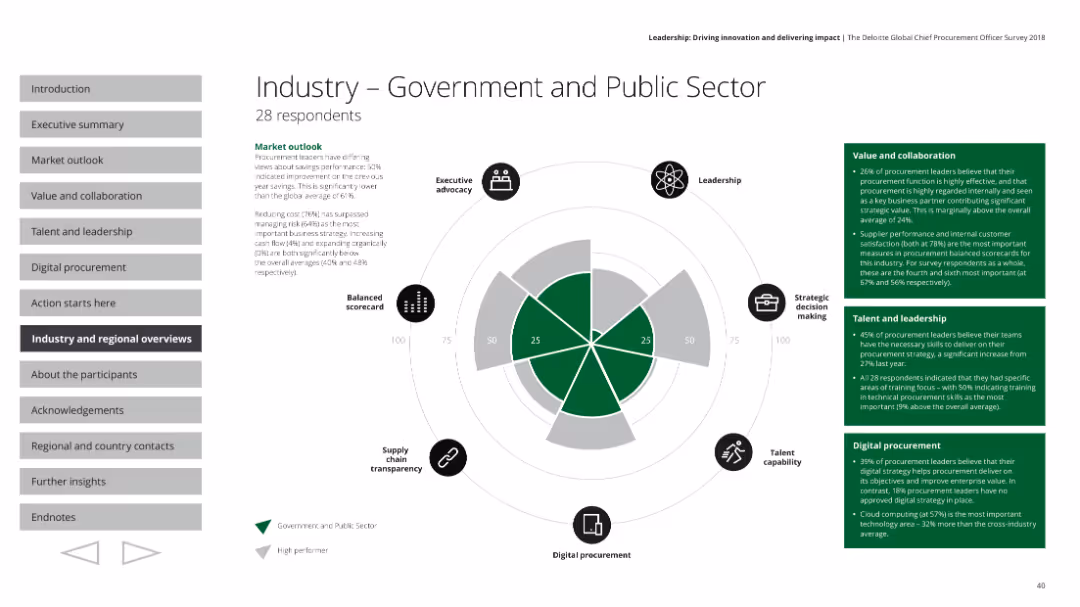
The slide features a radar chart, text boxes with survey results, and small icons indicating various aspects of performance.
Industry Overview
Government & Public Sector
This slide provides an overview of the government and public sector's procurement performance based on a survey. It covers executive advocacy, leadership, strategic decision making, talent capability, digital procurement, and supply chain transparency, with detailed market outlook and specific metrics on value, collaboration, talent, and leadership.
Government, public sector, procurement, radar chart, performance
false
Industry - Government and Public SectorLeadership: Driving innovation and delivering impact The Deloitte Global Chief Procurement Officer Survey 2018
Mixed Chart
Deloitte
View slide
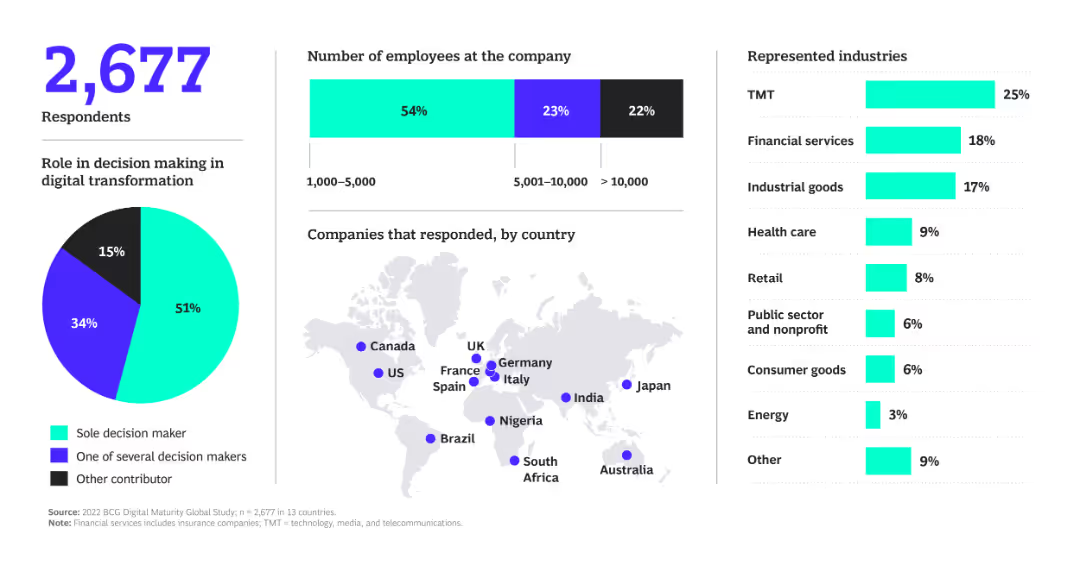
The slide features various visual elements, including a pie chart, bar chart, and map to show respondents' roles, company sizes, and countries.
Technology and Digital Transformation
Professional Services
The slide provides data on the number of respondents, their roles in decision-making, and the countries they represent.
respondents, decision making, company size, countries, digital transformation
false
2,677 Respondents Role in decision making in digital transformationMind the Tech Gap
Multiple Chart
BCG
View slide
Complex slide with a flow diagram indicating the direction of decision-making across teams in a 'Nerve Center'.
Strategic Planning
Professional Services
Details the workflow and decision-making structure within a 'Nerve Center' and its application in crisis management.
workflow, strategic moves, workforce protection, supply chain, customer support, financial stabilization, decision-making
false
Managing across 5Rs requires a new architecture: Nerve Center “Team of teams” with clear roles, responsibilities, and decision authorityCOVID-19: Briefing Note
Diagram
McKinsey
View slide
Slide presents a dark theme with a graph and an information box. A bold bar graph depicts survey results with percentages in contrasting colors, accompanied by a summarizing statement. It has a clear visual hierarchy with the graph as the focal point and an inset box for additional data.
Regulatory and Compliance
Retail & E-commerce
This slide contains a bar graph summarizing survey responses regarding organizational approaches to selling customer data. It is pertinent for presentations analyzing consumer data protection practices and corporate ethics in data management, particularly under regulatory and compliance contexts.
Data Sale, Customer Permission, Survey, Corporate Ethics, Data Protection, Privacy, Regulation, Compliance
false
Most respondents say they will not sell any data or will sell data only with explicit customer permissionConsumers at 250
Single Chart
Kearney
View slide
Featuring horizontal bars, this slide contrasts the user base numbers in 2017 with the estimated figures for 2020E across multiple sectors, highlighting the expected growth.
Market Analysis and Trends
Retail & E-commerce
The slide indicates the projected increase in the online spender base across various sectors, with estimated growth rates suggesting a 2-3x increase, thus providing insights into consumer behavior trends.
Online spending, user base growth, sector comparison
false
Online spender base grows 2-3x across sectorsDigital consumer spending in India: A $100 Bn opportunity
Single Chart
BCG
View slide
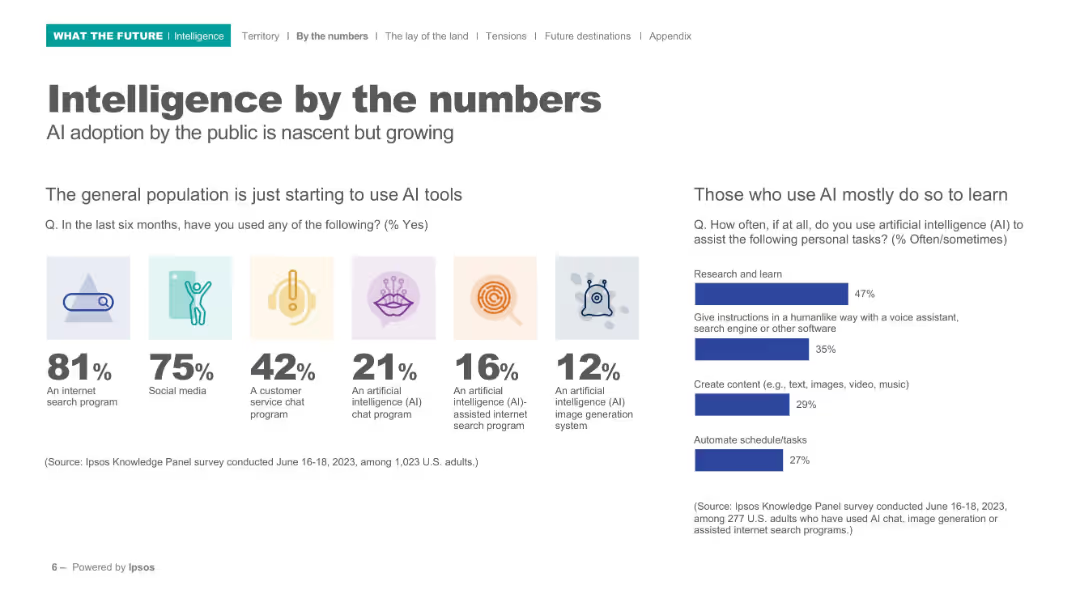
Split layout with icons, bold percentages, and bar charts; clean white background; left section shows icon-based usage stats, right shows bar chart.
Technology and Digital Transformation
Artificial Intelligence
Highlights early adoption trends in AI usage among the general population. Shows top tools used (e.g., search, chat, image generation), and indicates that AI is mostly used for learning. Includes survey data and clear icons to enhance understanding.
AI usage, internet tools, public adoption, learning, survey, Ipsos, image generation, chatbot, statistics, behavior
false
Intelligence by the numbersWHAT THE FUTURE: INTELLIGENCE
Mixed Chart
IPSOS
View slide
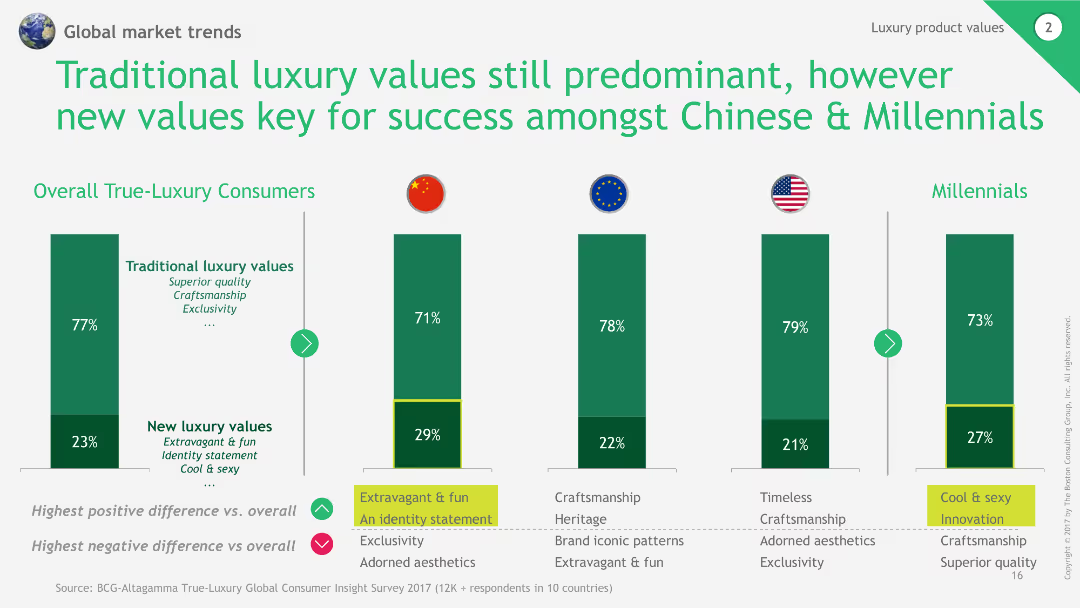
This slide includes a column chart comparing traditional and new luxury values among different demographics, with highlighted differences and supporting text.
Market Analysis and Trends
Consumer Goods
The slide analyzes the importance of traditional versus new luxury values, highlighting the significant differences in preferences among Chinese consumers and Millennials.
luxury values, traditional vs new, demographic comparison, column chart, market trends
false
Traditional luxury values still predominant, however new values key for success amongst Chinese & Millennials2018 True-Luxury Global Consumer Insight
Multiple Chart
BCG
1
...
Next
Load More
Hold On!
We are searching in our database
If nothing, comes up, please try different filters!
Create a FREE account to continue browsing
Receive Instant Access to 1,000+ slides from companies like McKinsey, Google, and Goldman Sachs
First Name
Last Name
Email
Password
I agree to all
Terms & Privacy Policy
Thank you! Your submission has been received!
Oops! Something went wrong while submitting the form.
Have an account?
Sign in
Column Chart
Heatmap
Chevron
Org Chart
Infographic
Callouts
Timeline
List
Graphic
Picture
Process Flow
Diagram
Paragraph
Map
Table
Framework
Subtitle
Takeaway Box
Icon
Other Chart
Radar Chart
Waterfall Chart
Mekko Chart
Pie Chart
Scatter Plot
Line Chart
Bar chart
Bullet points