My Account
My Slides
Search by Category
Templates
View All Templates
Download Template Slides
Leave Feedback
Login
Logout
Get Started
Browse all Slides
Browse all Slides
Create a FREE Account
Instant access to 1,000+ real slides from top companies like McKinsey, BCG, Goldman Sachs, Google and many more!
First Name
Last Name
Email
Password
I agree to all
Terms & Privacy Policy
Thank you! Your submission has been received!
Oops! Something went wrong while submitting the form.
Have an account?
Sign in
Instant access to the internet's best slides
Get access to 40+ advanced filters and more
Advanced Search and Filters
Access to
10,000+ slides
Access to Category Pages
Save/Bookmark Slides
PowerPoint Template Library (New)
Choose your plan
MONTHLY
$12/month
Billed every month, cancel anytime.
YEARLY
$9/month
Billed $108 annually, cancel anytime.
Checkout for $12/month
Checkout for $108/yr
Secured by Stripe | AES-256 bit encryption
Spark Your Next Big Idea with New Presentation Templates
VIEW ALL Templates
Welcome,
Welcome
Upgrade to SlideStart
Pro
Instant access to 15,000+ slides
Show Featured Only
Checkbox 8
Companies
Mckinsey
Bain
BCG
EY
Deloitte
Accenture
PwC/Strategy&
JP Morgan
Goldman Sachs
Morgan Stanley
Citigroup
Deutsche Bank
Barclays
LEK
Kearney
Oliver Wyman
Booz Allen Hamilton
Gartner
IPSOS
Nielsen
Slide type
Header Horizontal
Framework
Vertical Flow
Single Chart
Single Chart
Text Only
Mixed Chart
Header Vertical
Graphic
Pillar
Multiple Chart
Agenda
Title
Table
Linear Flow
Upgrade to SlideStart
Pro
Instant access to 40+ advanced filters
Industry
Upgrade to SlideStart
Pro
Instant access to 40+ advanced filters
Technology
Healthcare
Financial Services
Consumer Goods
Energy & Utilities
Manufacturing
Retail
E-commerce
Logistics
Telecommunications
Real Estate
Professional Services
Education
Media
Entertainment
Hospitatlity
Tourism
Agriculture
Food Production
Government & Public Sector
Environmental
Sustainability
Use Case
Upgrade to SlideStart
Pro
Instant access to 40+ advanced filters
Sales and Business Development
Mergers and Acquisitions
Corporate Finance and Valuation
Performance Metrics and KPIs
Client Case Studies
Competitive Landscape
Product and Service Analysis
Customer and Market Segmentation
Organizational Structure
Human Resources and Talent Management
Industry Overview
Regulatory and Compliance
Risk Assessment and Management
Agriculture & Food Production
Hospitality and Tourism
Government
Environmental
Sustainability
Clear all
Thank you! Your submission has been received!
Oops! Something went wrong while submitting the form.
Show Featured Only
Checkbox 8
Companies
Mckinsey
Bain
BCG
EY
Deloitte
Accenture
PwC/Strategy&
JP Morgan
Goldman Sachs
Morgan Stanley
Citigroup
Deutsche Bank
Barclays
LEK
Kearney
Oliver Wyman
Booz Allen Hamilton
Gartner
IPSOS
Nielsen
Slide type
Text Only
Linear Flow
Vertical Flow
Single Chart
Header Horizontal
Mixed Chart
Header Vertical
Pillar
Multiple Chart
Graphic
Agenda
Title
Table
Framework
Industry
Technology
Healthcare
Financial Services
Consumer Goods
Energy & Utilities
Manufacturing
Retail
E-commerce
Logistics
Telecommunications
Real Estate
Professional Services
Education
Media
Entertainment
Hospitatlity
Tourism
Agriculture
Food Production
Government & Public Sector
Environmental
Sustainability
Use Case
Sales and Business Development
Mergers and Acquisitions
Corporate Finance and Valuation
Performance Metrics and KPIs
Client Case Studies
Competitive Landscape
Product and Service Analysis
Customer and Market Segmentation
Organizational Structure
Human Resources and Talent Management
Industry Overview
Regulatory and Compliance
Risk Assessment and Management
Agriculture & Food Production
Hospitality and Tourism
Government
Environmental
Sustainability
Clear all
Thank you! Your submission has been received!
Oops! Something went wrong while submitting the form.
Tag
View slide
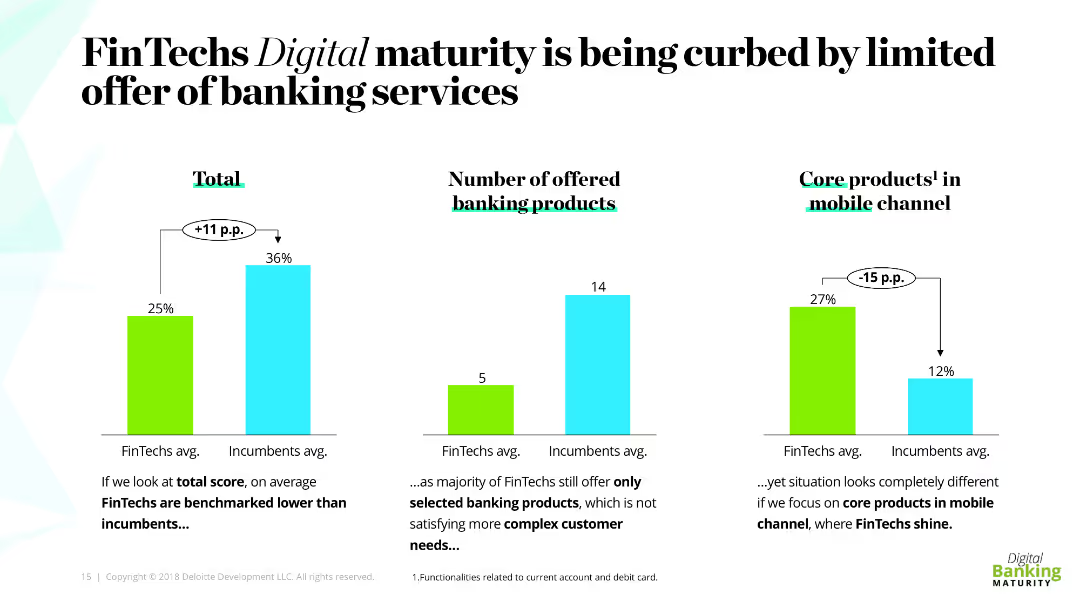
The slide includes three column charts comparing FinTechs and incumbents on total score, number of banking products offered, and core products in the mobile channel. Each chart is accompanied by a brief explanation of the data presented.
Market Analysis and Trends
Financial Services
The slide analyzes the limitations in FinTechs' digital maturity due to a limited range of banking services. It compares FinTechs and incumbents in terms of overall scores, number of banking products offered, and performance in mobile channel services.
FinTechs, incumbents, banking services, digital maturity, comparison
false
FinTechs Digitalmaturity is being curbed by limited offer of banking servicesEMEA Digital Banking Maturity 2018
Multiple Chart
Deloitte
View slide
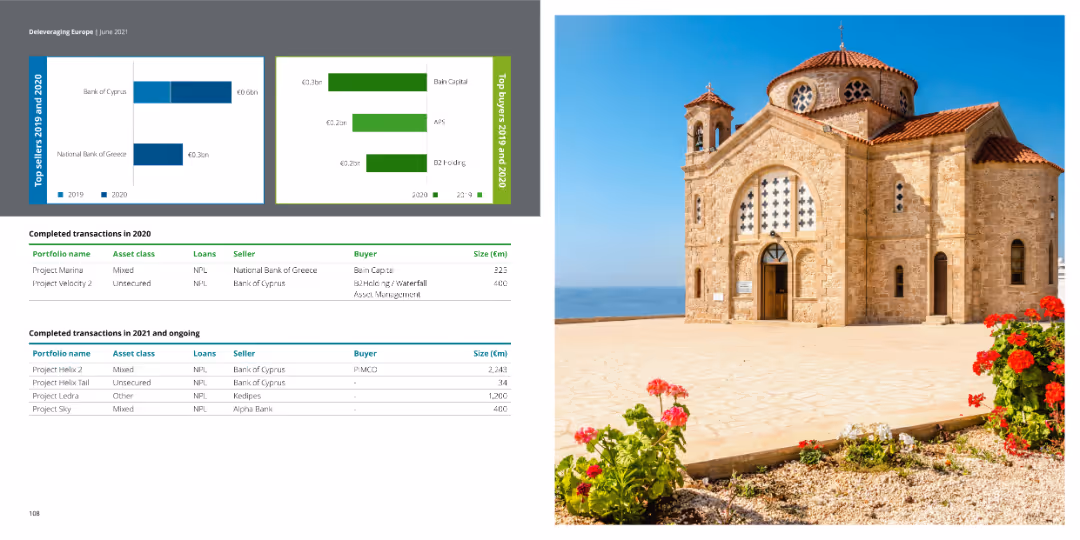
The slide features tables of completed transactions for 2020 and ongoing ones in 2021, with bar charts showing top sellers and buyers for 2019 and 2020. The right side contains an image of a historical site.
Market Analysis and Trends
Financial Services
The slide provides comprehensive data on completed and ongoing financial transactions, listing portfolio names, asset classes, loan types, sellers, buyers, and transaction sizes.
transactions, financial, market, buyers, sellers
false
Project Marina Mixed NPL National Bank of Greece Bain Capital 325Deleveraging Europe
Multiple Chart
Deloitte
View slide
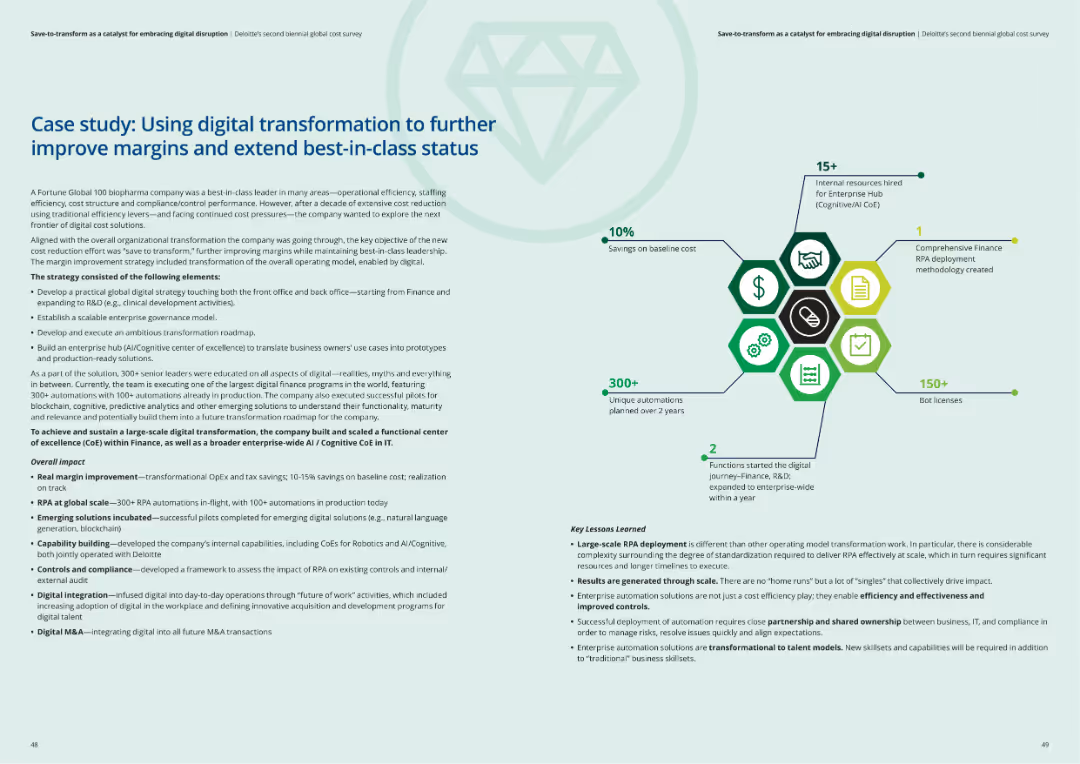
The slide uses a light blue background and a structured layout for presenting a case study. It includes icons representing various aspects of digital transformation and key metrics like savings and RPA deployments.
Technology and Digital Transformation
Healthcare & Pharmaceuticals
This case study highlights how a biopharma company used digital transformation to improve operational efficiency and margin improvement. It details the strategy, implementation, and key outcomes like savings and automation achievements.
digital transformation, margin improvement, biopharma, operational efficiency, RPA deployment
false
Case study: Using digital transformation to further improve margins and extend best-in-class statusSave-to-transform as a catalyst for embracing digital disruption Deloitte’s second biennial global cost survey
Diagram
Deloitte
View slide
The slide presents a color-coded heatmap comparing global manufacturing PMIs, with varying shades indicating performance levels. The complex data is efficiently organized for at-a-glance analysis.
Market Analysis and Trends
Industrial & Manufacturing
Offering a comparative analysis of global manufacturing health, this slide is critical for assessing economic activity and could influence investment decisions in financial and manufacturing sectors. It is structured to provide quick insights into industry performance trends.
PMIs, Global, Manufacturing, Analysis
false
Manufacturing PMIs Were Mixed in Q4 and Remain Weaker Compared to Early 2022Credit Market Monitor
Table
Morgan Stanley
View slide
Text-dominant slide with a professional layout, utilizing bold headers and bullet points to delineate sections and present complex information in a digestible format.
Technology and Digital Transformation
Energy & Utilities
The slide discusses the uncertainties and potential impacts of the conflict in Ukraine on the global energy transition and decarbonization paths. It outlines various scenarios and raises questions regarding government policies, consumer responses, and the broader implications for GDP and energy supply and demand. This slide aims to provoke thought and discussion on how current geopolitical events may shape the future of energy and environmental policy.
Geopolitical, Energy Transition, Ukraine, Decarbonization
false
While developments of the conflict in Ukraine are highly uncertain, today’s decisions could impact the long-term energy transition and path towards decarbonizationGlobal Energy Perspective 2022
Header Horizontal
McKinsey
View slide
Visual timeline of major 2020 global events including the COVID-19 pandemic, stock market crash, and various crises.
Operational Efficiency
Healthcare & Pharmaceuticals
Provides a detailed timeline of key global and healthcare events in 2020, useful for historical analysis and educational purposes.
pandemic, timeline, global events, COVID-19, healthcare, 2020
false
2020: Timeline of a pandemic (and beyond)BAIN-ALTAGAMMA 2020 WORLDWIDE LUXURY MARKET MONITOR
Mixed Chart
Bain
View slide
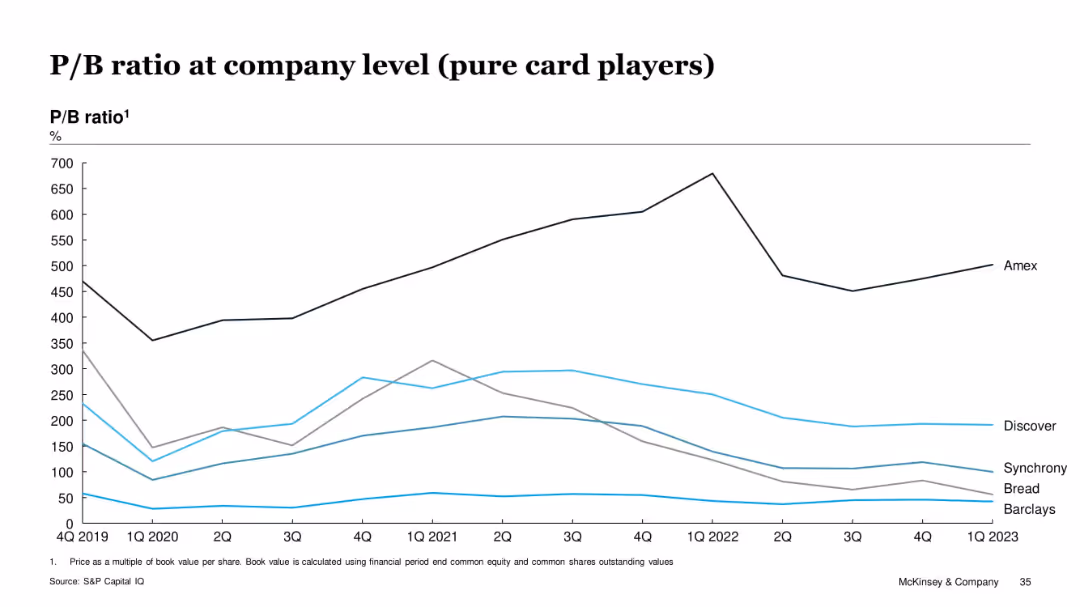
Line chart of price-to-book ratios for Amex, Discover, Synchrony, Barclays, and Bread
Investment Analysis
Financial Services
The slide shows the price-to-book ratio trends of pure card players. Amex consistently trades at a premium (above 500%), while other players like Barclays and Bread show lower valuations. These ratios reflect investor confidence and balance sheet strength differences across players.
P/B ratio, valuation, book value, Amex, credit issuers, financial strength, McKinsey
false
P/B ratio at company level (pure card players)US Credit Card Issuer Performance, 1Q 2023
Single Chart
McKinsey
View slide
A bar graph illustrates the retention rate of new digital service users, with consistent high percentages across multiple service categories.
Market Analysis and Trends
Technology & Software
Illustrates the longevity of digital service adoption among new users, indicating a low likelihood of market retraction post-pandemic.
digital services, long-term adoption, user retention, market stability, service categories, post-pandemic
false
Adoption of digital services has been one way, with no signs of reversal - 9 out of 10 new users in 2020 continue to use them in 2021e-Conomy SEA 2021 Roaring 20s: The SEA Digital Decade
Single Chart
Bain
View slide
Contains detailed text along with a world map illustrating 'DALYs' attributable to ambient air pollution per 100,000 population in 2016, and a bar chart showing data on EU energy-related CO2 emissions over time.
Regulatory and Compliance
Environmental Services & Sustainability
Provides an overview of the impacts of air quality on public health, focusing on DALY metrics to illustrate the global burden of disease linked to air pollution. Discusses the role of monitoring and policy in improving air quality standards.
Air Quality, Public Health, Pollution, DALYs
false
MONITORING OF AIR QUALITY AIR QUALITY: A PUBLIC HEALTH MATTERCOPERNICUS Market report February 2019
Graphic
PwC/Strategy&
View slide
The slide features a bar charts with percentage labels, a map highlighting geographic regions, and text blocks. It visually contrasts broadband impact across different socioeconomic areas.
Market Analysis and Trends
Telecommunications
The slide discusses how increased broadband speeds have lifted GDP in lower socioeconomic areas, with a focus on Greater Melbourne, showing that faster broadband access can drive economic growth.
Broadband, GDP, Socioeconomic, Melbourne, Impact
false
Faster broadband has been an equaliser of opportunity for Australians in lower socioeconomic communitiesThe economic and social impact of investment in the nbn network Key Insights Report
Multiple Chart
Accenture
View slide
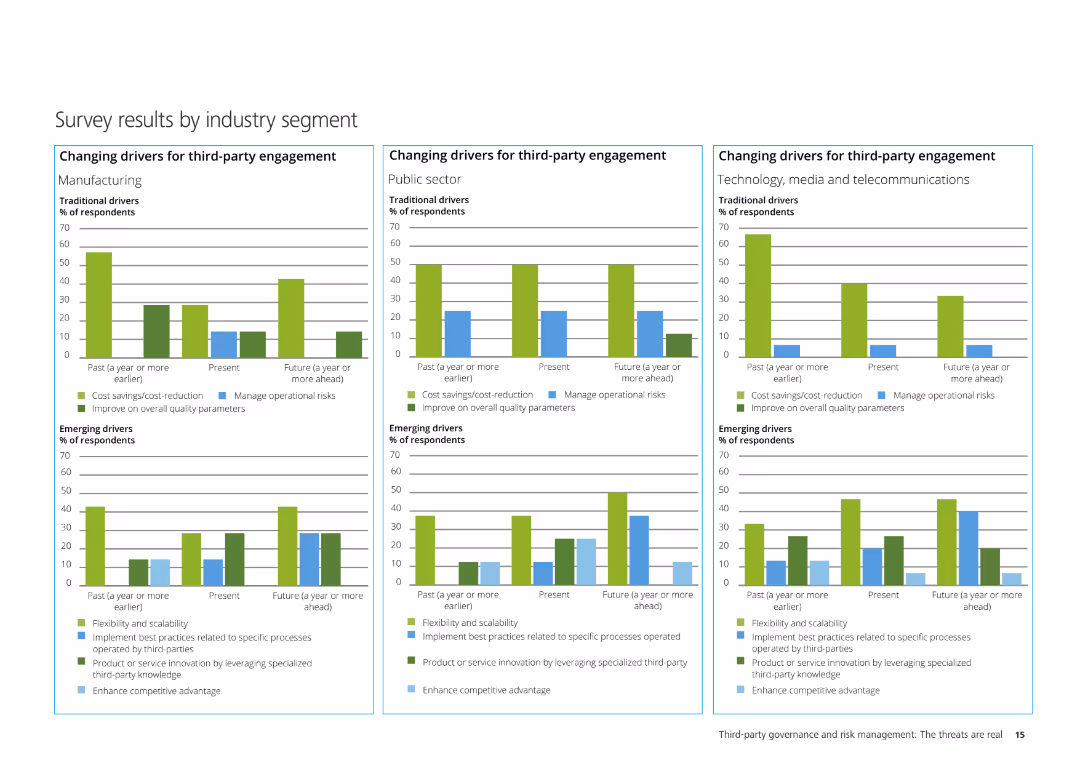
The slide contains three column charts illustrating the changing drivers for third-party engagement in Manufacturing, Public Sector, and Technology, Media & Telecom.
Market Analysis and Trends
Professional Services
It analyzes survey results segmented by industry, showing traditional and emerging drivers for third-party engagement across different industries.
Manufacturing, Public Sector, Technology, Media, Telecommunications, third-party engagement, survey results
false
Survey results by industry segment Changing drivers for third-party engagement ManufacturingThird-party governance and risk management The threats are real
Multiple Chart
Deloitte
View slide
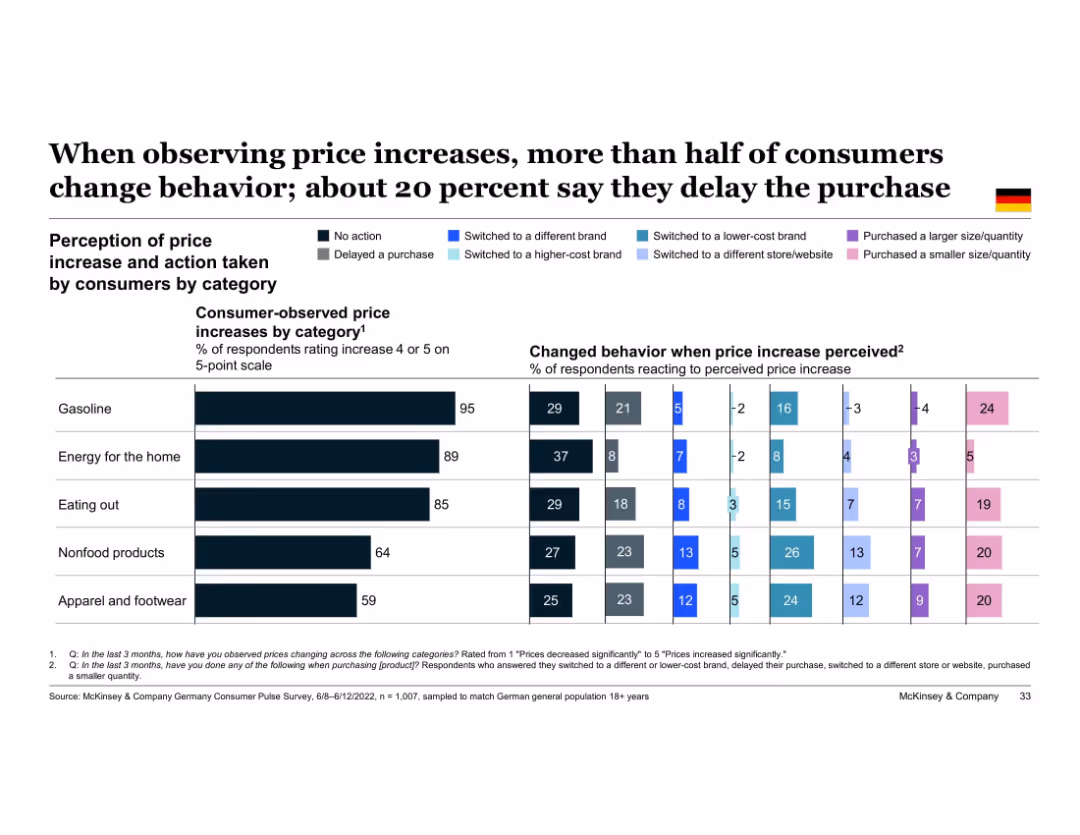
Clustered bar chart showing consumer behavioral response to perceived price increases by category (e.g., gas, apparel); action types color-coded
Pricing Strategies
Retail & E-commerce
Consumers are highly responsive to perceived price increases. Across categories like gasoline, energy, and food, many switch to lower-cost brands or delay purchases. Delaying purchases is particularly common for gas and non-essentials. The slide emphasizes behavior changes in response to inflationary pressure.
price perception, delayed purchase, inflation response, price sensitivity, category behavior, Germany, consumer change
false
When observing price increases, more than half of consumers change behavior; about 20 percent say they delay the purchaseEuropean Consumer Sentiment Survey: How current events in Europe are shaping consumer behavior
Single Chart
McKinsey
View slide
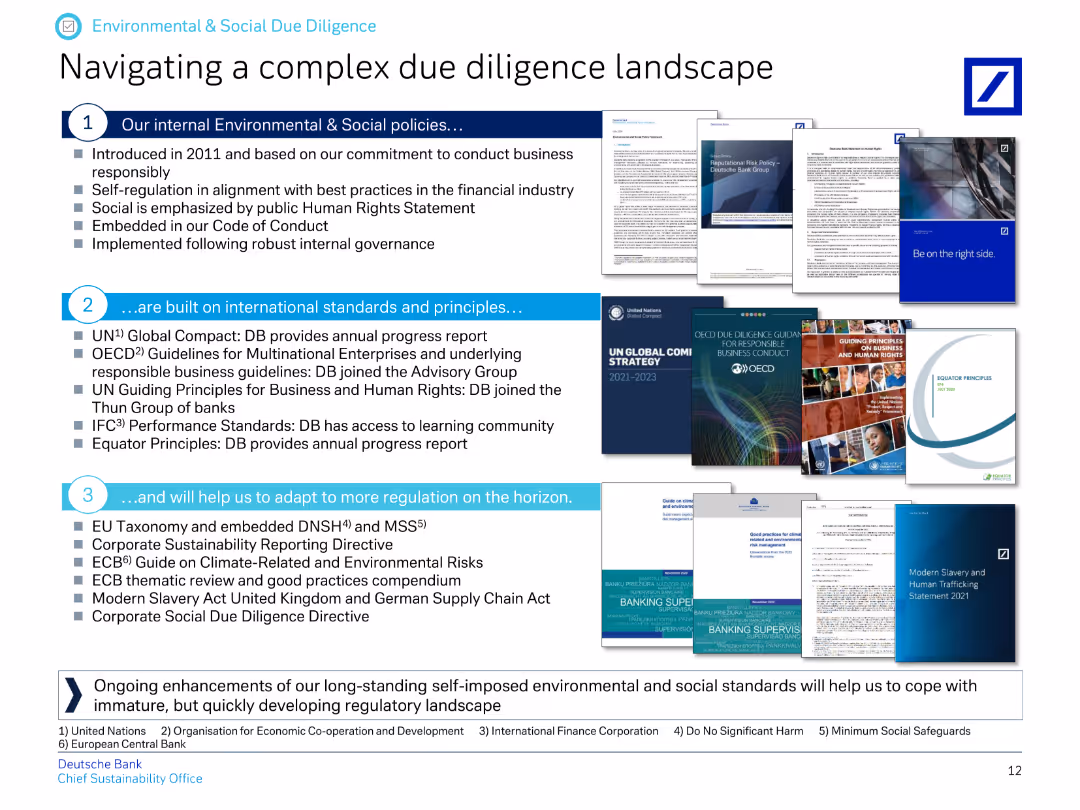
The slide features a numbered list and images of various guidelines and principles related to environmental and social due diligence.
Regulatory and Compliance
Financial Services
It describes Deutsche Bank's internal environmental and social policies, international standards and principles they follow, and how they adapt to new regulations.
due diligence, environmental policies, social policies, international standards, regulatory adaptation, Deutsche Bank
false
Navigating a complex due diligence landscapeInsights into our sustainable finance governance and processes
Header Vertical
Deutsche Bank
View slide
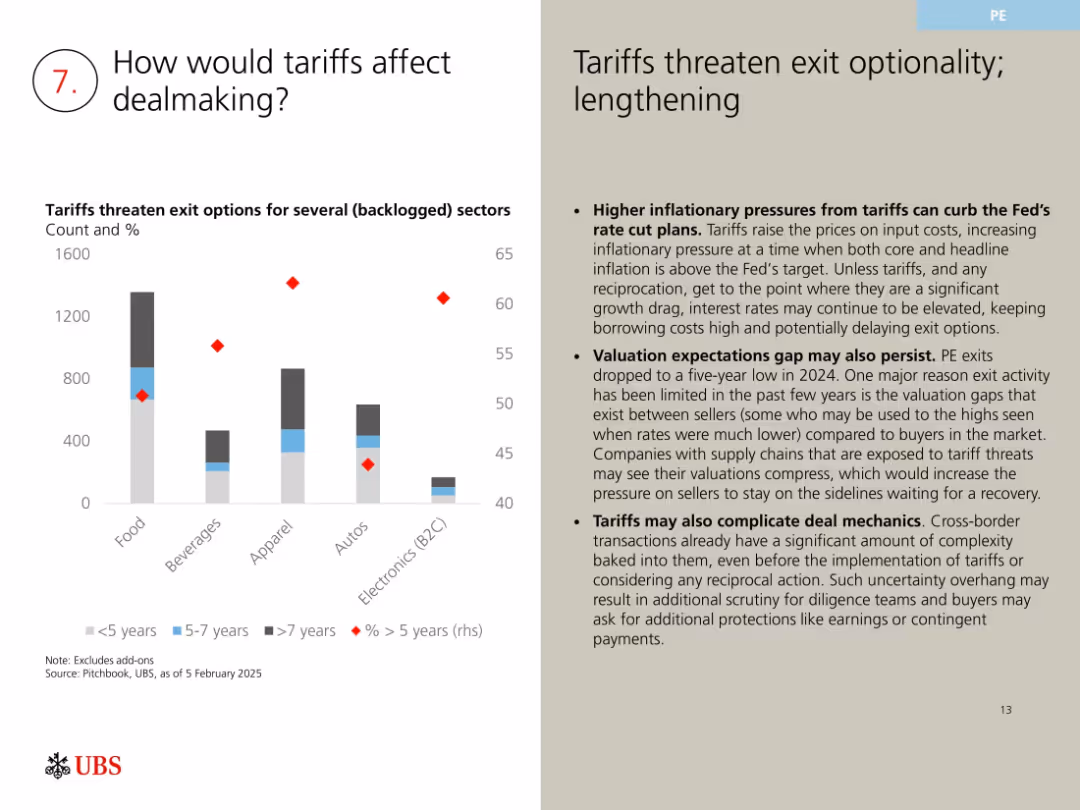
Bar and scatter chart showing deal aging by sector; commentary to the right
Regulatory and Compliance
Financial Services
Examines how tariffs may impact M&A by increasing inflationary pressure, complicating deal structures, and widening valuation gaps. Highlights sectoral risks and suggests potential delays in deal execution due to uncertainty.
tariffs, M&A risk, regulatory pressure, deal timing, exit optionality, valuation gap
false
How would tariffs affect dealmaking?The CEO Macro Briefing Book
Mixed Chart
UBS
View slide
The slide features bar charts showing risks and opportunities percentages. Text boxes detail risks and opportunities, and a summary box highlights key takeaways.
Market Analysis and Trends
Industrial & Manufacturing
It shows survey results indicating a lower perceived need for repositioning in industrial services and IT functions due to digitalization, focusing on R&D and innovation.
Digitalization, industrial services, IT, risks, opportunities, R&D, innovation
false
Only ~40% of leaders in Industrial Services and IT see the need for functions to reposition Highest potential in R&D and Innovation10th Operations Efficiency Radar
Multiple Chart
Roland Berger
View slide
Utilizes text blocks and simple line drawings to depict leadership approaches, integrating visual and textual information with color highlights for separation.
Operational Efficiency
Professional Services
Integrates head, heart, and hands in leadership, outlining strategies for business management and planning during crises with real-world leadership actions from a mining company example.
Leadership, Strategy, Crisis management, Empowerment, Communication
false
New paradigm for skills and talentCOVID-19 BCG Perspectives Publication #5 with a focus on Revamping Organizations for the New Reality
Header Vertical
BCG
View slide
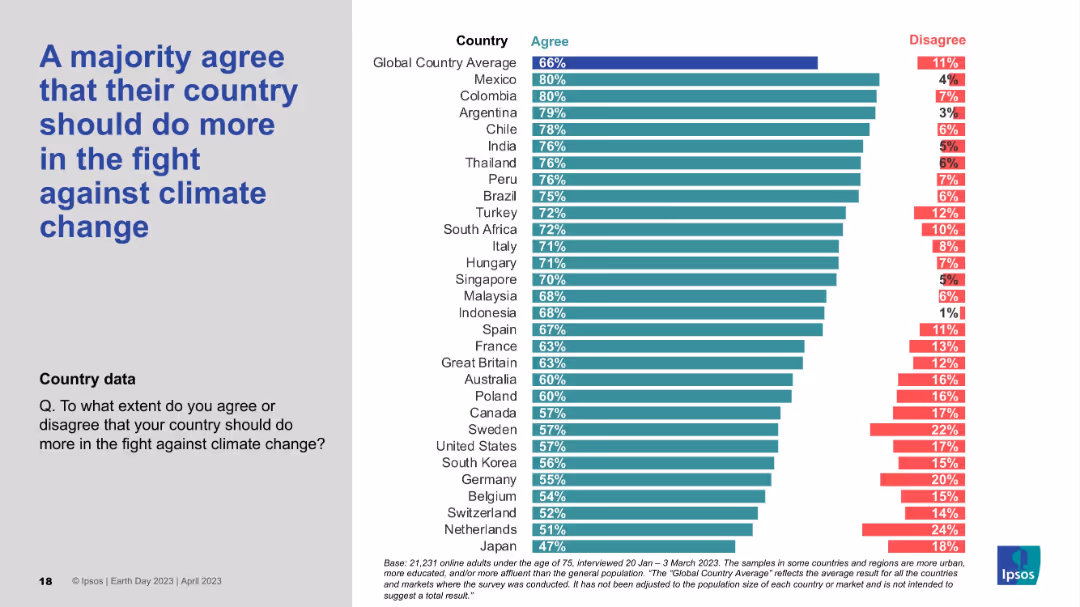
Agreement-disagreement bar chart by country; title on left and list of countries with response percentages on right.
Strategic Planning
Government & Public Sector
This slide captures a strong global consensus that countries should do more in the fight against climate change. Over 66% globally agree, with LATAM countries like Mexico, Colombia, and Argentina showing the highest urgency. Japan and several EU nations show lower agreement.
Climate action, National responsibility, Public opinion, Ipsos, Global urgency
false
A majority agree that their country should do more...EARTH DAY 2023
Mixed Chart
IPSOS
View slide
Features a bar chart and a column chart with time frames for financial value delivery and expectations for delivery speed. The design incorporates a blue-purple gradient and numerical annotations for quick reference.
Strategic Planning
Professional Services
Offers a forecast of the financial value expected from reinvention strategies and their delivery timelines, comparing reinventors to transformers and optimizers. It's beneficial for financial planning and strategy sessions aimed at forecasting and comparing transformation paces.
Financial Value, Reinvention Strategies, Forecasting, Delivery Timelines, Comparative Analysis, Strategy Pacing, Transformation Approaches, Value Realization
false
What proportion of the financial value was/do you expect to be delivered within the following time periods?Total Enterprise Reinvention
Multiple Chart
Accenture
View slide
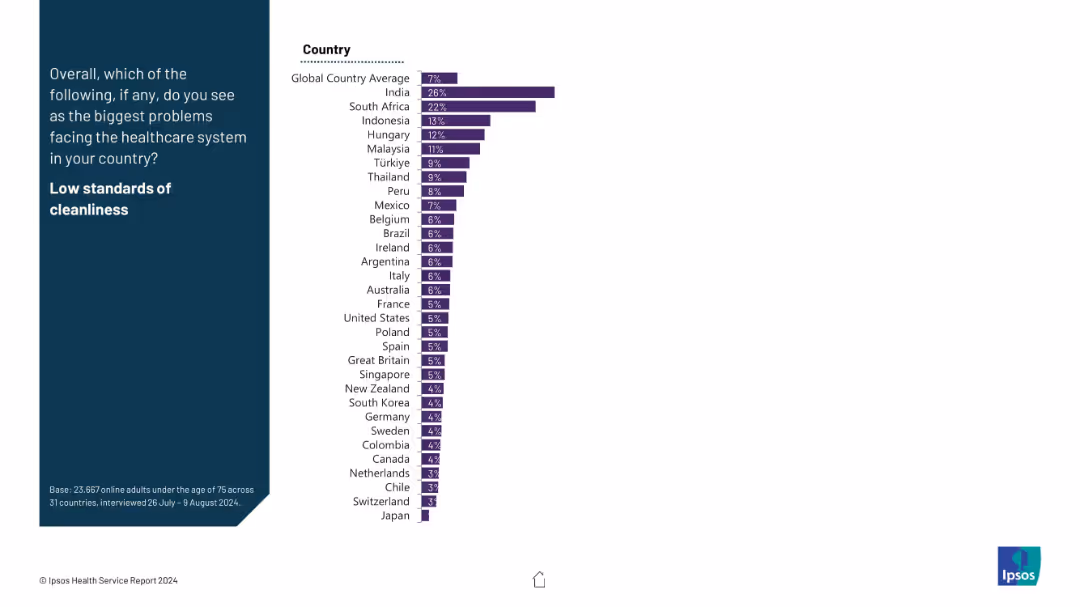
Two-column layout; left side features the question in white on dark blue background; right side has a horizontal bar chart ranking countries by percentage identifying low cleanliness standards as a major healthcare issue.
Risk Assessment and Management
Healthcare & Pharmaceuticals
This slide presents global public opinion on whether low cleanliness standards are a key healthcare issue. India (26%) and South Africa (22%) report the highest concern, far above the global average of 7%. Data is from a survey conducted across 31 countries.
healthcare, cleanliness, public opinion, global comparison, Ipsos, survey, healthcare issues, risk, standards
false
Low standards of cleanlinessIPSOS HEALTH SERVICE REPORT 2024
Mixed Chart
IPSOS
View slide
Column chart detailing merger and acquisition trends in the Philippines, against a background image of power lines at sunset.
Mergers and Acquisitions
Financial Services
Discusses trends in M&A activity from 2018 to 2020, highlighting a decrease in deal volume and value, with focus on high-value transactions.
M&A, trends, Philippines, deal volume, high-value, pandemic impact, financial services
false
04 Mergers and AcquisitionsDoing business in the Philippines 2021
Mixed Chart
Deloitte
View slide
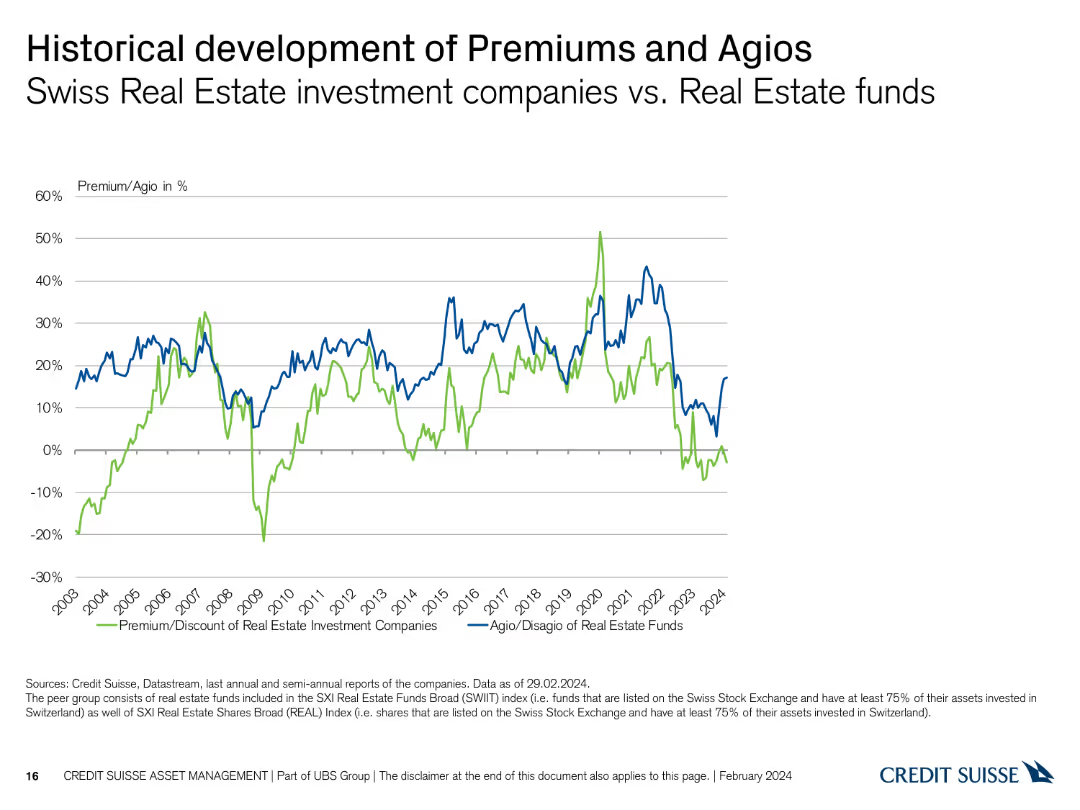
This slide features a line chart depicting the historical development of premiums and agios for Swiss Real Estate investment companies versus Real Estate funds.
Market Analysis and Trends
Real Estate & Construction
It compares historical premium and agio rates, providing insights into market trends and performance over time in the Real Estate sector.
historical trends, premiums, agios, Real Estate, investment companies, funds
false
Historical development of Premiums and Agios Swiss Real Estate investment companies vs. Real Estate fundsSwiss Real Estate Funds At a glance
Single Chart
Credit Suisse
View slide
Column chart show migration volumes between and within regions, using contrasting colors for clarity.
Market Analysis and Trends
Government & Public Sector
Analyzes regional and interregional migration patterns, highlighting European mobility.
migration, Europe, interregional, patterns, analysis
false
Northern America and Europe host the majority of interregional migrants – Within their region, Europeans migrate the mostRoland Berger Trend Compendium 2030: Megatrend 1 People & Society
Mixed Chart
Roland Berger
View slide
Contains a list of US proprietary data assets and their uses, paired with textual descriptions of AI advantages in Equifax’s operations, emphasizing the integration of AI technologies and data assets.
Technology and Digital Transformation
Technology & Software
The slide provides an overview of how Equifax leverages its proprietary data alongside advanced AI capabilities to enhance decision-making processes and product development, highlighting the strategic use of technology in business.
AI capabilities, proprietary data, technology, Equifax
false
EFX driving leading AI capabilities leveraging EFXCloud and EFX unique proprietary dataBarclays Credit Bureau Day
Header Horizontal
Barclays
View slide
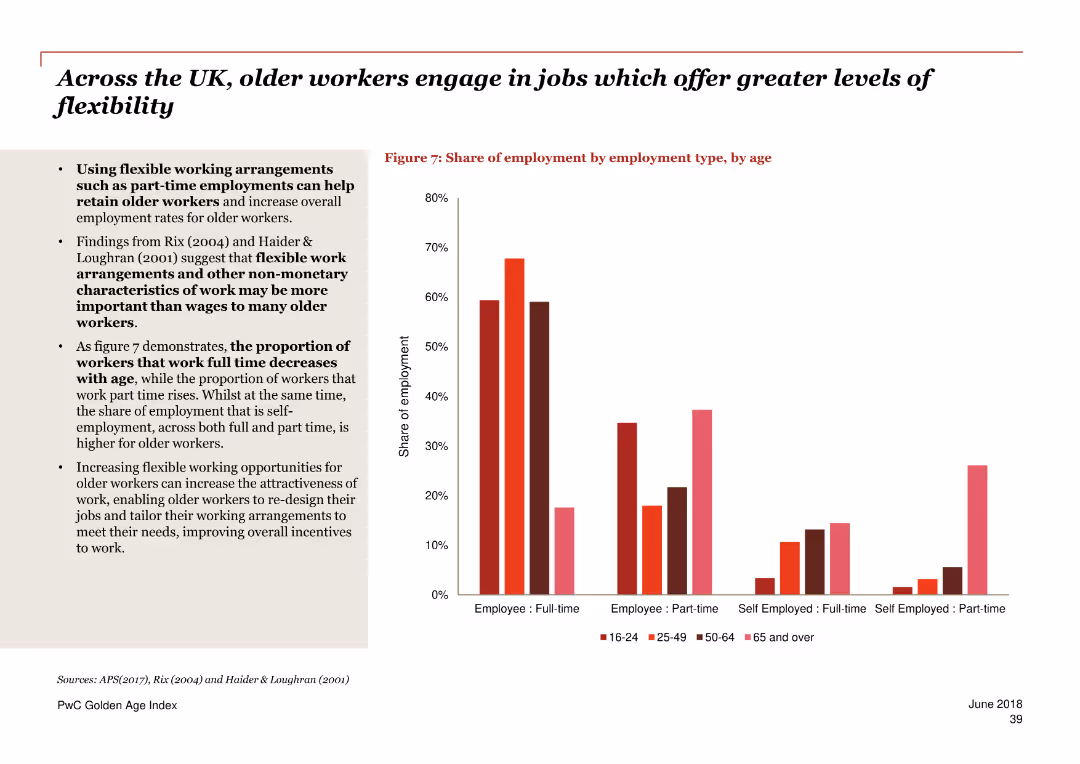
The slide includes a bar chart depicting the share of employment by type and age group. It also contains text discussing the importance of flexible working arrangements for retaining older workers and increasing their employment rates.
Human Resources and Talent Management
Government & Public Sector
The slide discusses how flexible work arrangements can help retain older workers and increase their employment rates. It highlights the shift towards part-time and self-employment as workers age, emphasizing the benefits of flexible working options.
flexible work, older workers, employment types, part-time, self-employment, retention, UK, work arrangements
false
Across the UK, older workers engage in jobs which offer greater levels of flexibilityPwC Golden Age index Unlocking a potential $3.5 trillion prize from longer working lives
Mixed Chart
PwC/Strategy&
View slide
The slide has a column chart showing the premium or discount of various real estate investment companies.
Market Analysis and Trends
Real Estate & Construction
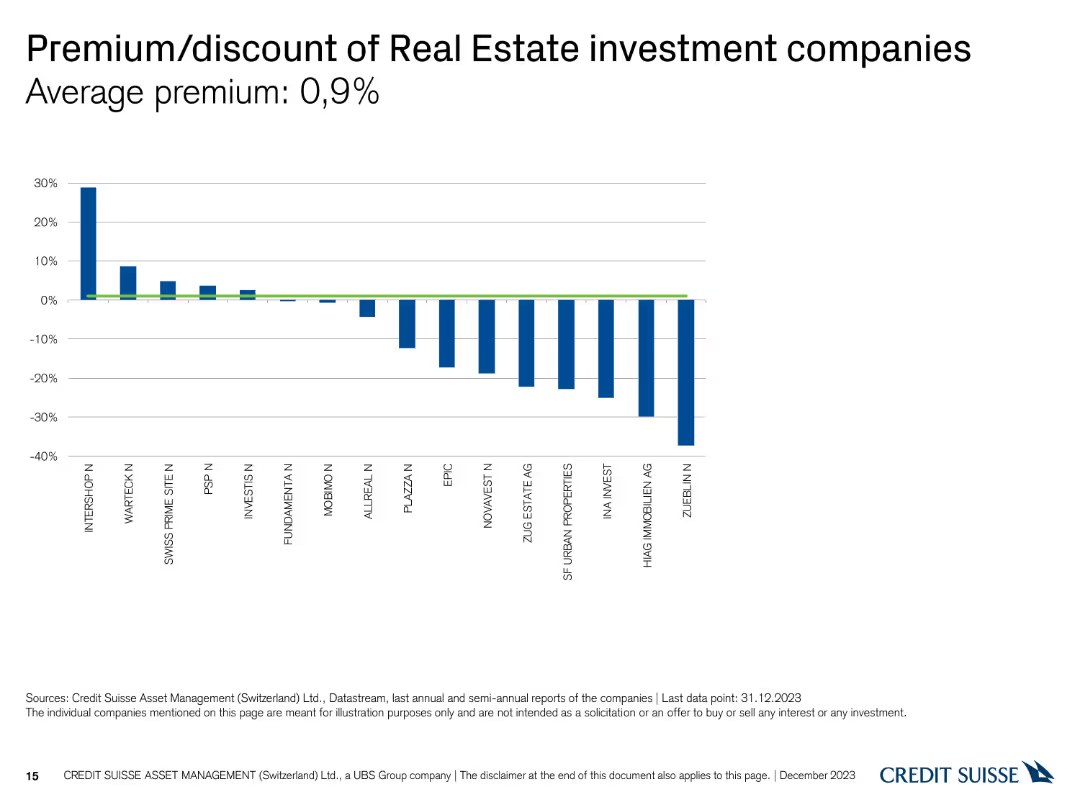
This slide compares the premium and discount percentages of different real estate investment companies, highlighting an average premium of 0.9% as of December 31, 2023.
premium, discount, real estate, investment, companies
false
Premium/discount of Real Estate investment companies Average premium: 0,9Swiss Real Estate Funds At a glance December 2023
Single Chart
Credit Suisse
View slide
Slide contains a combination of graphs and lists detailing revenue enabled, growth rates, and data utilization across Europe.
Market Analysis and Trends
Technology & Software
Analyzes the economic benefits derived from satellite data by intermediate users in Europe, highlighting growth rates and revenue across different sectors.
Satellite data, revenue, growth rate, Europe, economic impact
false
OVERVIEW OF INTERMEDIATE USERS’ BENEFITS (1/2)COPERNICUS Market report February 2019
Multiple Chart
PwC/Strategy&
View slide
The slide has a column chart and a title "Chapter 1." The chart shows the top five risk types expected to require attention from the CRO.
Market Analysis and Trends
Financial Services
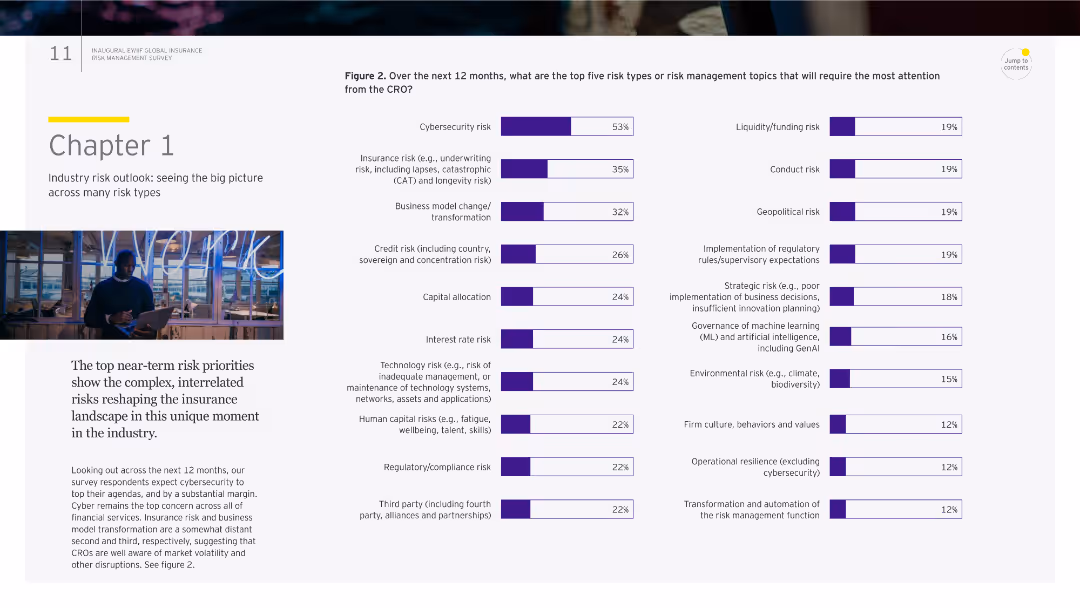
This slide presents the top risk priorities for the insurance industry over the next 12 months, focusing on cybersecurity, insurance risk, and business model changes.
risk outlook, cybersecurity, insurance, market trends, CRO
false
Figure 2. Over the next 12 months, what are the top five risk types or risk management topics that will require the most attention from the CRO?Figure 2. Over the next 12 months, what are the top five risk types or risk management topics that will require the most attention from the CRO?Risk management in a time of transformation
Multiple Chart
EY
View slide
Split layout with two radial charts, plant imagery, and icons. Green and blue color scheme with bold headings.
Market Analysis and Trends
Agriculture & Food Production
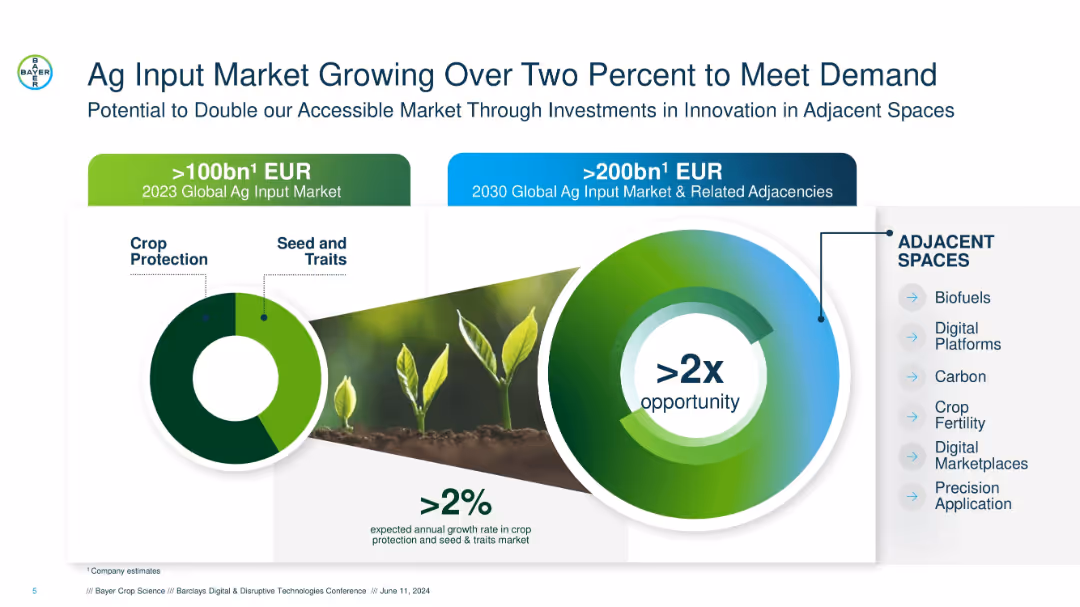
Highlights the projected doubling of the agricultural input market by 2030, emphasizing >2x opportunity via innovations and adjacent investments like biofuels, digital platforms, and crop fertility.
ag inputs, crop protection, growth rate, adjacent markets, seed traits, digital platforms, 2030 projection, >2x market
false
Ag Input Market Growing Over Two Percent to Meet DemandBarclays Digital & Disruptive Technologies Conference
Mixed Chart
Barclays
View slide
The slide features a line chart showing the public sector primary balance, a combined line/bar chart for social security and payroll expenditures, and a line chart depicting gross debt as a percentage of GDP.
Regulatory and Compliance
Financial Services
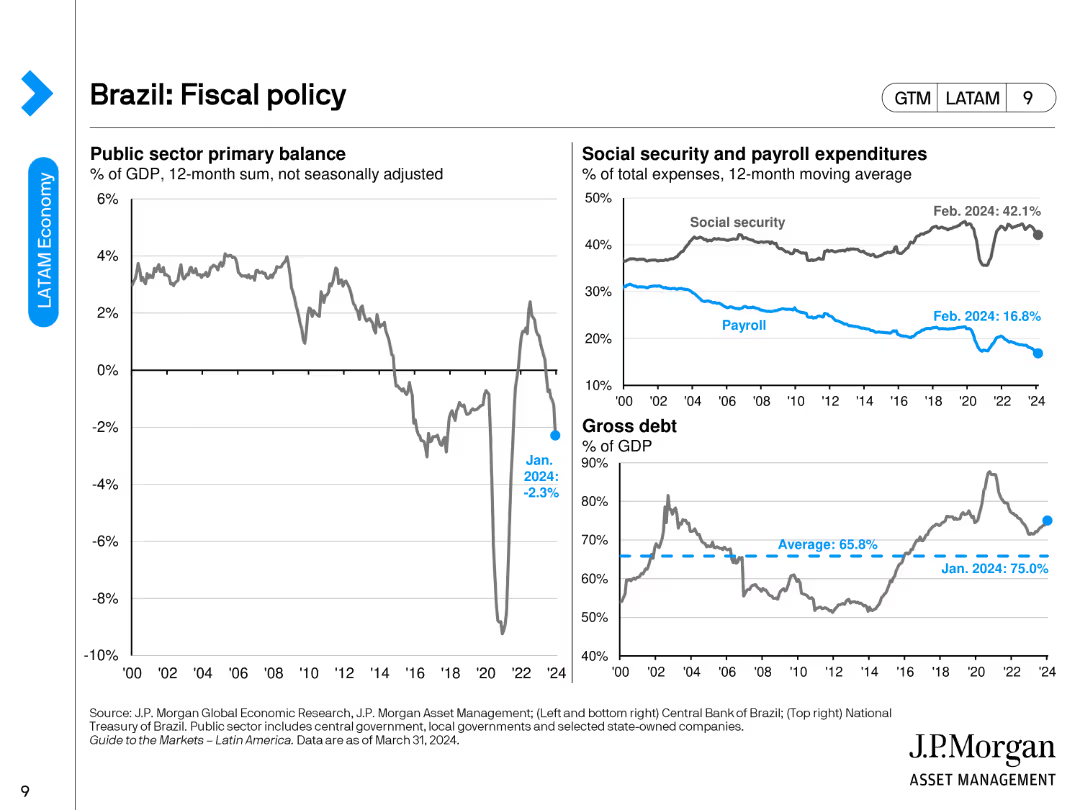
The slide presents Brazil's fiscal policy overview, including public sector balance, social security, payroll expenditures, and gross debt metrics.
Brazil, fiscal policy, public sector balance, social security, gross debt
false
Brazil: Fiscal policyGuide to the Markets Latin America | 2Q 2024
Multiple Chart
JP Morgan
View slide
Line graph displaying e-commerce revenue growth from 2017 to 2025 in eight countries, with a detailed analysis text on the left.
Market Analysis and Trends
Retail & E-commerce
Details significant growth in e-commerce revenue, attributing it to increased digital maturity and internet usage in target markets.
e-commerce, digital maturity, revenue growth, internet usage, target markets, growth analysis, 2017-2025, countries
false
These are some of the findings that shaped this paper:The next billion consumers
Mixed Chart
Accenture
View slide
Column chart showing the market value of crypto investment funds held, with categories ranging from less than $1,000 to over $1,000,000.
Market Analysis and Trends
Financial Services
Shows the market value distribution of crypto investment funds held by owners, highlighting the various ranges of investment amounts.
investment funds, crypto market, value distribution, financial analysis, investment trends
false
Market Value of Crypto Investment Funds HeldCRYPTO ASSET SURVEY
Single Chart
IPSOS
View slide
The slide features bar charts and tables showcasing the function by ethnicity, and the gender breakdown for Hispanic employees across different years.
Human Resources and Talent Management
Professional Services
The slide analyzes the ethnic diversity of employees, with a focus on Hispanic employees and their roles in investment, finance, and other functions.
ethnic diversity, Hispanic employees, gender diversity, employee functions, investment firms
false
Racial diversity by characteristics of investment professionalsVC Human Capital Survey
Mixed Chart
Deloitte
View slide
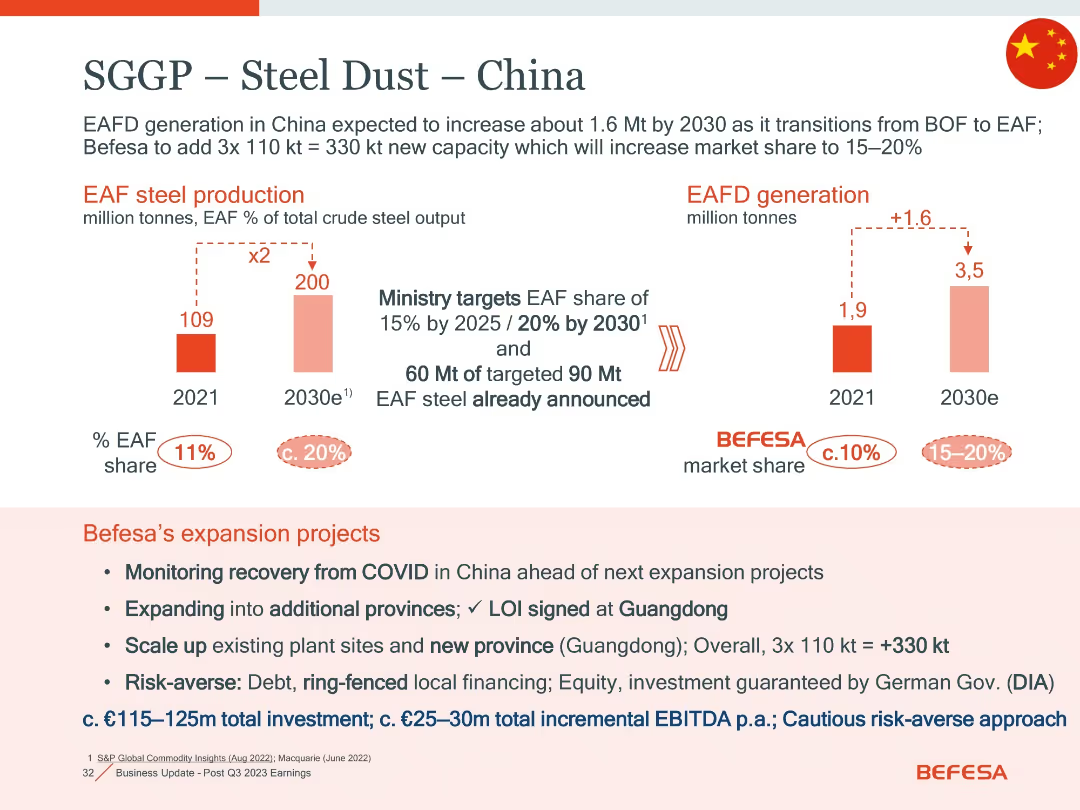
Dual bar chart format, comparing 2021 vs. 2030e EAF steel production and EAFD generation; includes market share and text on expansion strategy
Strategic Planning
Industrial & Manufacturing
Focuses on China's EAF and EAFD growth potential driven by policy and industrial transition. Highlights Befesa’s projected capacity increases and market share strategy through cautious, phased expansion and government-backed investment.
China, EAFD, steel dust, market share, expansion, capacity, investment, risk-averse, decarbonisation
false
SGGP – Steel Dust – ChinaGoldman Sachs 4th Annual Carbonomics Conference
Mixed Chart
Goldman Sachs
View slide
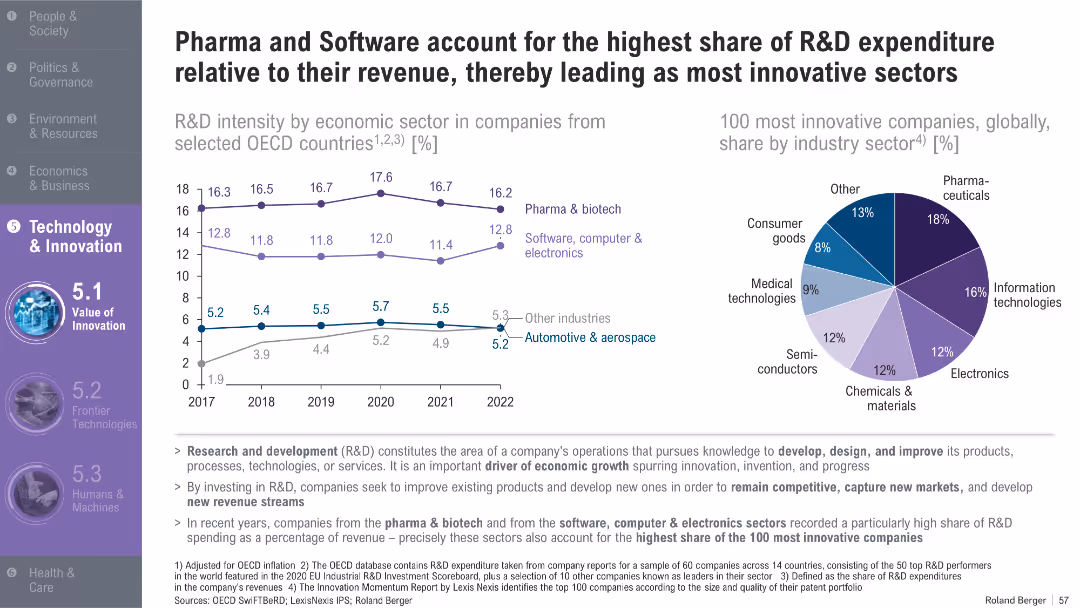
Line graph showing R&D intensity across sectors (2017–2022); pie chart for most innovative industries globally; supportive bullet points
Product and Service Analysis
Healthcare & Pharmaceuticals
This slide compares R&D spending relative to revenue in key sectors, showing that pharma and software consistently lead. A global innovation ranking further supports their dominance among top-performing firms.
R&D intensity, pharma, software, innovation, OECD, biotech, electronics, expenditure, sectors, competitiveness
false
Pharma and Software account for the highest share of R&D expenditure relative to their revenue, thereby leading as most innovative sectorsTrend Compendium 2050 Six megatrends that will shape the world
Multiple Chart
Roland Berger
View slide
The slide contains a flowchart illustrating the components of the market model, including vehicle production volumes, hydrogen penetration rates, and market value calculation.
Strategic Planning
Financial Services
Describes the framework for building the market model based on expert views, covering key factors like production volumes and hydrogen capacity per vehicle.
market model, hydrogen, vehicle production, penetration rate, market value, framework, calculation, expert views
false
Our market model is built based on bottom up use cases and confronted with experts' recent views of the marketRoland Berger views on H2 market development
Diagram
Roland Berger
View slide
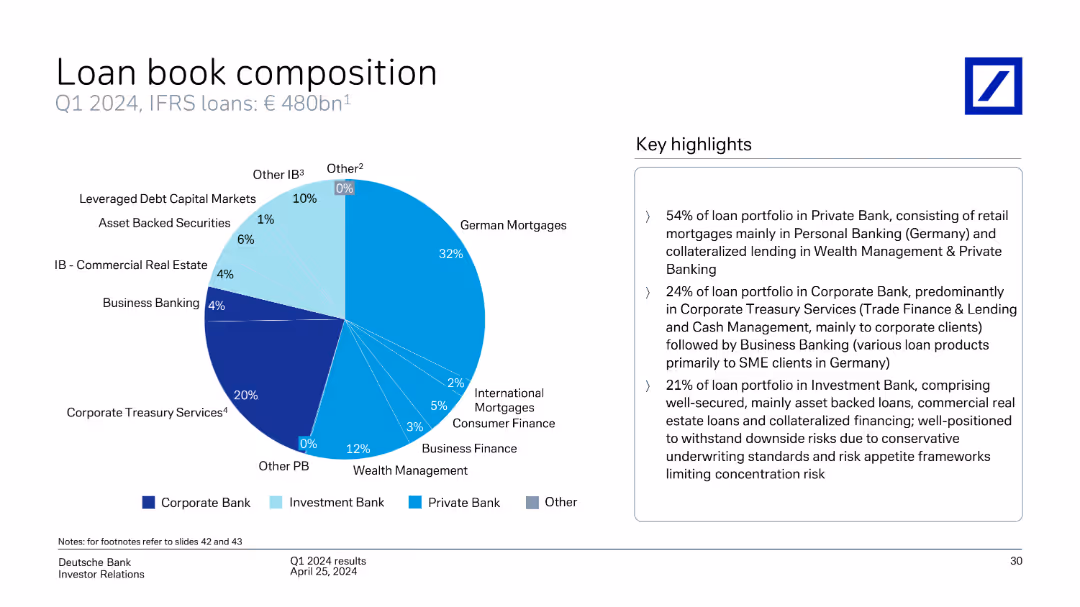
This slide includes a pie chart showing the composition of Deutsche Bank's loan book by type (German Mortgages, Corporate Treasury Services, etc.) as of Q1 2024.
Financial Performance
Financial Services
The slide details the composition of Deutsche Bank's loan book as of Q1 2024, breaking down the types of loans (German Mortgages, Corporate Treasury Services, etc.) and providing key highlights of the portfolio distribution.
loan book, composition, types, portfolio, German Mortgages, Corporate Treasury Services, Deutsche Bank, Q1 2024
false
Loan book composition Q1 2024, IFRS loans: € 480bn 1Q1 2024 results
Mixed Chart
Deutsche Bank
View slide
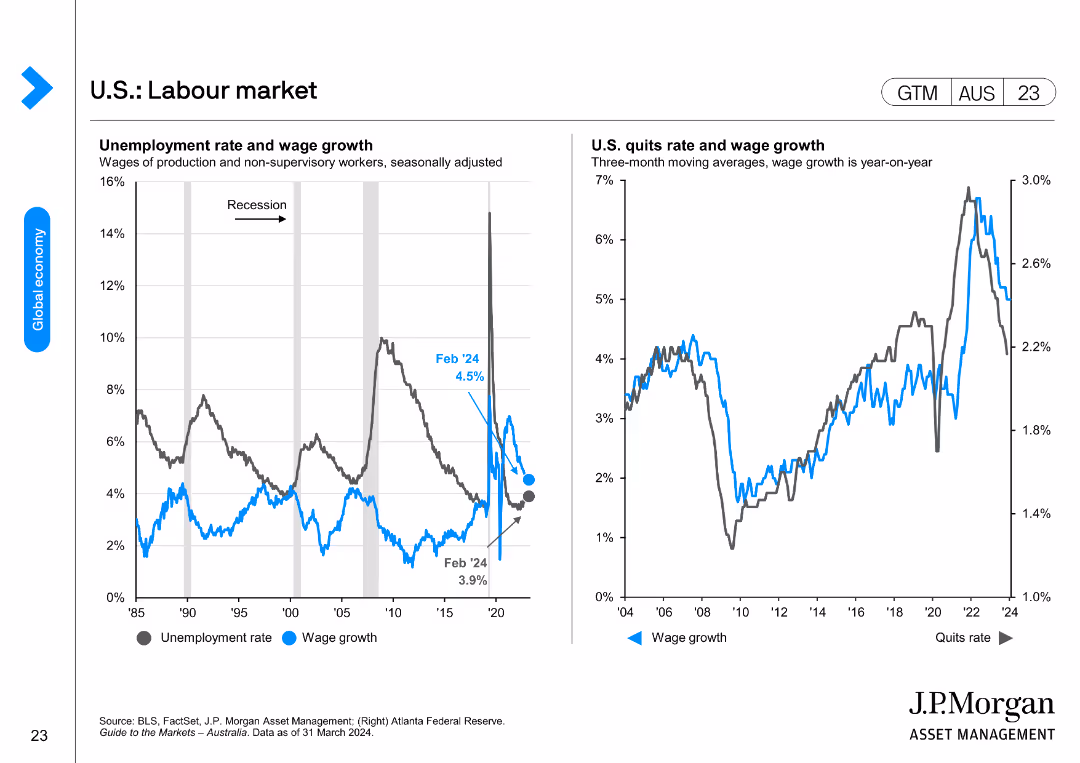
The slide contains two line charts. The left chart shows the U.S. unemployment rate and wage growth from 1985 to 2024. The right chart depicts the U.S. quits rate and wage growth year-on-year from 2004 to 2024.
Market Analysis and Trends
Financial Services
This slide analyzes the U.S. labor market by examining unemployment, wage growth, and quits rate, providing insights into employment trends and economic conditions.
Labor Market, Unemployment, Wage Growth, U.S., Trends
false
U.S.: LabourmarketGuide to the Markets Australia | 2Q 2024
Multiple Chart
JP Morgan
View slide
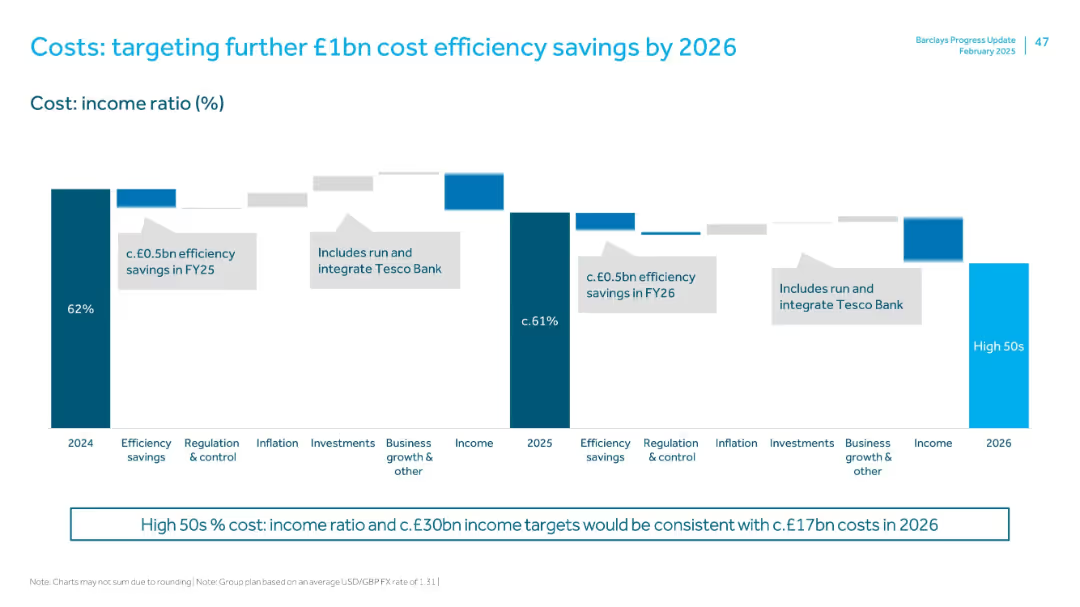
Waterfall chart outlining cost:income ratio (CIR) changes from 2024–2026, highlighting efficiency drivers and integration costs.
Operational Efficiency
Financial Services
Details Barclays’ plan to reduce CIR from 62% (2024) to high 50s by 2026. Targets £1bn in cost savings via efficiency gains, business growth, and integrating Tesco Bank. Reinforces income and regulatory factors.
cost savings, efficiency, Tesco Bank integration, CIR, operational improvement
false
Costs: targeting further £1bn cost efficiency savings by 2026FY 2024 Results Presentation
Mixed Chart
Barclays
View slide
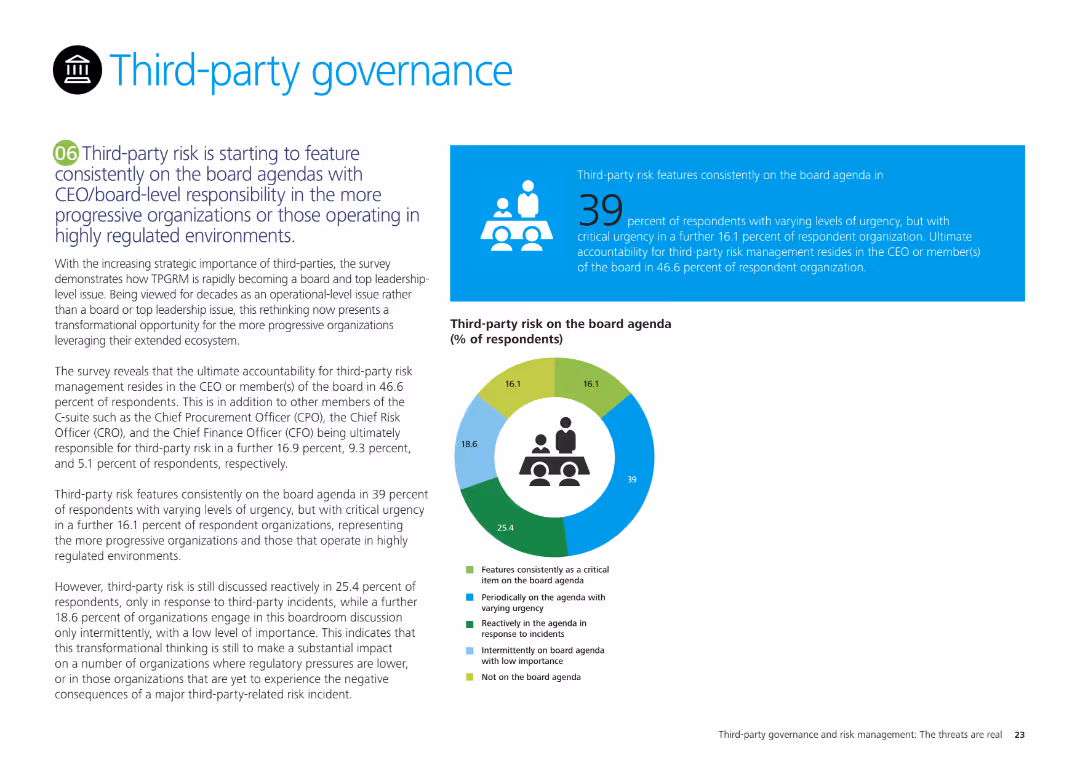
The slide features a pie chart showing the percentage of third-party risk on board agendas and a text box discussing third-party governance trends.
Regulatory and Compliance
Professional Services
It highlights the growing importance of third-party risk in board agendas, detailing survey results on the frequency and urgency of third-party risk discussions at the board level.
Third-party governance, board agendas, risk management, survey results, compliance
false
Third-party risk is starting to feature consistently on the board agendas with CEO/board-level responsibility in the more progressive organizations or those operating in highly regulated environments.Third-party governance and risk management The threats are real
Mixed Chart
Deloitte
View slide
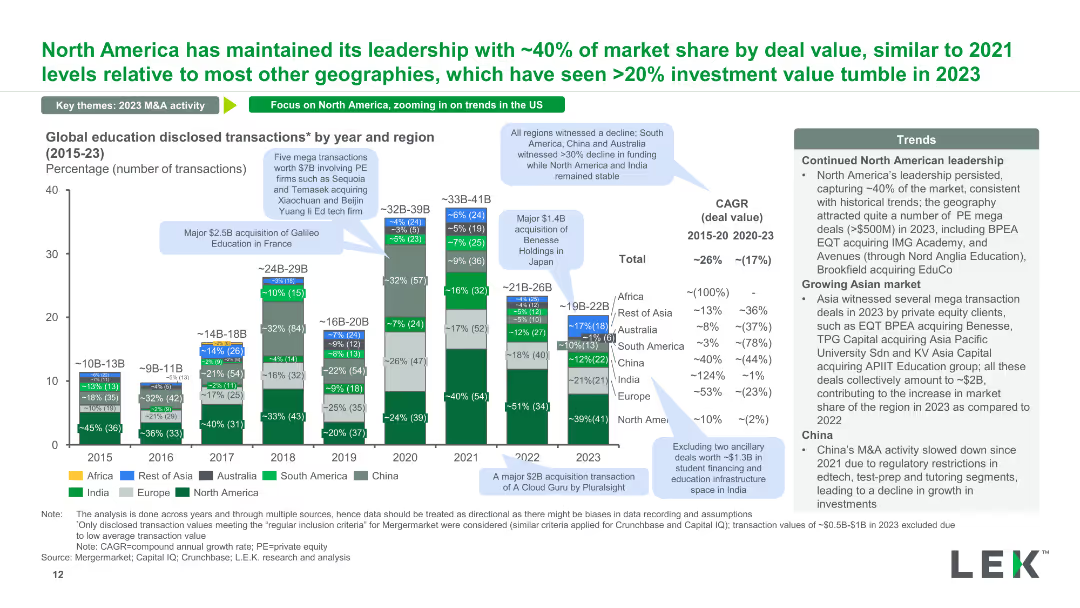
A stacked column chart displaying the number of global education disclosed transactions by year and region from 2015 to 2023. Annotations provide context on significant transactions and regional trends.
Market Analysis and Trends
Education & Training
This slide shows the distribution of disclosed transactions in the education sector across different regions over time, highlighting major deals and geographical trends in investment.
disclosed transactions, global education, regional trends, annual data, major deals
false
North America has maintained its leadership with ~40% of market share by deal value, similar to 2021 levels relative to most other geographies, which have seen >20% investment value tumble in 2023Education: 2023 M&A Deal Roundup and Trends to Watch Out for in 2024
Mixed Chart
LEK
View slide
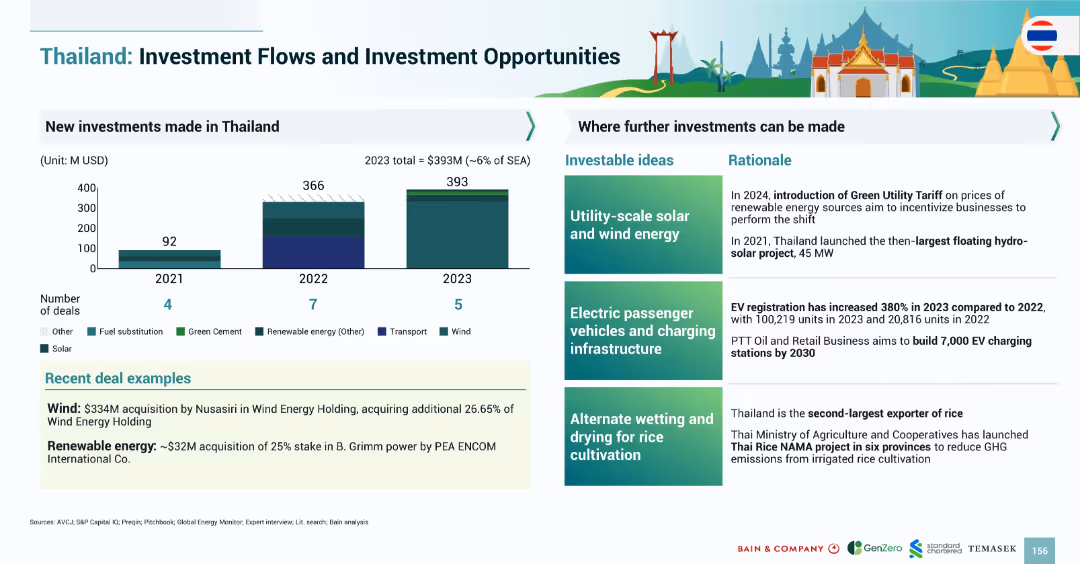
Split layout: bar chart (left) showing new investments (2021–2023), and right section with investment ideas and rationale; colorful, infographic style.
Investment Analysis
Environmental Services & Sustainability
The slide details new investments in Thailand's renewable energy and related sectors from 2021–2023. It identifies key areas for future investment, including solar/wind energy, EV infrastructure, and rice cultivation methods, supported by rationale and recent deals.
Thailand, investment, renewable energy, solar, wind, EV infrastructure, agriculture, floating solar, charging stations
false
Thailand: Investment Flows and Investment OpportunitiesSOUTHEAST ASIA’S GREEN ECONOMY 2024
Mixed Chart
Bain
View slide
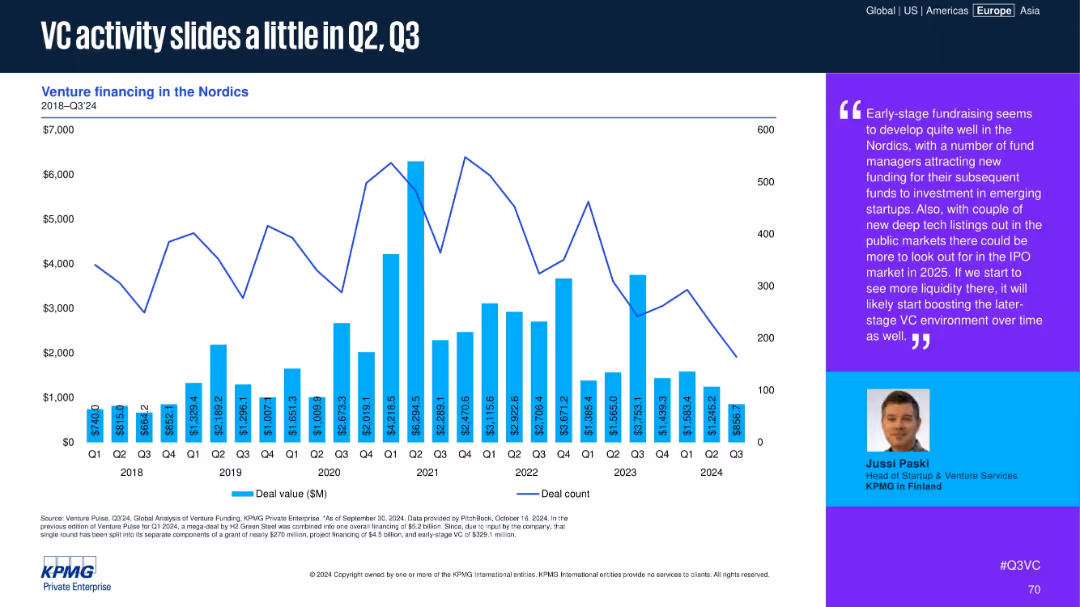
Bar and line chart on left (deal value in bars, deal count in line), large purple quote box on right with speaker image and commentary. Title in bold at top, with a regional focus on the Nordics.
Market Analysis and Trends
Financial Services
Tracks quarterly venture financing trends in the Nordics from 2018 to Q3 2024, showing fluctuations in deal value and count. Commentary highlights promising early-stage activity and potential IPO market developments in 2025.
Venture Capital, Nordics, Deal Count, Deal Value, IPO, Startups, 2024, Q3, Funding
false
VC activity slides a little in Q2, Q3Venture Pulse Q3 2024
Mixed Chart
KPMG
View slide
The slide shows a left section with key strategic priorities and a right section with column chart depicting market share distribution. The design includes blue headers and footers, with the page number at the bottom right.
Competitive Landscape
Financial Services
This slide focuses on the presenter's client-centric approach in global markets, emphasizing strategic priorities and share gains. It includes bar graphs comparing market share over time, useful for presentations on competitive strategy, market analysis, and investment insights in the financial services sector, illustrating how the presenter has strengthened its position in global markets through client-focused strategies and share gains.
Global Markets, Client Focus, Share Gains, Strategy, Competition, Market Analysis
false
Global Markets: Client Centric Approach with Focus on Share GainsGoldman Sachs Presentation to Bernstein Strategic Decisions Conference
Mixed Chart
Goldman Sachs
View slide
Includes small images and infographics highlighting sustainability initiatives and their impacts on health and the environment.
Regulatory and Compliance
Agriculture & Food Production
Reviews the company's leading initiatives in sustainability, focusing on plant-based products and reduction of food waste.
sustainability, plant-based, food waste, environmental impact, health initiatives
false
Industry-leading Boldly Healthier initiatives...Unilever at Deutsche Bank
Header Horizontal
Deutsche Bank
View slide
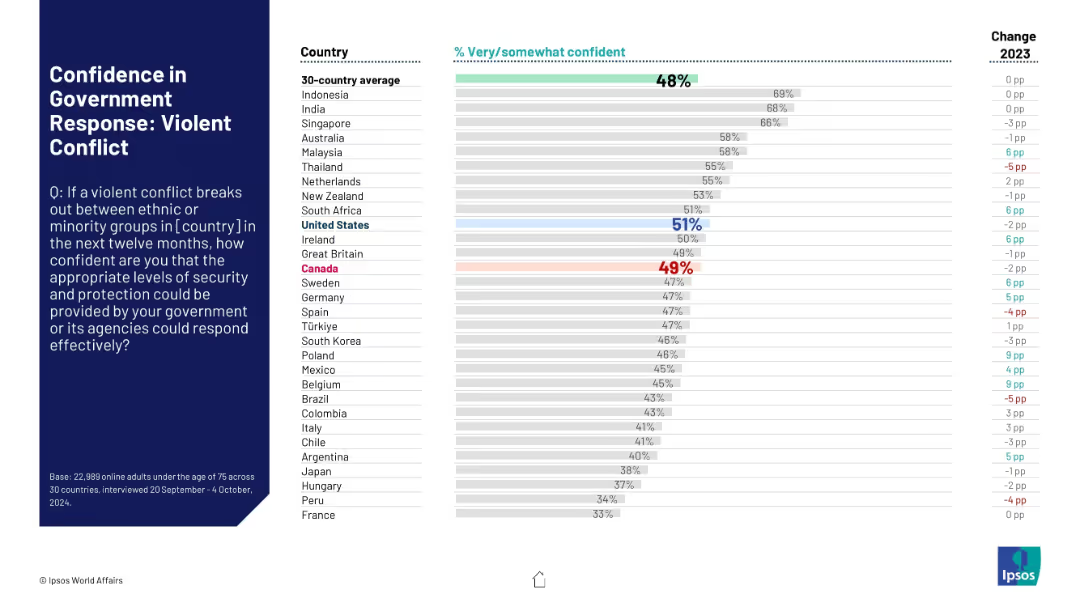
Bar chart on right with percentage values, country names on the left, and change figures on the far right. A large text box on the left presents the survey question. Colors highlight key countries like US and Canada.
Risk Assessment and Management
Government & Public Sector
Presents comparative survey results from 30 countries assessing public confidence in government response to violent ethnic or minority conflict. Highlights Canada and US with average ratings and changes from 2023.
security, conflict, public trust, government response, ethnic violence, international survey, Ipsos, Canada, United States, perception
false
Confidence in Government Response: Violent ConflictWORLD AFFAIRS
Mixed Chart
IPSOS
View slide
A bar chart comparing the absolute weightings of different sectors for the Sustainable Emerging Markets Equity Representative Account against the MSCI EM Index.
Strategic Planning
Financial Services
This slide shows the sector allocation for the Sustainable Emerging Markets Equity Representative Account, comparing it with the MSCI EM Index.
Sector Allocation, Sustainable, Emerging Markets, Equity, Financial, Planning, Investment, Weightings, Comparison, MSCI
false
Sector Allocation Sustainable Emerging Markets Equity Representative AccountMorgan Stanley Investment Management Emerging Markets / Asia
Mixed Chart
Morgan Stanley
View slide
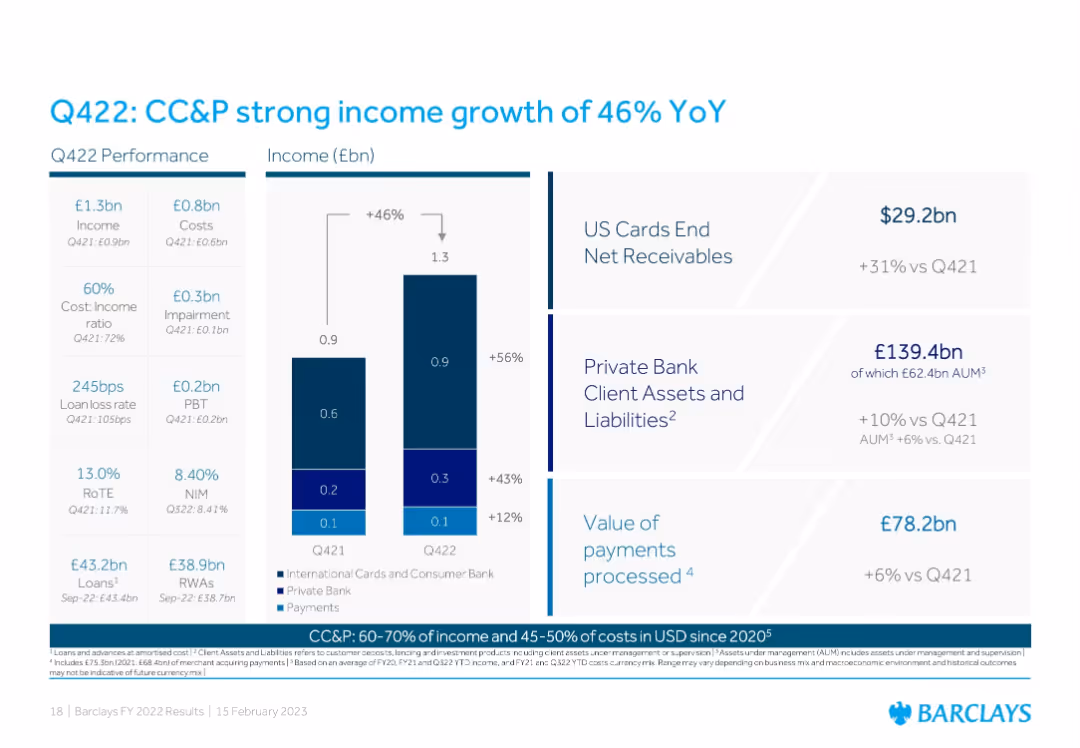
Three-part design: Left has Q422 metrics; center shows YoY income comparison by business area using stacked bars; right provides KPIs like US card receivables, client assets, and payments processed.
Performance Metrics and KPIs
Financial Services
Highlights significant income growth in Consumer, Cards & Payments (CC&P), driven by increased receivables, client assets, and payments. The slide emphasizes cost-income improvements and diversified revenue streams.
CC&P, income growth, payments, private bank, US cards, performance, KPIs, Q422, Barclays
false
Q422: CC&P strong income growth of 46% YoYBarclays PLC FY 2022 Results
Mixed Chart
Barclays
View slide
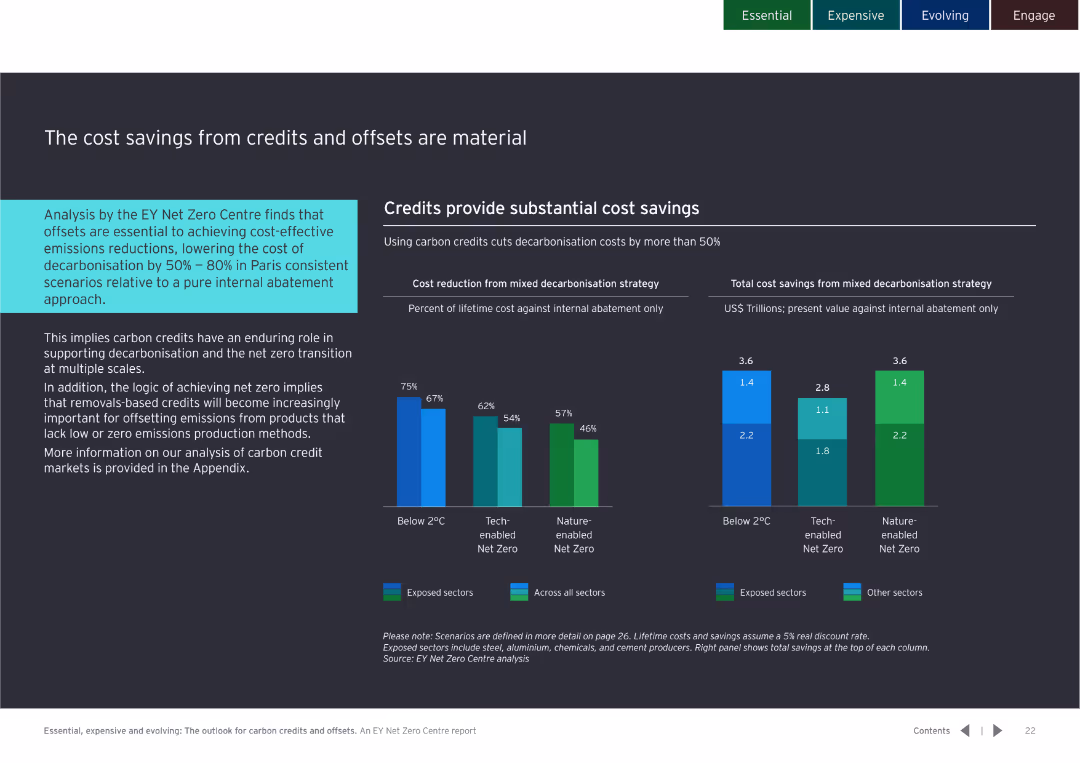
Dark background with bar and column charts showing cost savings and carbon credits; text blocks providing analysis and implications.
Financial Performance
Environmental Services & Sustainability
Highlights the importance of carbon credits in achieving cost-effective emissions reductions. Provides detailed cost-saving scenarios.
carbon credits, cost savings, emissions reduction
false
The cost savings from credits and offsets are materialEssential, expensive and evolving: The outlook for carbon credits and offsets
Multiple Chart
EY
View slide
A bar chart outlines the top macro risk factors for investors, with changes from a previous survey period marked, highlighting interest rates, geopolitical risks, and inflation.
Risk Assessment and Management
Financial Services
Evaluates major macro risk factors considered by investors, with emphasis on how perceptions have shifted over recent periods. Useful for risk management and strategic investment planning.
risks, investors, macro factors, interest rates, inflation
false
Interest rates and Federal Reserve policy remain the number one macro risk factor for investors, followed by geopolitical risks and inflationBCG Investor Perspectives Series Q4 2023
Single Chart
BCG
View slide
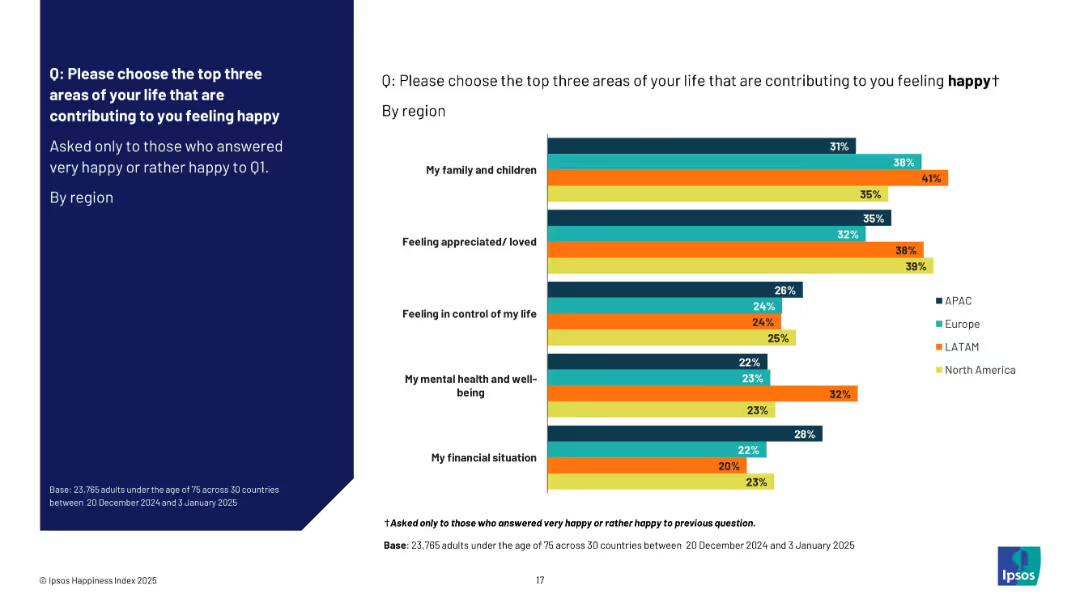
Split layout: left side features the survey question on a solid navy background; right side contains a horizontal bar chart comparing responses across four regions (APAC, Europe, LATAM, North America) with color-coded bars.
Market Analysis and Trends
Professional Services
This slide presents survey data on happiness contributors among people who reported feeling happy, segmented by region. Key contributing factors include family, appreciation, life control, mental health, and finances. The data shows varying emphasis across regions, with family and feeling appreciated ranking high globally.
happiness, well-being, regional comparison, family, appreciation, control, finances, survey data, global regions
false
Please choose the top three areas of your life that are contributing to you feeling happyIPSOS HAPPINESS INDEX 2025
Mixed Chart
IPSOS
View slide
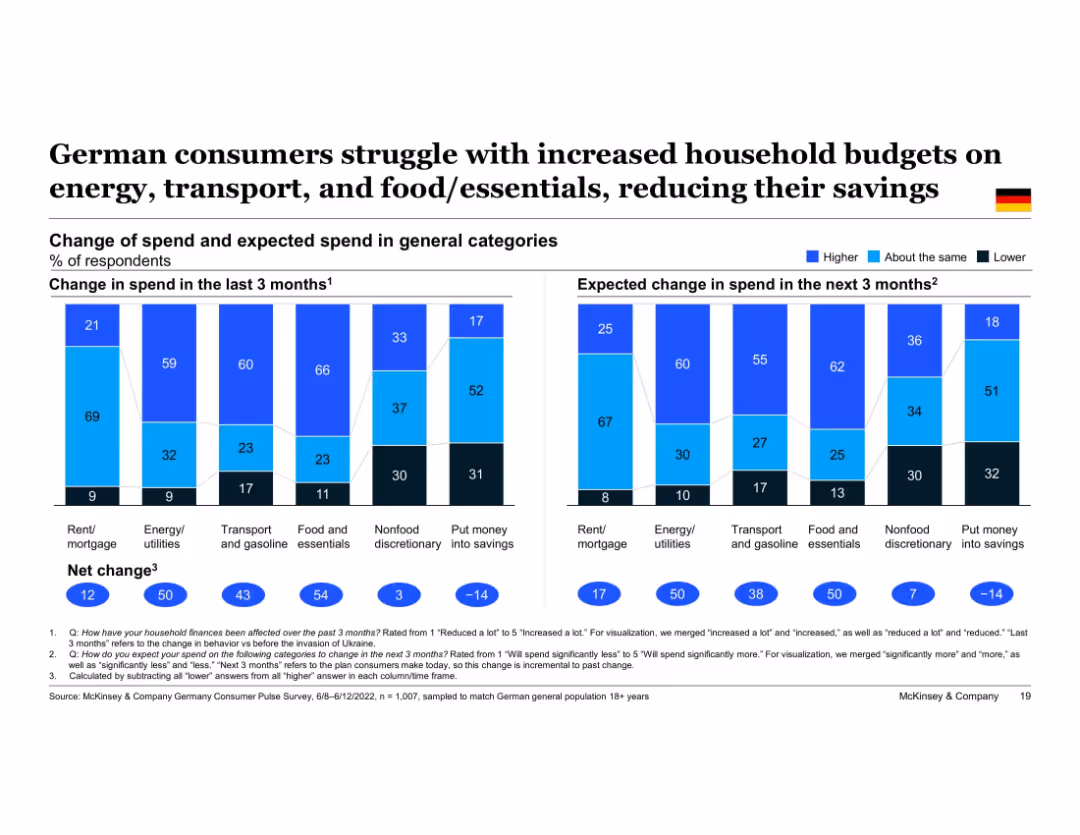
Two horizontal stacked bar charts comparing change in spend (last 3 months) and expected change (next 3 months) across six categories. Visual shows “Higher,” “Same,” and “Lower” spending portions. German flag displayed top-right.
Market Analysis and Trends
Financial Services
German consumers have increased spending across essential categories like food, energy, and transport, often at the expense of savings. Expectations for continued higher spending are evident, suggesting long-term pressure on household budgets amid inflationary trends.
spending habits, Germany, inflation, energy costs, food prices, household budget, savings, consumer behavior
false
German consumers struggle with increased household budgets on energy, transport, and food/essentials, reducing their savingsEuropean Consumer Sentiment Survey: How current events in Europe are shaping consumer behavior
Single Chart
McKinsey
View slide
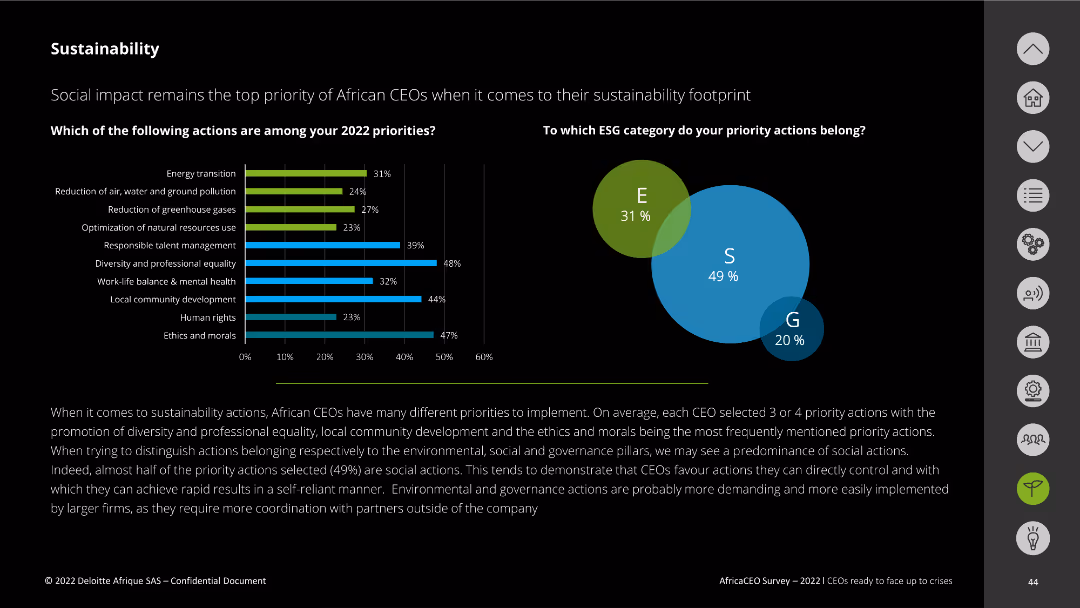
This slide includes vertical bar charts and a Venn diagram. It lists 2022 sustainability priorities and categorizes actions by ESG pillars.
Market Analysis and Trends
Environmental Services & Sustainability
The slide details the top sustainability priorities for African CEOs in 2022 and categorizes these actions into environmental, social, and governance pillars.
sustainability priorities, ESG, African CEOs, social actions, environmental impact
false
Sustainability Social impact remains the top priority of African CEOs when it comes to their sustainability footprintCEOs ready to face up to crises
Multiple Chart
Deloitte
View slide
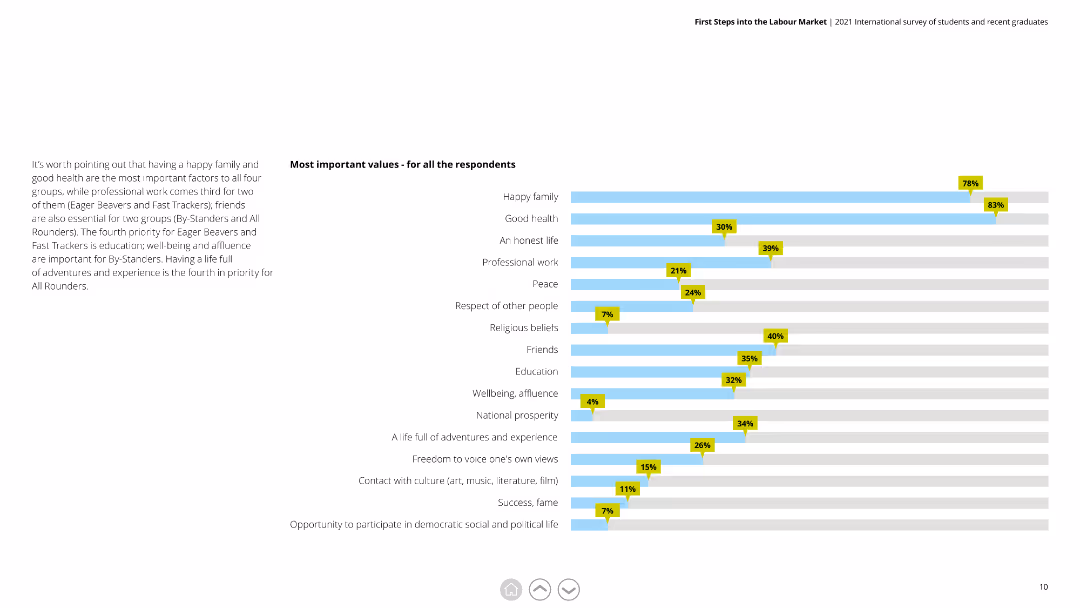
The slide features a horizontal bar chart with multiple categories representing different values. Each bar indicates the importance percentage of the respective value among the respondents. The chart has blue bars with yellow percentage markers.
Market Analysis and Trends
Education & Training
The slide displays the most important values for all respondents, highlighting factors like family, health, and professional work. It helps understand what young graduates prioritize in life, useful for tailoring educational and training programs.
values, bar chart, priorities, respondents, family, health, education, importance, graduates
false
Most important values - for all the respondentsFirst Steps into the Labour Market 2021 International survey of students and recent graduates
Mixed Chart
Deloitte
View slide
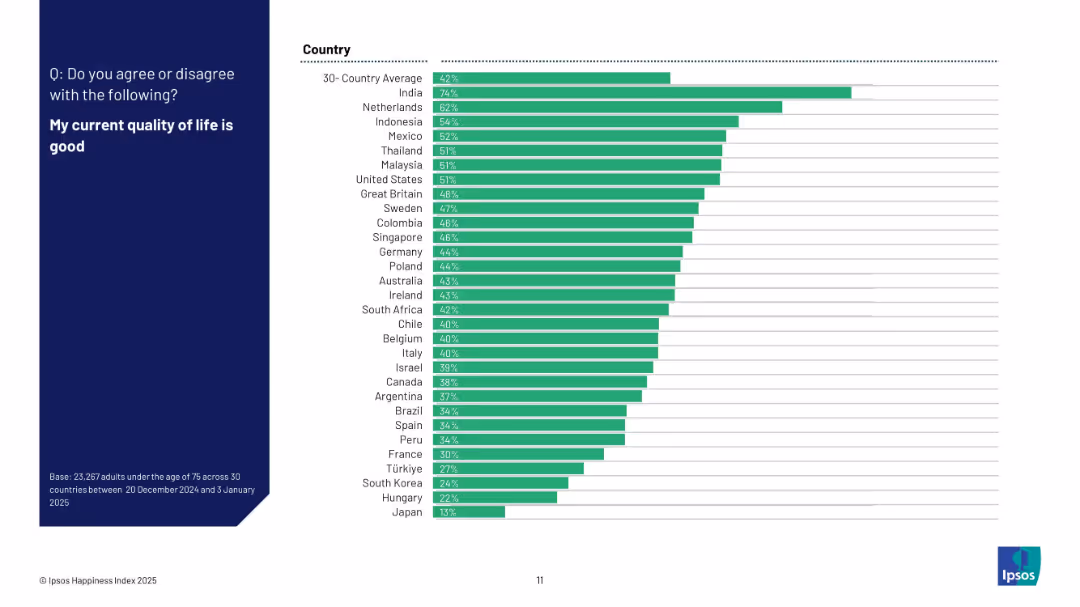
Vertical bar chart showing percentage agreement by country on current quality of life being good; bars arranged in descending order.
Market Analysis and Trends
Professional Services
This slide presents the percentage of respondents in each country who agree that their current quality of life is good. India tops the list, while Japan and Hungary rank lowest. It visually ranks national satisfaction with current living standards using green-colored bars.
quality of life, country ranking, satisfaction, Ipsos, living standards, survey, perception, 2025, chart
false
My current quality of life is goodIPSOS HAPPINESS INDEX 2025
Mixed Chart
IPSOS
View slide
This comparative slide features a bar chart that contrasts active and passive business activities among Indonesian MSMEs.
Operational Efficiency
Financial Services
The slide compares active versus passive business activity levels among MSMEs, suggesting underutilization of potential in the Indonesian market. It could serve to examine strategies to activate MSMEs' full capabilities and encourage more dynamic engagement in business practices.
MSMEs, Business Activities, Market Potential, Engagement Strategy, Indonesia
false
However, Indonesian MSMEs are not their realizing their full potential since most take a passive approach–not actively performing business activities at all.Unlocking the next wave of digital growth: beyond metropolitan Indonesia
Single Chart
Kearney
View slide
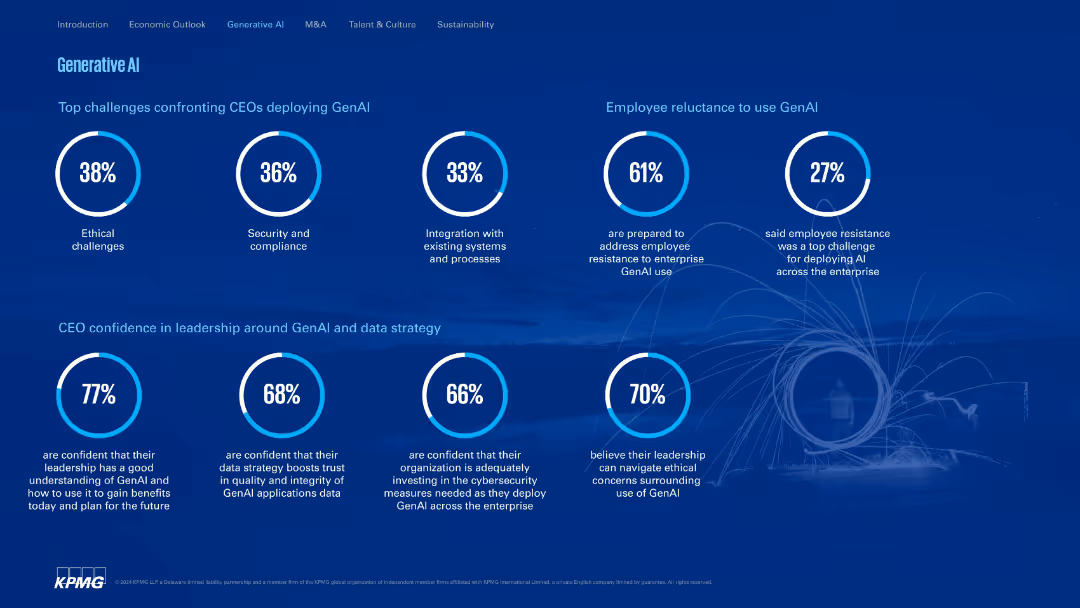
Clean, structured layout with donut charts and circular percentage visuals; dark blue background.
Technology and Digital Transformation
Artificial Intelligence
Addresses CEO concerns around GenAI deployment such as ethics, security, and employee resistance. Highlights leadership confidence in handling GenAI strategy and ethical navigation.
GenAI, ethics, compliance, integration, leadership, resistance, KPMG
false
Generative AI2024 U.S. CEO Outlook Pulse Survey
Single Chart
KPMG
View slide
A column chart compares avoided CO2 emissions and abatement costs versus coal turbines for various grid utilizations (wind, solar, grid wind, grid solar) by 2030.
Market Analysis and Trends
Energy & Utilities
The slide evaluates the CO2 emissions reduction potential and costs of converting coal turbines to P2P systems coupled with renewable energy sources.
CO2 emissions, abatement cost, coal, turbines, P2P, renewable, grid, wind, solar
false
Avoided CO2 and abatement cost vs. coal turbinesHydrogen applications and business models
Multiple Chart
Kearney
View slide
This slide uses vertical bar graphs to compare data from 2022 and 2023 regarding comfort in discussing mental health and support received from employers. The design is straightforward and clean.
Organizational Structure and Change
Professional Services
Focusing on workplace stigma around mental health, the slide reveals statistics on comfort in discussing and disclosing mental health issues, including employer support. It's useful for HR policy planning.
stigma, mental health, workplace, discussion, support, employers, disclosure, comfort, 2022, 2023
false
Fewer women feel comfortable discussing or disclosing their mental health at workWomen @ Work 2023: 1 Amid glimpses of progress, women's mental health is still poor - and stigma remains
Multiple Chart
Deloitte
View slide
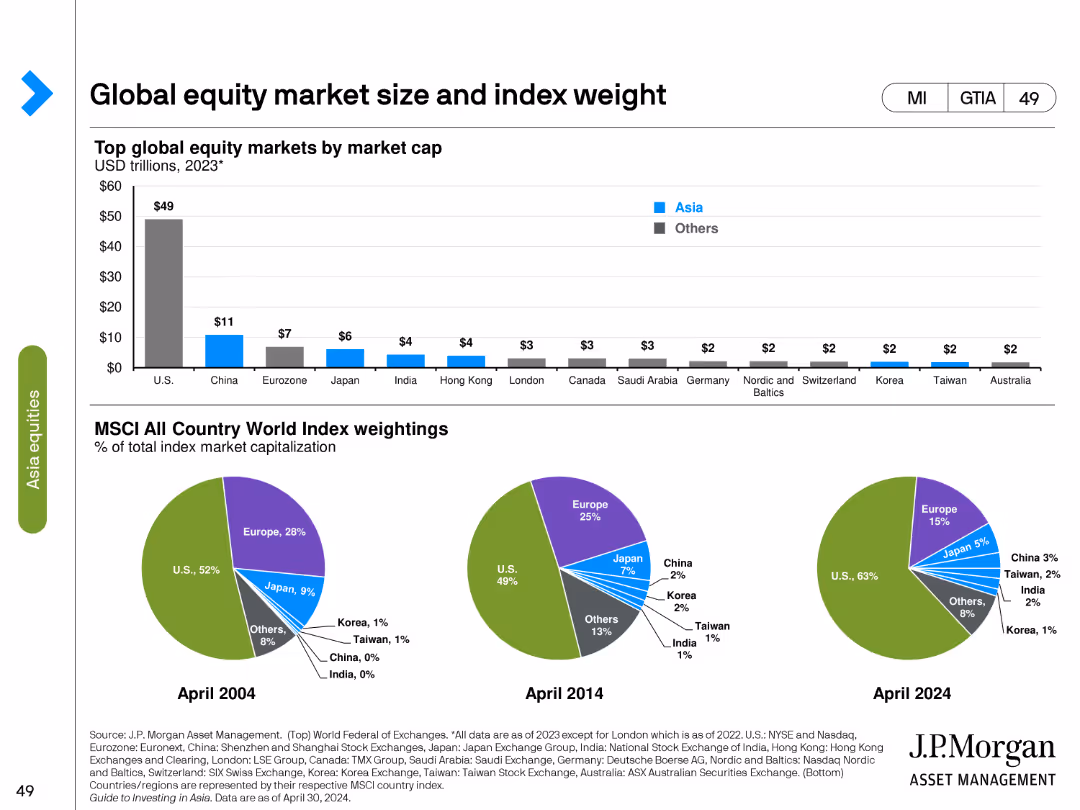
The slide contains a column chart showing the top global equity markets by market cap in 2023 and three pie charts comparing MSCI All Country World Index weightings in different years.
Market Analysis and Trends
Financial Services
Analyzes global equity market sizes by market cap and the weight of different countries in the MSCI All Country World Index from 2004, 2014, and projected for 2024.
equity market, market cap, MSCI, index weight, pie chart, column chart, global markets, financial analysis, historical data, projections
false
Global equity market size and index weightGuide to Investing in Asia
Multiple Chart
JP Morgan
View slide
Table and bar chart comparing staff counts per 10,000 beneficiaries across states. Detailed text explanation. Dense with a focus on data.
Operational Efficiency
Healthcare & Pharmaceuticals
Analysis of NH DHHS staff relative to the number of beneficiaries served, indicating NH is in the middle range compared to other states.
Staffing, Beneficiaries, DHHS, Comparison, Analysis
false
Staffing Review | Benchmarking | Department Wide (2 of 2)NH DHHS Operations Assessment
Mixed Chart
Alvarez & Marsal
View slide
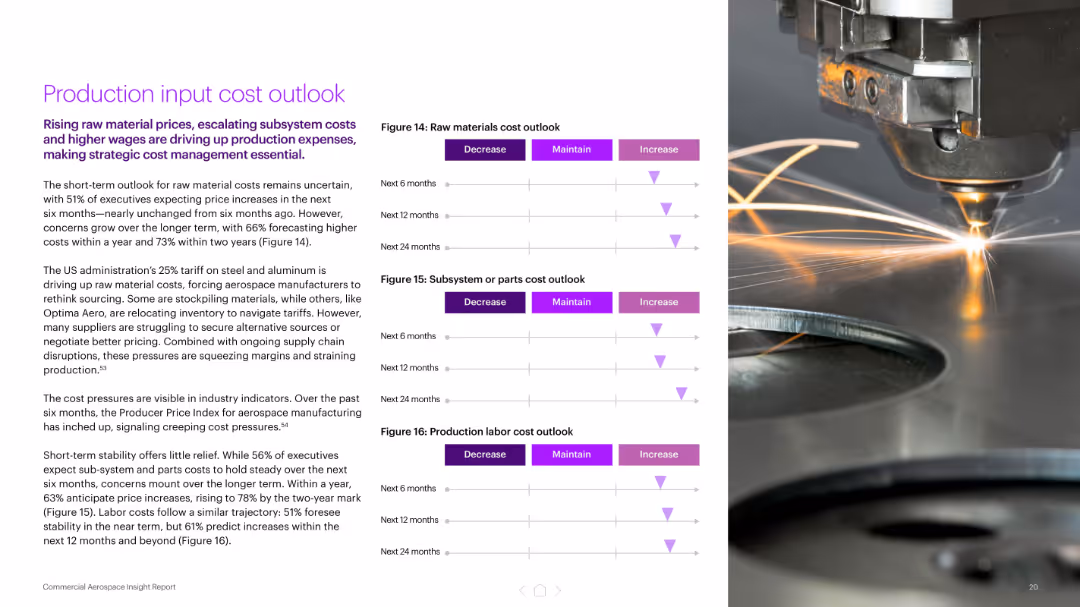
Three forecast triangle graphs on the left (raw materials, subsystems, labor), supported by text; right image shows metal cutting machine with sparks.
Pricing Strategies
Industrial & Manufacturing
Covers escalating costs for raw materials, subsystems, and labor due to tariffs, supply shortages, and inflation. Emphasizes the need for cost management amid rising production expenses.
input cost, raw materials, aerospace pricing, production cost, tariffs, labor costs, subsystems, inflation
false
Production input cost outlookNavigating uncertain skies Commercial Aerospace Insight Report
Mixed Chart
Accenture
View slide
The slide includes a column chart showing the frequency of crypto asset trading among participants. Each column represents different trading frequencies.
Market Analysis and Trends
Financial Services
This slide displays the frequency at which participants traded crypto assets over the past year, ranging from daily to never.
Trading frequency, crypto, assets, participants, analysis
false
Crypto Assets Trade FrequencyCRYPTO ASSET SURVEY
Mixed Chart
IPSOS
View slide
Multiple column charts depicting issuances and redemptions over time, along with upcoming maturities and first calls, including detailed callouts.
Investment Analysis
Financial Services
Analysis of capital market activities, including issuances, redemptions, and future call schedules.
Issuances, redemptions, maturities, bonds, capital markets
false
Capital markets issuances and redemptionsThird quarter 2023 Fixed Income investor presentation
Multiple Chart
UBS
View slide
White background; left text column and right side shows a thermometer-style ranking of countries with heart icons.
Human Resources and Talent Management
Professional Services
This slide introduces the Love Life Satisfaction Index, combining multiple aspects of romantic and relationship satisfaction into a single score. It ranks countries from highest (Colombia) to lowest (Japan), noting regional patterns and country-specific insights like outliers and trends.
relationship index, satisfaction, love, romantic life, country ranking, global survey, emotional well-being, Ipsos
false
Love Life Satisfaction IndexIPSOS LOVE LIFE SATISFACTION 2025
Mixed Chart
IPSOS
View slide
Contains a chart titled "Figure 8", headers, and bullet points with descriptions. The chart and text are set against a white background with a purple footer.
Technology and Digital Transformation
Technology & Software
Examines the shift in emphasis from technical skills to complex reasoning and analysis skills across various job sectors.
STEM, Complex Reasoning, Skills Analysis, Job Market, Educational Trends
false
FIGURE 8: THE CHANGING IMPORTANCE OF STEM/ANALYSIS AND COMPLEX REASONING SKILLSBridging the Skills Gap in the Future Workforce
Table
Accenture
View slide
Map with projected pipeline expansions and a list of potential projects with a timeline. Very detailed and specific.
Strategic Planning
Energy & Utilities
Discusses potential future expansions in pipeline capacity, including strategic increments and market solutions.
pipeline, expansion, strategy, capacity, market
false
Mainline – Potential Future Expansions Low cost, highly executable, staged expansions to match supplyInvestment Community Presentation Barclays Energy Conference
Graphic
Barclays
View slide
Features a bar chart titled 'Change in Average Asking Rent by Submarket Type'. It contrasts urban vs. suburban submarkets across various cities. The bars are color-coded and extend horizontally with percentage labels.
Competitive Landscape
Real Estate & Construction
Illustrates the changes in asking rent prices between urban and suburban areas over a specific period, indicating market demand and investment potential in different locations.
Rent Change, Urban vs. Suburban, Real Estate, Market Demand, Investment Potential, Submarket Comparison, Price Trends, Geographic Analysis
false
High-cost urban submarkets are lagging the rest of the nation in terms of multifamily demand but are on the rise…THE ECONOMY AND ITS IMPACT ON AFFORDABLE HOUSING
Multiple Chart
Citigroup
View slide
Split into "Developed" and "Emerging" sections with bar graphs and horizontal bar charts, using blue and grey color coding.
Market Analysis and Trends
Consumer Goods
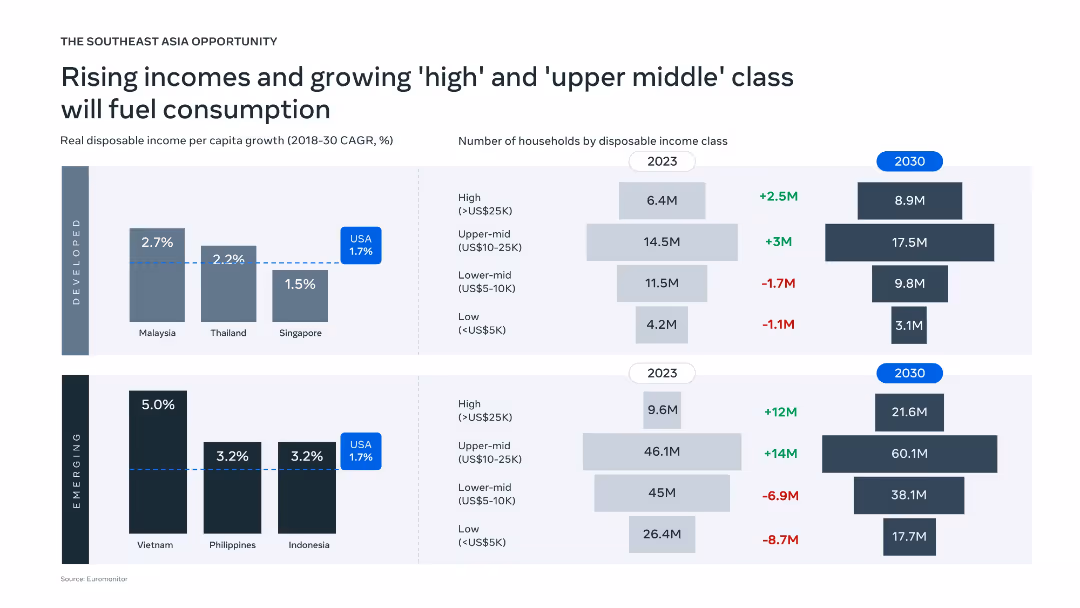
The slide illustrates projected growth in real disposable income per capita in Southeast Asia from 2018–2030 and changes in household income classes between 2023 and 2030. Emerging markets like Vietnam show the highest income growth potential.
income growth, household income, Southeast Asia, consumption, projections, income class, disposable income, developed vs. emerging, CAGR, household segmentation
false
Rising incomes and growing 'high' and 'upper middle' class will fuel consumptionBold moves: Leading Southeast Asia's next wave of consumer growth
Multiple Chart
Bain
View slide
The slide features a bar chart displaying the distribution of responsibility for digital innovation/technology among different roles within organizations. Colors are orange and gray.
Strategic Planning
Financial Services
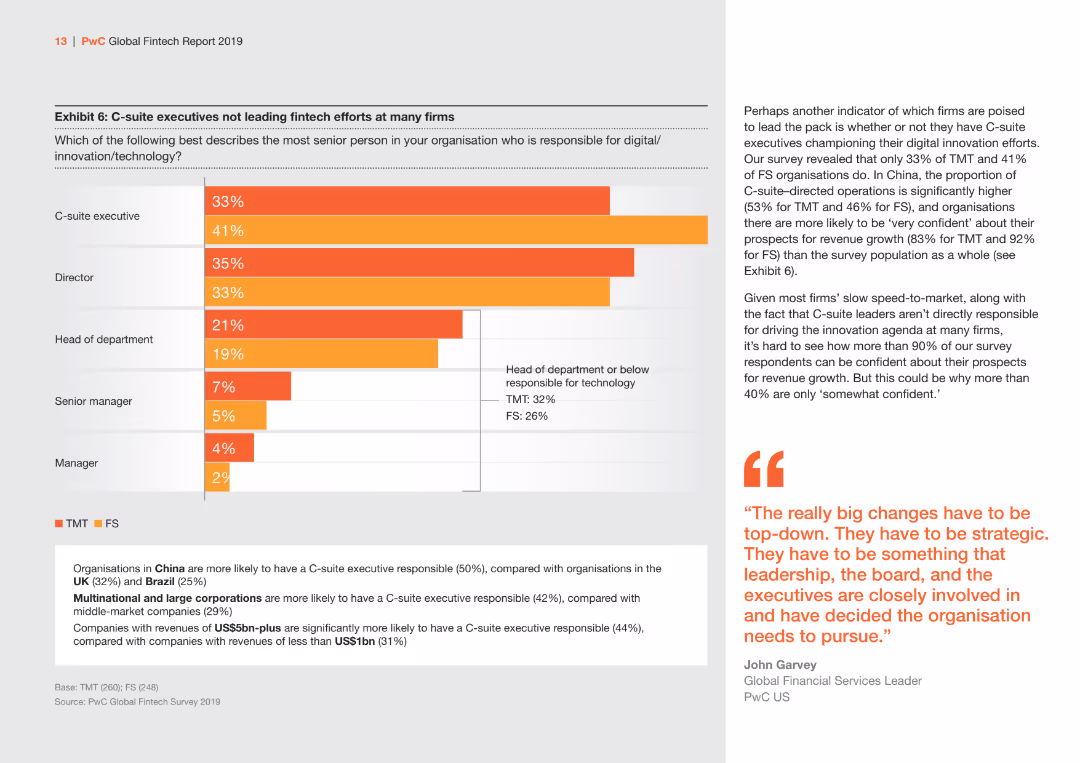
Highlights the distribution of responsibility for digital innovation/technology among C-suite executives, directors, and other roles, comparing TMT and FS sectors.
C-suite, digital innovation, TMT, FS, responsibility
false
Exhibit 6: C-suite executives not leading fintech efforts at many firmsCrossing the lines: How fintech is propelling FS and TMT firms out of their lanes Global Fintech Report 2019
Mixed Chart
PwC/Strategy&
View slide
A slide with a balanced mix of text and graphs, featuring a column chart with color differentiation to display market data. It is well-organized, facilitating a quick grasp of complex market performance data.
Financial Performance
Financial Services
The slide provides an analysis of fixed income markets performance with key highlights and market review. It serves to convey critical market trends and data, likely to inform investment decisions or economic forecasts.
Performance, Review, Markets, Data
false
2023 Ends With A Huge Rally For Fixed Income MarketsCredit Market Monitor
Multiple Chart
Morgan Stanley
View slide
A slide with two multi-colored line graphs tracking option prices as a percentage of the underlying S&P 500 volatility. It provides historical data on 12-month 10% OTM Put Price and 12-month 20% OTM Put Price relative to underlying asset values alongside T-Bill yields. The slide uses an orange, teal, and blue color palette to distinguish between the different datasets, and displays a high level of detail in the graphs.
Investment Analysis
Financial Services
The slide suggests considering a lower-risk hybrid strategy that capitalizes on market volatility and could potentially outperform fixed income. It discusses implied volatility trends related to S&P 500 options pricing and contrasts this with T-Bill yields, highlighting how early cycle market volatility can provide investment opportunities. The use of historical volatility data aims to guide strategic decisions on equity and fixed income investments.
hybrid strategy, equities, fixed income, market volatility, S&P 500, T-Bills, investment strategy, options pricing
false
Prefer a lower risk hybrid strategy for equities and fixed income? Harnessing early cycle market volatility can potentially outperform fixed incomeCiti Global Wealth Investments OUTLOOK 2022
Single Chart
Citigroup
View slide
The slide presents tables and bullet points to illustrate financial data, with contrasting colors for different categories and emphasis on key figures.
Financial Performance
Financial Services
Outlines the financial results of Macquarie Asset Management, detailing various income and expense categories, and highlighting performance fee contributions.
Asset Management, Income, Fees, AUM, Profit
false
Macquarie Asset ManagementMorgan Stanley Virtual Hong Kong Summit
Table
Morgan Stanley
View slide
Split bar chart showing agreement with two statements, labeled by year and change. Includes simple line art icons and bold text headers.
Industry Overview
Government & Public Sector
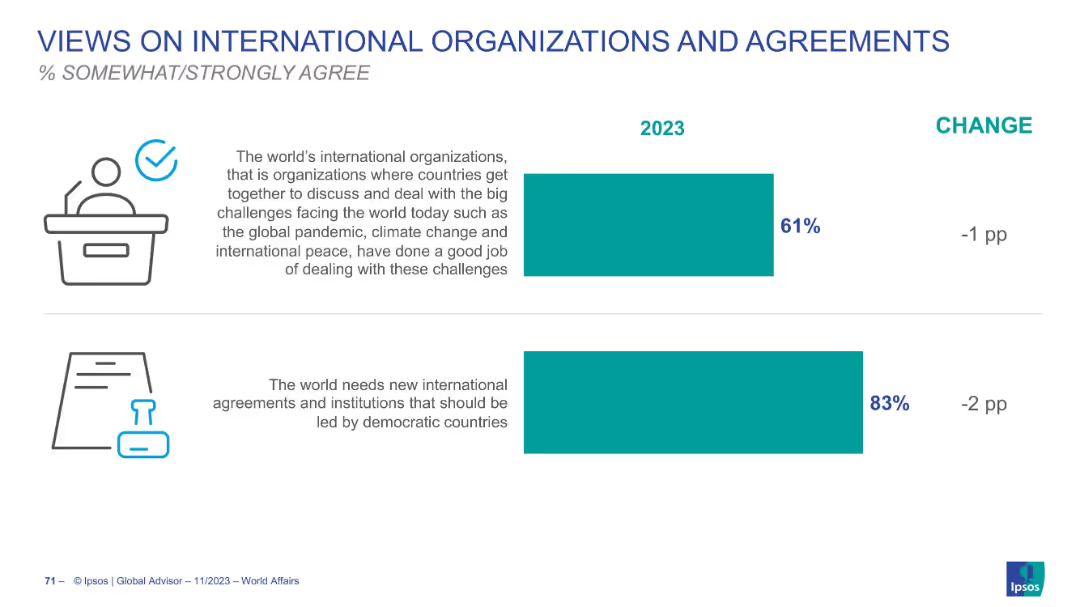
This slide outlines 2023 global agreement levels with two sentiments: satisfaction with current international orgs (61%) and the perceived need for new ones led by democratic nations (83%). Indicates slight decline from previous year.
international organizations, democratic leadership, global policy, Ipsos
false
VIEWS ON INTERNATIONAL ORGANIZATIONS AND AGREEMENTSWORLD AFFAIRS 2023
Single Chart
IPSOS
View slide
The slide uses three sets of column charts, colored green and red, depicting percentages of employee feelings towards burnout, retention, and company recommendation based on their satisfaction with managers. Each set is labeled with multipliers (1.4x, 2.2x, 3.2x) to signify the likelihood of the respective outcome.
Human Resources and Talent Management
Professional Services
This slide examines how manager satisfaction influences employee burnout, likelihood to leave, and willingness to recommend the company. It uses data from a survey of French deskless workers to show significant differences in outcomes between those satisfied and dissatisfied with their managers. Useful for HR professionals to understand managerial impact on employee retention and satisfaction.
burnout, retention, satisfaction, manager, influence, employee, French deskless workers
false
Managers are critical and influence burnout, retention, and hiringMaking WorkWorkBetter for Deskless Workers
Multiple Chart
BCG
View slide
A table with items comparing loyalty program elements like gamification and customer segmentation.
Technology and Digital Transformation
Hospitality & Tourism
Discusses loyalty program stages, emphasizing what differentiates the more successful programs.
loyalty, engagement, gamification, segmentation, rewards
false
Loyalty is a stage wise journey for the companies - what differentiates the leading programs are elements that build aspiration for customersA DATA DRIVEN APPROACH TO IMPROVE CUSTOMER ENGAGEMENT
Multiple Chart
BCG
View slide
The slide features a list of sectors with rank, three bar graphs representing sub-sectors for 2017-19 and 2020-22 averages, and a pie chart indicating a 20% gap in the global IB industry wallet.
Market Analysis and Trends
Financial Services
Demonstrates sector leadership and growth in priority sub-sectors, highlighting opportunities where there are gaps.
Leadership, Growth, Sub-Sectors, Market Share, Wallet, Energy, Fintech, Retail
false
As a leader across sectors, our approach to growth is through investment in priority sub sectorsInverstors Day 2023
Multiple Chart
JP Morgan
View slide
Uses a world map and pie charts to present global sales distribution, product categories, and company resources.
Industry Overview
Consumer Goods
Summarizes the global sales footprint of a consumer goods company, showing regional sales distribution and product diversification.
global, sales, consumer goods, distribution, products, company, diversification, markets
false
Our business is global, balanced and diversifiedDeutsche Bank 2023 Leveraging emerging market opportunities
Multiple Chart
Deutsche Bank
View slide
A pie chart on the incorporation of multiple economics into projection models, with a column chart detailing the approaches used by banks, and accompanying commentary.
Risk Assessment and Management
Financial Services
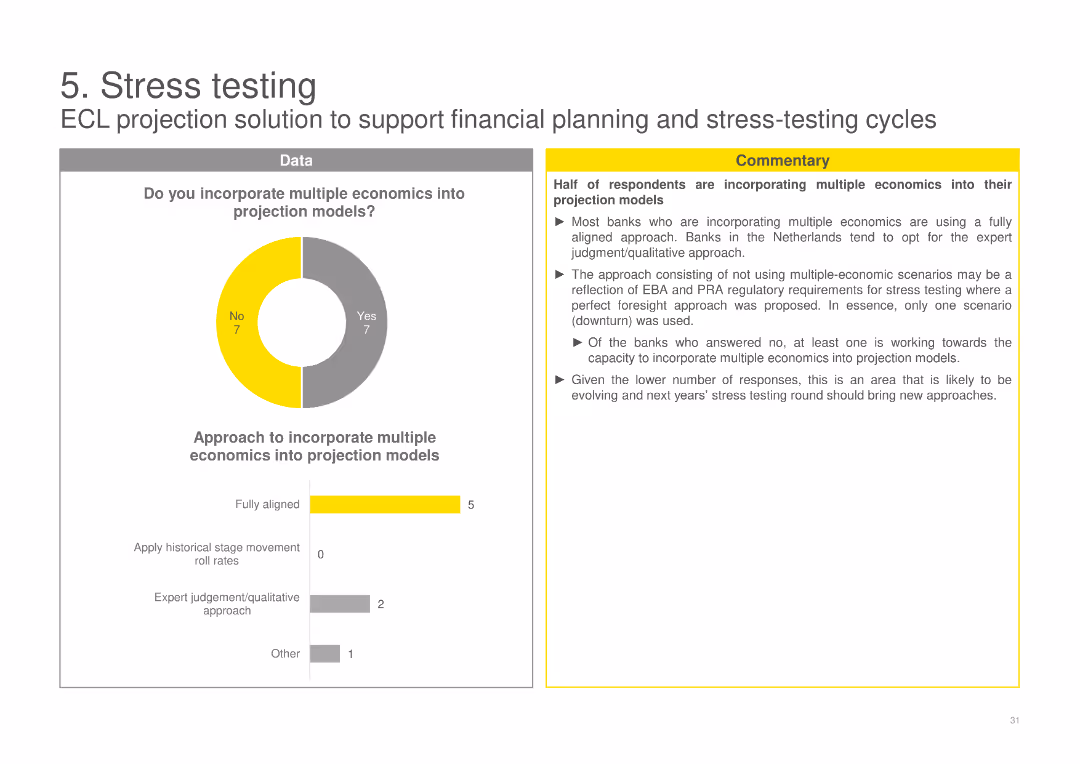
Examines whether banks incorporate multiple economic scenarios into their projection models for stress testing, detailing the different approaches taken.
ECL, stress testing, projection models, multiple economics, banks, scenarios, incorporation, approaches, testing
false
Do you incorporate multiple economics into projection models?EY IFRS 9 Impairment Banking Survey
Multiple Chart
EY
View slide
Line graphs comparing daily traffic index, coal consumption, and property transactions in China before and during COVID-19, marked with key dates.
Strategic Planning
Financial Services
Tracks the early signs of economic recovery in China, analyzing daily activities, energy consumption, and property transactions as of April 2020.
COVID-19, China, economic recovery, traffic, coal consumption, property transactions, analysis, recovery tracking
false
Fight': China gives a first idea on what LEVEL of recovery the economy can achieveFacts, scenarios, and actions for leaders Publication #3 with a focus on Emerging Stronger from the Crisis
Multiple Chart
BCG
View slide
The slide includes a circular diagram illustrating various aspects of sustainability outcomes. Text boxes on the right explain Gartner's focus on sustainability.
Strategic Planning
Professional Services
It discusses Gartner’s commitment to sustainability, covering strategies, leadership, and initiatives to support sustainable development goals.
Sustainability, leadership, strategy, innovation, growth, Gartner, initiatives
false
We consistently seek ways to contribute to the positive impact our work and clients’ work has on the worldGartner Introduction
Diagram
Gartner
View slide
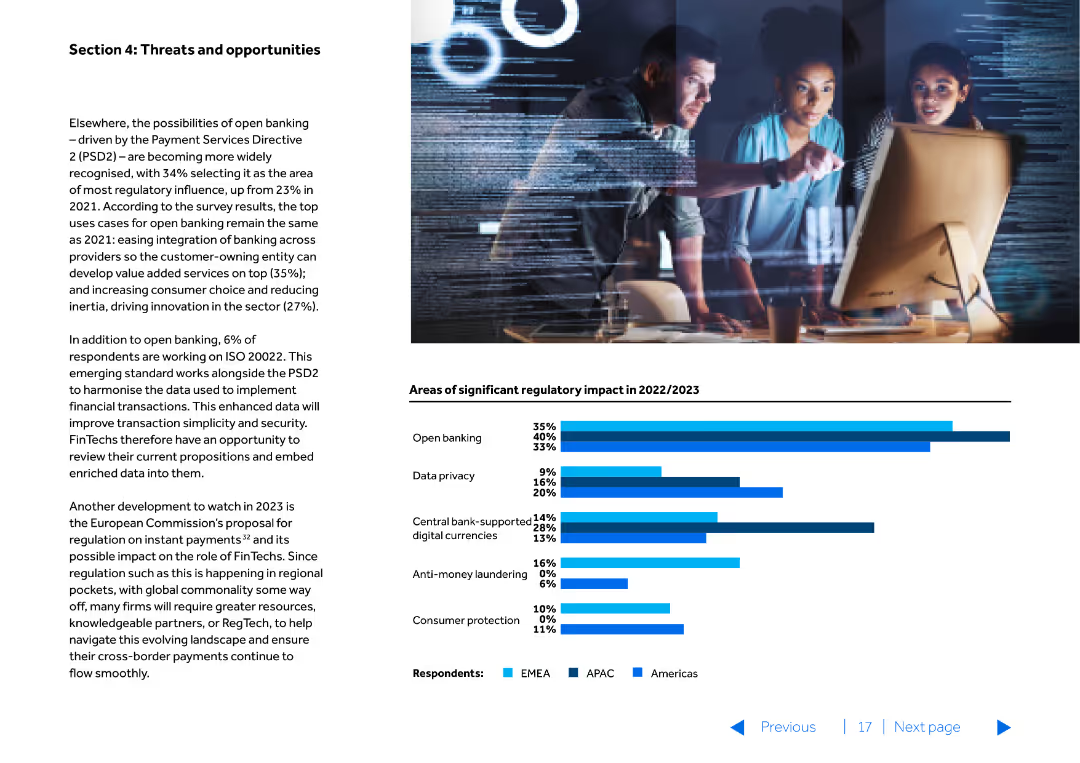
The slide has a combination of text and a bar chart at the bottom. It outlines regulatory impacts and opportunities within the financial sector, particularly focusing on open banking and data privacy.
Risk Assessment and Management
Financial Services
Identifies regulatory impacts and opportunities in the financial sector, emphasizing areas like open banking, data privacy, and central bank digital currencies.
open banking, regulatory impact, data privacy, CBDCs, opportunities
false
Section 4: Threats and opportunitiesMercury rising
Mixed Chart
Barclays
View slide
The slide uses a dark background with a yellow text box for the quote. Below, there is a question and four circular charts with percentages reflecting future expectations.
Market Analysis and Trends
Healthcare & Pharmaceuticals
The slide provides insights into Australian consumers' beliefs about the future of technology in healthcare, including AI, virtual presence, and digital monitoring.
Future of healthcare, technology, AI, virtual presence, Australia
false
‘I see a big future for technology in health care over the next decade.’Health care consumer views on value
Mixed Chart
EY
View slide
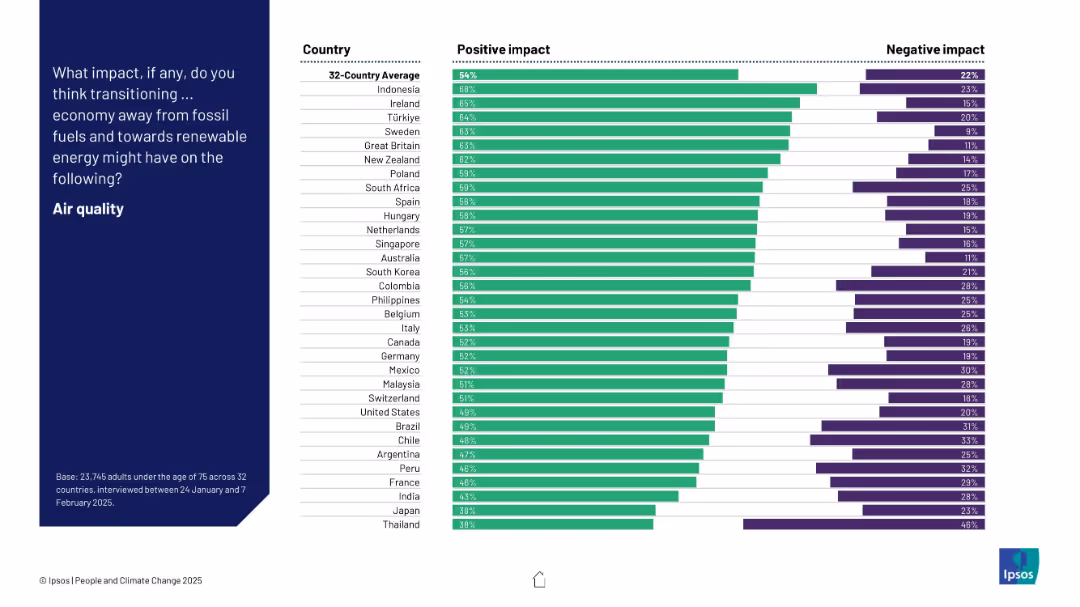
Bar chart showing positive and negative perceptions by country about the impact of energy transition on air quality. Countries are ranked by % positive.
Technology and Digital Transformation
Environmental Services & Sustainability
The slide highlights how people in different countries perceive the impact of moving to renewable energy on air quality. Indonesia, Ireland, and Türkiye show the highest optimism, while Japan and Thailand exhibit the least.
air quality, renewable energy, perception, environmental impact, survey, country comparison, bar chart
false
What impact, if any... Air qualityPEOPLE AND CLIMATE CHANGE
Mixed Chart
IPSOS
View slide
The slide includes a bar chart with detailed annotations. It contrasts current spending with projected spending in a net-zero transition scenario, using blue tones to differentiate data segments.
Investment Analysis
Environmental Services & Sustainability
Analyzes the financial aspects of a net-zero transition, focusing on the increase in annual spending required on physical assets for energy and land-use systems. Emphasizes the scale of new and reallocated investments.
Net-Zero, Spending, Investments, Energy Systems, Land-Use, Transition Scenario
false
2 SignificantThe net-zero transition
Single Chart
McKinsey
View slide
The slide uses a two-column layout to differentiate function-specific from industry use cases. Each case is bulleted and matched with relevant icons.
Technology and Digital Transformation
Transportation & Logistics
Lists use cases for advanced mobility technologies across industries, providing examples of how these technologies can be applied in real-world scenarios.
autonomous trucks, vehicle-to-grid systems, AI mapping, mobility-as-a-service, insurance
false
What are some use cases for the technologies that drive this trend?McKinsey Technology Trends Outlook 2022 Future of mobility
Header Vertical
McKinsey
View slide
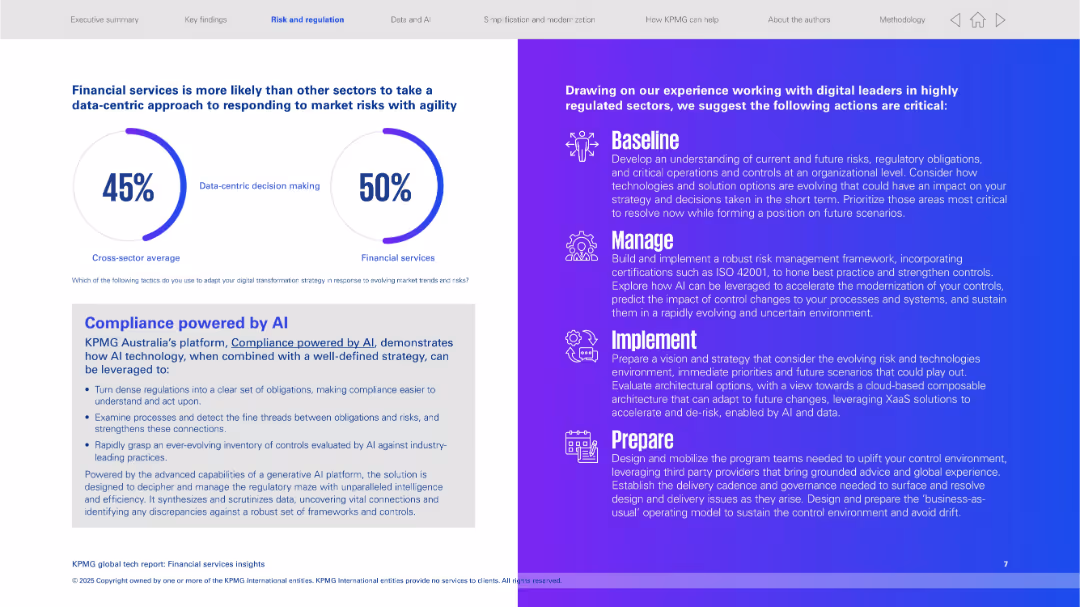
Split layout: left side uses pie-style progress indicators and a text box; right side uses a gradient purple background with white icons and bold headings for 4 steps (Baseline, Manage, Implement, Prepare).
Risk Assessment and Management
Financial Services
The slide highlights the financial services sector's tendency toward data-centric risk responses. It introduces KPMG Australia's AI compliance platform and outlines key strategies for regulated sectors to manage digital transformation, with a strong focus on AI-driven regulatory response and risk framework evolution.
AI compliance, risk management, data-centric, KPMG, regulated sectors, baseline, manage, implement, prepare
false
Financial services is more likely than other sectors to take a data-centric approach to responding to market risks with agilityKPMG global tech report: Financial services insights
Mixed Chart
KPMG
View slide
A column chart showing invested assets from 2022 to 2028 with annotations on strategy and growth ambitions.
Strategic Planning
Financial Services
It details the goal to exceed 5 trillion in invested assets by 2028, highlighting strategic initiatives and expected growth.
invested assets, growth, strategic planning, GWM, ambitions
false
GWM – Ambition to surpass 5trn of invested assets over next five yearsFourth quarter 2023 Fixed Income investor presentation
Mixed Chart
UBS
View slide
Horizontal timeline showing four key phases of Morgan Stanley's evolution from 2009 with corresponding milestones and strategies.
Strategic Planning
Financial Services
Chronicles Morgan Stanley's evolution through four strategic phases, from building scale to deepening client relationships.
Evolution, Morgan Stanley, strategic phases, building scale, technology, channel expansion, client relationships
false
Four Key Phases To Our EvolutionDeepening Client Relationships
Linear Flow
Goldman Sachs
View slide
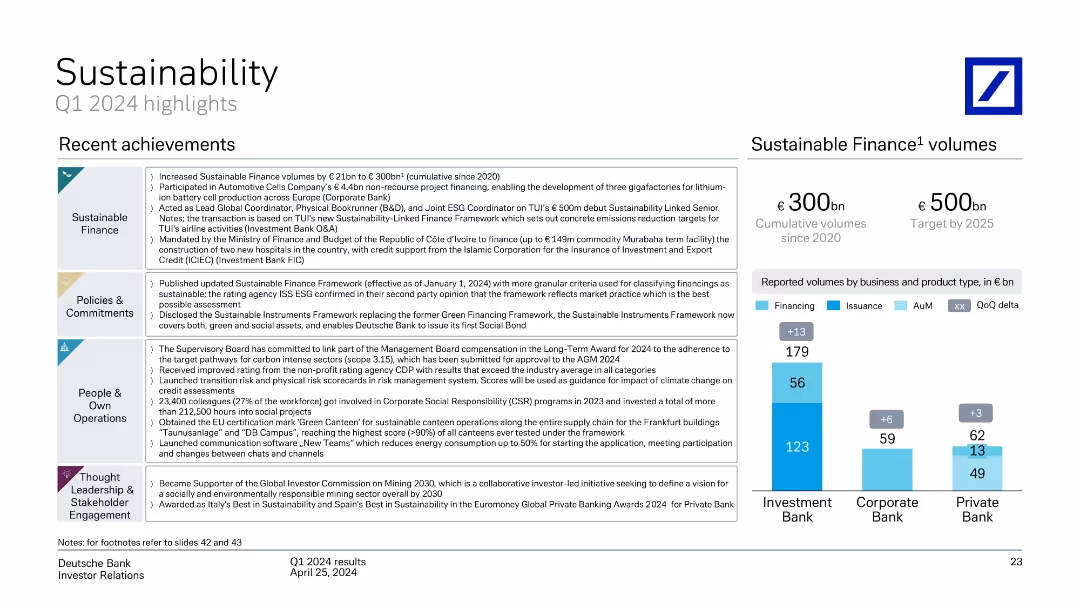
Multi-section slide: achievements grouped under themes; bar chart of sustainable finance volumes
Regulatory and Compliance
Financial Services
Provides highlights of Deutsche Bank’s Q1 2024 sustainability progress, including updated frameworks, ESG commitments, and €300bn in cumulative sustainable finance volumes. Initiatives span finance, governance, and social responsibility.
ESG, sustainable finance, policies, green loans, AuM, CDP, ISS ESG
false
Sustainability – Q1 2024 highlightsQ1 2024 results
Mixed Chart
Deutsche Bank
View slide
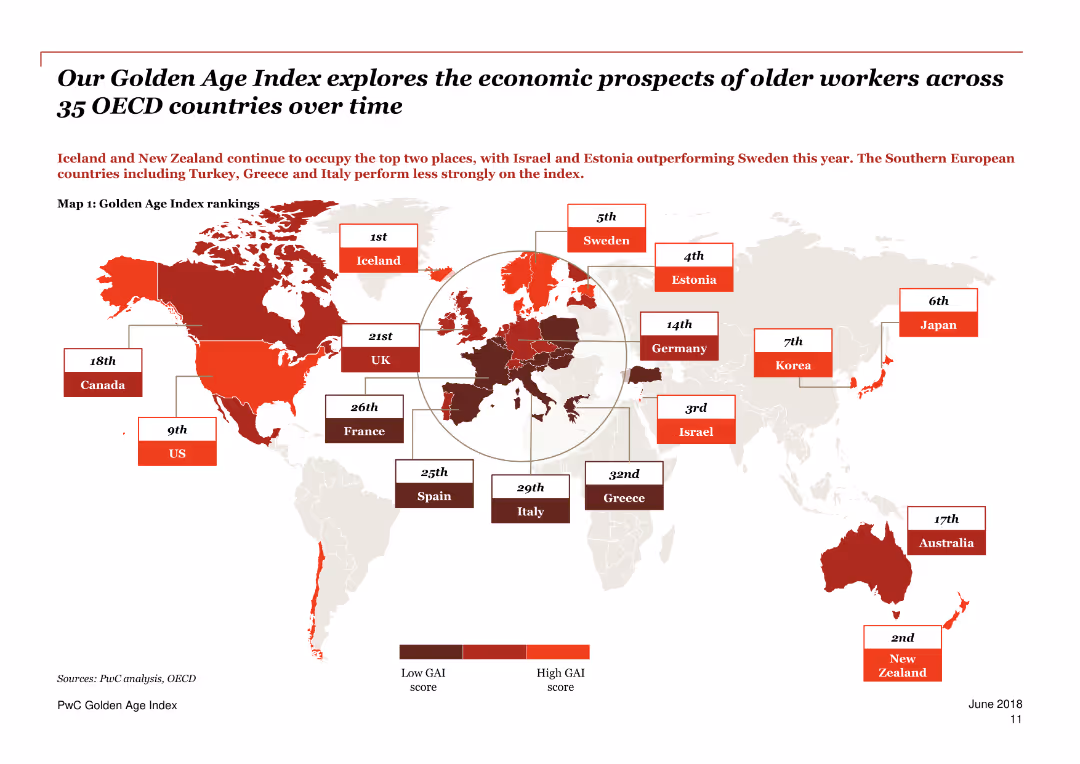
A world map highlighting countries in various shades of red indicating their Golden Age Index rankings.
Market Analysis and Trends
Government & Public Sector
The slide explores the economic prospects of older workers across 35 OECD countries over time, with Iceland and New Zealand leading the rankings.
Golden Age Index, older workers, OECD, economic prospects, rankings, countries, map, trends, employment, analysis
false
Our Golden Age Index explores the economic prospects of older workers across 35 OECD countries over timePwC Golden Age index Unlocking a potential $3.5 trillion prize from longer working lives
Graphic
PwC/Strategy&
1
...
Next
Load More
Hold On!
We are searching in our database
If nothing, comes up, please try different filters!
Create a FREE account to continue browsing
Receive Instant Access to 1,000+ slides from companies like McKinsey, Google, and Goldman Sachs
First Name
Last Name
Email
Password
I agree to all
Terms & Privacy Policy
Thank you! Your submission has been received!
Oops! Something went wrong while submitting the form.
Have an account?
Sign in
Column Chart
Heatmap
Chevron
Org Chart
Infographic
Callouts
Timeline
List
Graphic
Picture
Process Flow
Diagram
Paragraph
Map
Table
Framework
Subtitle
Takeaway Box
Icon
Other Chart
Radar Chart
Waterfall Chart
Mekko Chart
Pie Chart
Scatter Plot
Line Chart
Bar chart
Bullet points