My Account
My Slides
Search by Category
Templates
View All Templates
Download Template Slides
Leave Feedback
Login
Logout
Get Started
Browse all Slides
Browse all Slides
Create a FREE Account
Instant access to 1,000+ real slides from top companies like McKinsey, BCG, Goldman Sachs, Google and many more!
First Name
Last Name
Email
Password
I agree to all
Terms & Privacy Policy
Thank you! Your submission has been received!
Oops! Something went wrong while submitting the form.
Have an account?
Sign in
Instant access to the internet's best slides
Get access to 40+ advanced filters and more
Advanced Search and Filters
Access to
10,000+ slides
Access to Category Pages
Save/Bookmark Slides
PowerPoint Template Library (New)
Choose your plan
MONTHLY
$12/month
Billed every month, cancel anytime.
YEARLY
$9/month
Billed $108 annually, cancel anytime.
Checkout for $12/month
Checkout for $108/yr
Secured by Stripe | AES-256 bit encryption
Spark Your Next Big Idea with New Presentation Templates
VIEW ALL Templates
Welcome,
Welcome
Upgrade to SlideStart
Pro
Instant access to 15,000+ slides
Show Featured Only
Checkbox 8
Companies
Mckinsey
Bain
BCG
EY
Deloitte
Accenture
PwC/Strategy&
JP Morgan
Goldman Sachs
Morgan Stanley
Citigroup
Deutsche Bank
Barclays
LEK
Kearney
Oliver Wyman
Booz Allen Hamilton
Gartner
IPSOS
Nielsen
Slide type
Header Horizontal
Framework
Vertical Flow
Single Chart
Single Chart
Text Only
Mixed Chart
Header Vertical
Graphic
Pillar
Multiple Chart
Agenda
Title
Table
Linear Flow
Upgrade to SlideStart
Pro
Instant access to 40+ advanced filters
Industry
Upgrade to SlideStart
Pro
Instant access to 40+ advanced filters
Technology
Healthcare
Financial Services
Consumer Goods
Energy & Utilities
Manufacturing
Retail
E-commerce
Logistics
Telecommunications
Real Estate
Professional Services
Education
Media
Entertainment
Hospitatlity
Tourism
Agriculture
Food Production
Government & Public Sector
Environmental
Sustainability
Use Case
Upgrade to SlideStart
Pro
Instant access to 40+ advanced filters
Sales and Business Development
Mergers and Acquisitions
Corporate Finance and Valuation
Performance Metrics and KPIs
Client Case Studies
Competitive Landscape
Product and Service Analysis
Customer and Market Segmentation
Organizational Structure
Human Resources and Talent Management
Industry Overview
Regulatory and Compliance
Risk Assessment and Management
Agriculture & Food Production
Hospitality and Tourism
Government
Environmental
Sustainability
Clear all
Thank you! Your submission has been received!
Oops! Something went wrong while submitting the form.
Show Featured Only
Checkbox 8
Companies
Mckinsey
Bain
BCG
EY
Deloitte
Accenture
PwC/Strategy&
JP Morgan
Goldman Sachs
Morgan Stanley
Citigroup
Deutsche Bank
Barclays
LEK
Kearney
Oliver Wyman
Booz Allen Hamilton
Gartner
IPSOS
Nielsen
Slide type
Text Only
Linear Flow
Vertical Flow
Single Chart
Header Horizontal
Mixed Chart
Header Vertical
Pillar
Multiple Chart
Graphic
Agenda
Title
Table
Framework
Industry
Technology
Healthcare
Financial Services
Consumer Goods
Energy & Utilities
Manufacturing
Retail
E-commerce
Logistics
Telecommunications
Real Estate
Professional Services
Education
Media
Entertainment
Hospitatlity
Tourism
Agriculture
Food Production
Government & Public Sector
Environmental
Sustainability
Use Case
Sales and Business Development
Mergers and Acquisitions
Corporate Finance and Valuation
Performance Metrics and KPIs
Client Case Studies
Competitive Landscape
Product and Service Analysis
Customer and Market Segmentation
Organizational Structure
Human Resources and Talent Management
Industry Overview
Regulatory and Compliance
Risk Assessment and Management
Agriculture & Food Production
Hospitality and Tourism
Government
Environmental
Sustainability
Clear all
Thank you! Your submission has been received!
Oops! Something went wrong while submitting the form.
Tag
View slide
The slide shows a benchmarking set of AEP scores across various categories with bar charts indicating leader and other averages.
Performance Metrics and KPIs
Professional Services
It benchmarks AEP scores for team excellence, organizational alignment, buy/pay channels, performance management, and more, indicating quartile rankings.
AEP scores, benchmarking, team excellence, performance management, digital technology, organizational alignment
false
How do we identify Procurement Leaders in our research?Excellence in Procurement
Multiple Chart
Kearney
View slide
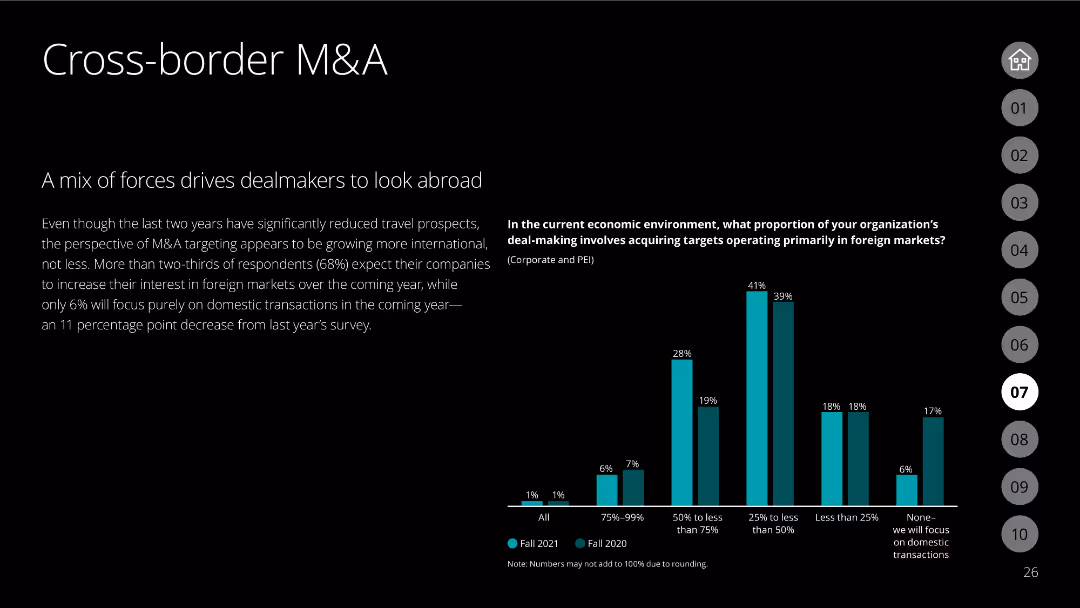
The slide features a black background with white text discussing the trend of cross-border M&A. A column chart compares the proportion of organizations focusing on foreign markets in 2020 and 2021.
Mergers and Acquisitions
Financial Services
Analyzes the shift in focus towards international markets for M&A activities, driven by survey data comparing the focus on foreign markets over two consecutive years.
cross-border M&A, international markets, foreign focus, survey comparison
false
A mix of forces drives dealmakers to look abroadThe future of M&A 2022 M&A Trends Survey
Mixed Chart
Deloitte
View slide
Column charts and annotations depict the profitability trends of luxury brands from 2009 to projected 2025, focusing on EBIT percentages.
Financial Performance
Retail & E-commerce
Evaluates changes in the profitability of luxury brands over time, with projections up to 2025, considering the impact of digital disruptions.
profitability trends, luxury brands, financial analysis, digital impact, future projections
false
DIGITAL DISRUPTION SHIFTING PROFILE AND NATURE OF EXPENDITURE ITEMS; PROFITABILITY LIKELY TO STABILIZE IN THE COMING YEARSALTAGAMMA 2018 WORLDWIDE LUXURY MARKET MONITOR
Mixed Chart
Bain
View slide
Flowchart showing the evolution of analytics maturity from data modeling to machine learning, natural language processing, and AI. Includes annotations on data input and human intervention.
Technology and Digital Transformation
Technology & Software
Explains the stages of analytics maturity, from structured data modeling to advanced AI, and their impact on companies' operations and value creation.
analytics maturity, AI, data modeling, machine learning, NLP
false
AI is revolutionising how companies manage their customers, operations and value-creation.Retail Banking Evolution in the Age of AI
Linear Flow
Kearney
View slide
This slide combines bullet points and icons to highlight agricultural priorities and new EU strategies. The layout is straightforward, using icons and brief descriptions to clearly communicate key strategies.
Strategic Planning
Agriculture & Food Production
Focuses on strategic changes in agriculture for sustainability, including the Biodiversity Strategy and the Farm to Fork Strategy under the European Green Deal, aiming for a sustainable competitive food system.
EU strategies, agriculture, biodiversity, sustainability, food system
false
Reorient agricultural and fishery prioritiesThe Future of Food Challenges & opportunities
Header Vertical
Deloitte
View slide
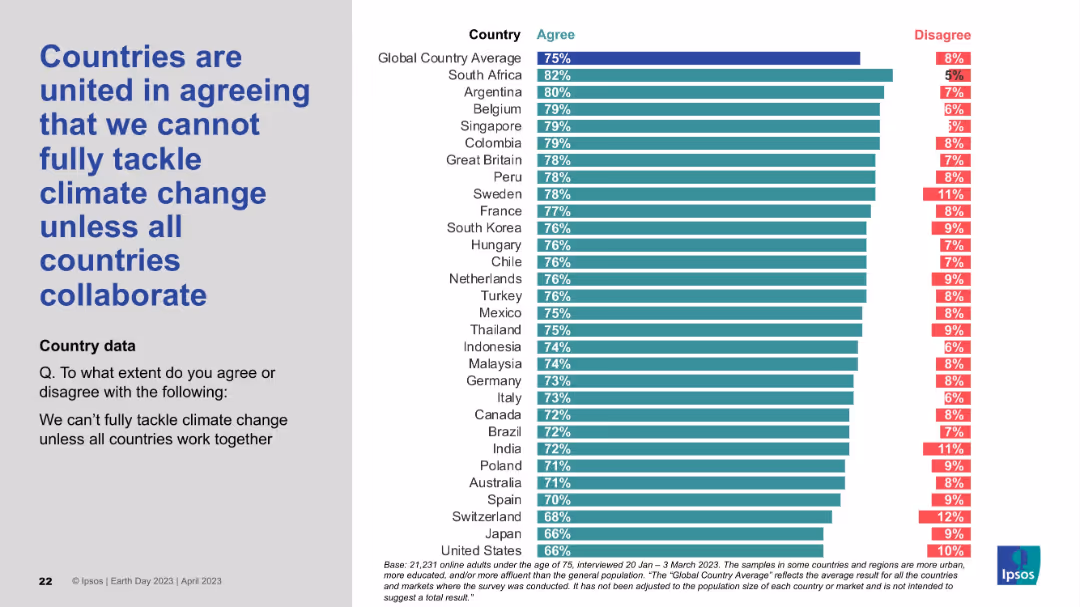
Layout consistent with others: statement on the left, bar chart showing agreement and disagreement levels by country on the right.
Strategic Planning
Environmental Services & Sustainability
The slide conveys a strong global belief that climate change cannot be addressed unilaterally and that international collaboration is essential. The agreement levels are high across most countries, reinforcing the shared view that climate action must be a global effort.
global cooperation, climate policy, collaboration, international unity, environmental challenge, Earth Day survey, Ipsos
false
Countries are united in agreeing that we cannot fully tackle...EARTH DAY 2023
Mixed Chart
IPSOS
View slide
Contains bar graphs showing the levelized cost of energy for solar, onshore and offshore wind, and nuclear power with and without tax credits, illustrating significant cost reductions due to fiscal incentives.
Market Analysis and Trends
Energy & Utilities
Examines how full application of tax credits could reduce the costs associated with generating energy from various renewable sources, emphasizing the financial benefits of government incentives.
renewable energy, cost reduction, tax credits, solar, wind, nuclear
true
Carbon-free energy | Full tax credits can significantly reduce costs of generating renewable energyUS Inflation Reduction Act: Climate & Energy Featuresand Potential Implications
Single Chart
BCG
View slide
A stacked column chart compare the market share of different generations in the true luxury goods market from 2019 to projections for 2026.
Market Analysis and Trends
Consumer Goods
Analyzes the impact of Millennials and Gen Z on the luxury goods market, highlighting their growing market share and influence. Useful for understanding demographic shifts in consumer behavior within the luxury sector.
luxury, market, Millennials, Gen Z, trends
false
The Next Gen Is HereA Pulse Check of the Luxury Consumer
Multiple Chart
BCG
View slide
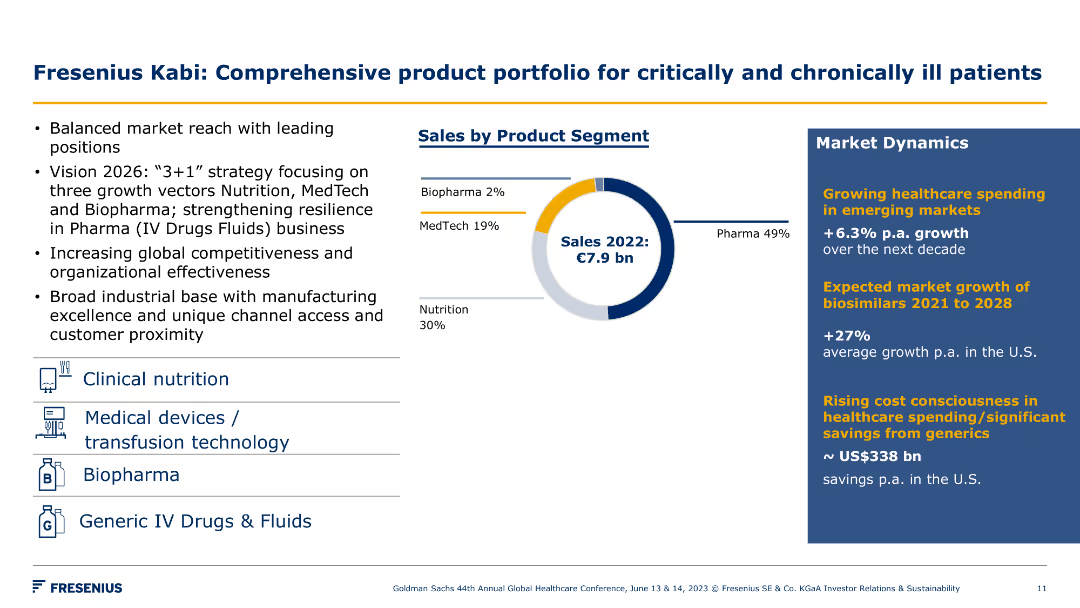
A pie chart of sales by product segment and bullet points detailing market dynamics. Visual elements include icons for each product category.
Product and Service Analysis
Healthcare & Pharmaceuticals
The slide highlights Fresenius Kabi's diverse product portfolio and market dynamics, focusing on sales distribution and strategic growth areas for critical and chronic care.
product portfolio, sales, market dynamics, critical care, chronic care, Fresenius Kabi, strategy, growth, healthcare, segments
false
Fresenius Kabi: Comprehensive product portfolio for critically and chronically ill patientsGoldman Sachs 44th Annual Global Healthcare Conference
Mixed Chart
Goldman Sachs
View slide
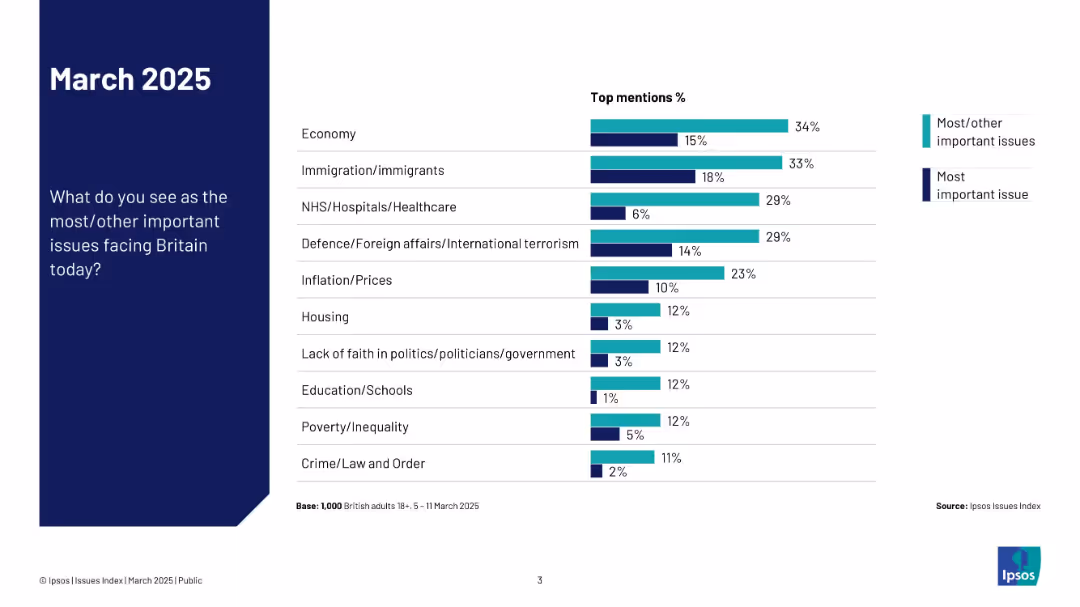
Left-aligned title and question text on a navy-blue background; right side contains a horizontal bar chart comparing "Most important issue" vs "Most/other".
Market Analysis and Trends
Government & Public Sector
This slide presents survey results on what British adults see as the most or other important issues facing the UK in March 2025. The economy, immigration, and healthcare top the list.
Ipsos, public opinion, UK, March 2025, economy, immigration, healthcare, issues, survey, bar chart
false
March 2025Ipsos Issues Index March 2025
Mixed Chart
IPSOS
View slide
Map and text slide providing an overview of A.T. Kearney’s global presence, client base, and team structure.
Industry Overview
Professional Services
Provides an overview of A.T. Kearney's global scale in consulting across various industries, functions, and geographies, with significant client and team details.
consulting, global, industries, clients, team
false
A.T. Kearney is a globally recognized consulting firm offering scale in industries, functions, and geographiesThe Future of Procurement: Why is Technology Lagging Behind?
Graphic
Kearney
View slide
This slide features texts and percentages comparing aspects like development opportunities, compensation, and workplace conditions between Ukraine and Global statistics. There are illustrations of diverse individuals on the left side.
Human Resources and Talent Management
Professional Services
This slide presents data on how employees' influence varies by region in aspects such as development opportunities, compensation, and workplace conditions. It contrasts these aspects between Ukraine and globally, highlighting regional differences and focusing on employee empowerment strategies.
Employee, Influence, Global, Ukraine, Data
false
Building relations with employees by balancing their interests with organization’sDeloitte 2023 Global Human Capital Trends: New fundamentals for a boundaryless world
Table
Deloitte
View slide
Displays a dual-axis column chart tracking client numbers and a bar chart reflecting a finance portfolio. The slide uses contrasting colors to distinguish different segments and time periods. Annotations and titles are neatly organized for legibility.
Market Analysis and Trends
Financial Services
This slide depicts the growth in client base for Commodities and Global Markets and details the Specialised and Asset Finance portfolio, useful for trend analysis and customer base evaluation in financial services.
client growth, commodities, finance, portfolio, trend analysis, financial services, asset finance, market analysis
false
Commodities and Global Markets Growing client baseGoldman Sachs 16thAnnual Australia and New Zealand Investment Forum
Multiple Chart
Goldman Sachs
View slide
Features multiple pie charts displaying the percentage use of AI in different operational areas.
Operational Efficiency
Technology & Software
Outlines the use of AI in daily operations across various industries, focusing on customer experience and operations, and highlights the sectors and processes where AI has the most significant impact.
AI, operations, customer experience, day-to-day, industries
false
Consumer The consumer industry includes a vast array of business types, ranging from consumer products to hotels, restaurants and airlines.Fueling the AI transformation: Four key actions powering widespread value from AI, right now.
Multiple Chart
Deloitte
View slide
A timeline chart tracking market trends from 1985 to 2025, using graphical representations of pyramids to depict segments like "Aspirational" and "Accessible".
Market Analysis and Trends
Consumer Goods
Analyzes the diminishing relevance of traditional market segmentation in the luxury goods industry over time, highlighting major shifts and consumer growth metrics.
Market Trends, Luxury, Segments
false
TRADITIONAL MARKET SEGMENTATION IS LOSING RELEVANCEALTAGAMMA 2017 WORLDWIDE LUXURY MARKET MONITOR
Single Chart
Bain
View slide
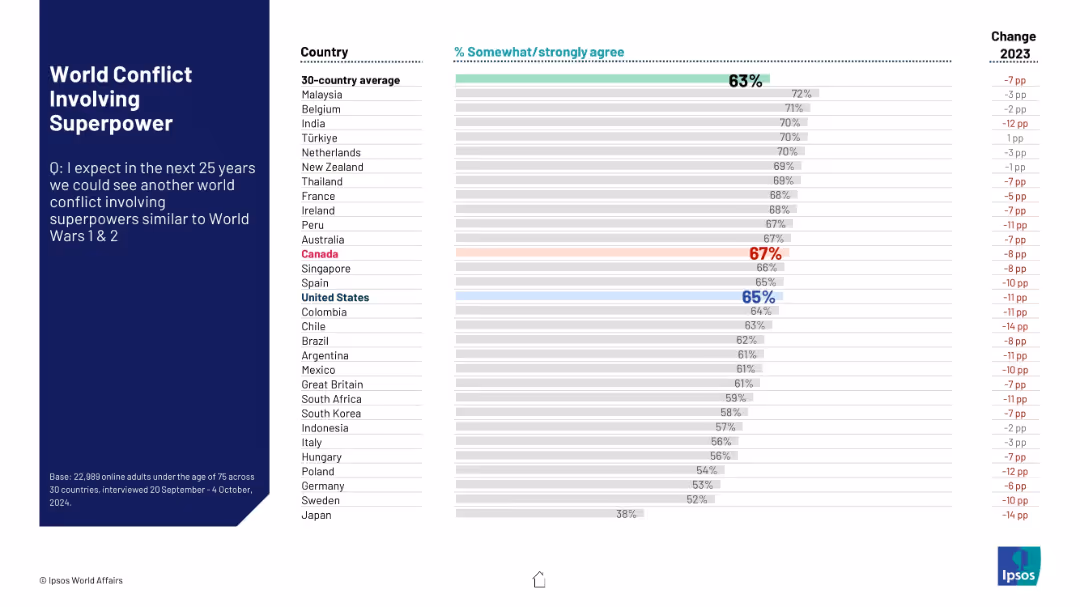
Blue sidebar with question, right-aligned stacked horizontal bars ranking agreement across countries. Includes percent change from 2023.
Risk Assessment and Management
Government & Public Sector
This slide explores global perceptions of the likelihood of a future world conflict involving major superpowers, akin to the World Wars. Results show a high level of concern, with year-over-year decline in agreement.
conflict risk, superpowers, global conflict, public opinion, Ipsos, geopolitical risk, war forecast, international sentiment, World War
false
World Conflict Involving SuperpowerWORLD AFFAIRS
Mixed Chart
IPSOS
View slide
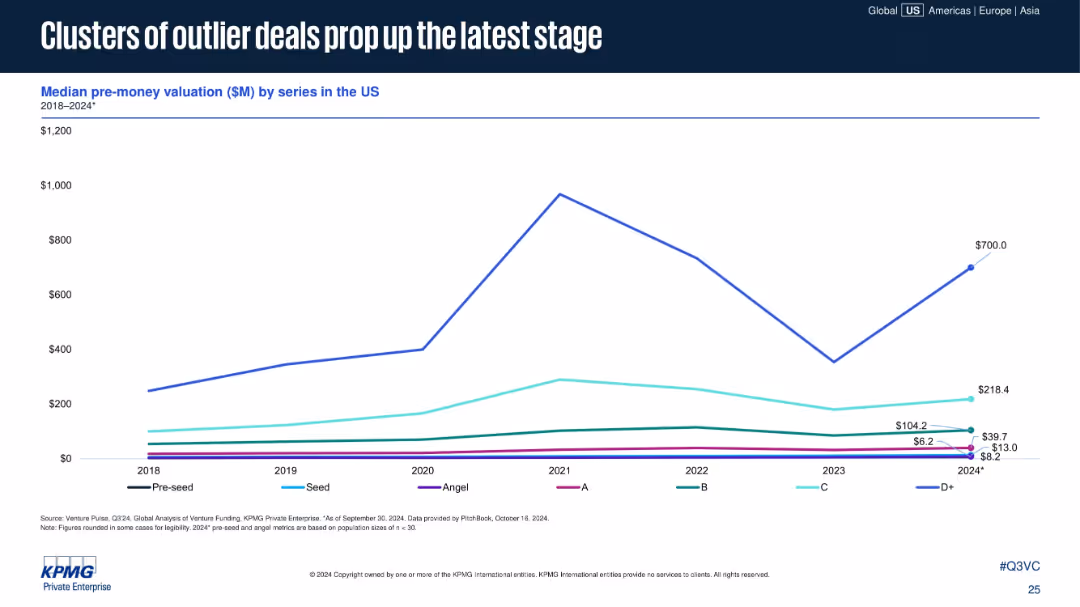
Single line chart showing median pre-money valuation by series from 2018–2024*. Uses a clean grid with legends for each series (Pre-seed to D+).
Investment Analysis
Financial Services
The chart reveals that while most early-stage valuations remain flat or slowly rise, D+ stage valuations have spiked in 2024, driven by outlier deals. This reflects increased valuation concentration at later funding stages.
pre-money valuation, D+ stage, venture funding, outlier deals, late-stage investment, valuation trends, 2024 VC
false
Clusters of outlier deals prop up the latest stageVenture Pulse Q3 2024
Single Chart
KPMG
View slide
Vertical bar charts with CAGR callouts; text commentary on sector-level trends
Market Analysis and Trends
Environmental Services & Sustainability
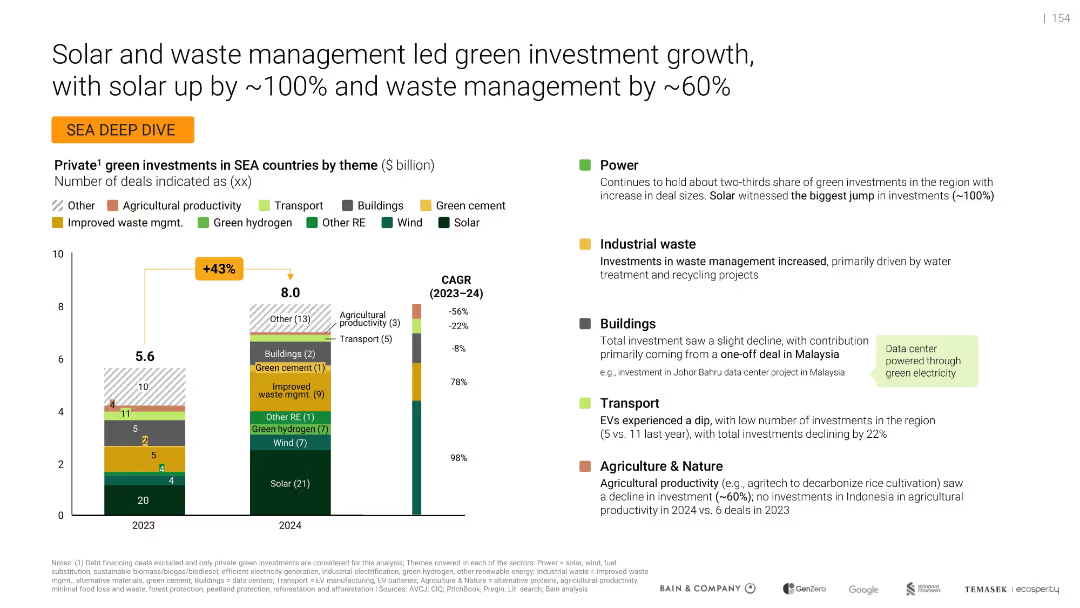
Analyzes green investment trends in SEA from 2023–2024. Solar investments nearly doubled while waste management rose 60%. Transport investments declined. Key investment themes include renewables and industrial waste, with commentary on sector performance and country-specific highlights.
SEA, green investment, solar, waste management, CAGR, transport, industrial waste, renewables, buildings
false
Solar and waste management led green investment growth, with solar up by ~100% and waste management by ~60%Southeast Asia's Green Economy
Mixed Chart
Bain
View slide
Features bullet points, bold headers, and a large pie chart illustrating market growth by 2030. Graphical elements are well-spaced and the slide is easy to read.
Market Analysis and Trends
Transportation & Logistics
Explores the growth potential in sustainable mobility due to regulatory changes and market electrification, stressing on the expected market evolution and Faurecia's strategic positioning to leverage these opportunities.
sustainability, mobility, market growth, electrification, regulations, 2030
false
Sustainable mobility offers Faurecia a world of opportunitiesDeutsche Bank Global Auto Industry Conference
Boxed
Deutsche Bank
View slide
The slide shows bar charts comparing concerns of different generations about technology impacting their jobs and the adequacy of training provided by employers.
Market Analysis and Trends
Professional Services
Examines generational differences in perceptions of technology's impact on job security and training adequacy. It serves to inform HR strategies to address specific concerns and training needs across different age groups, promoting a more inclusive approach to technology adoption in the workplace.
generational impact, technology training, job security, HR strategies, workforce development
false
3. Moves to prepare for the future of work 5. Prepare for and deploy technology with humans in mind continuedBoardroom Agenda
Multiple Chart
PwC/Strategy&
View slide
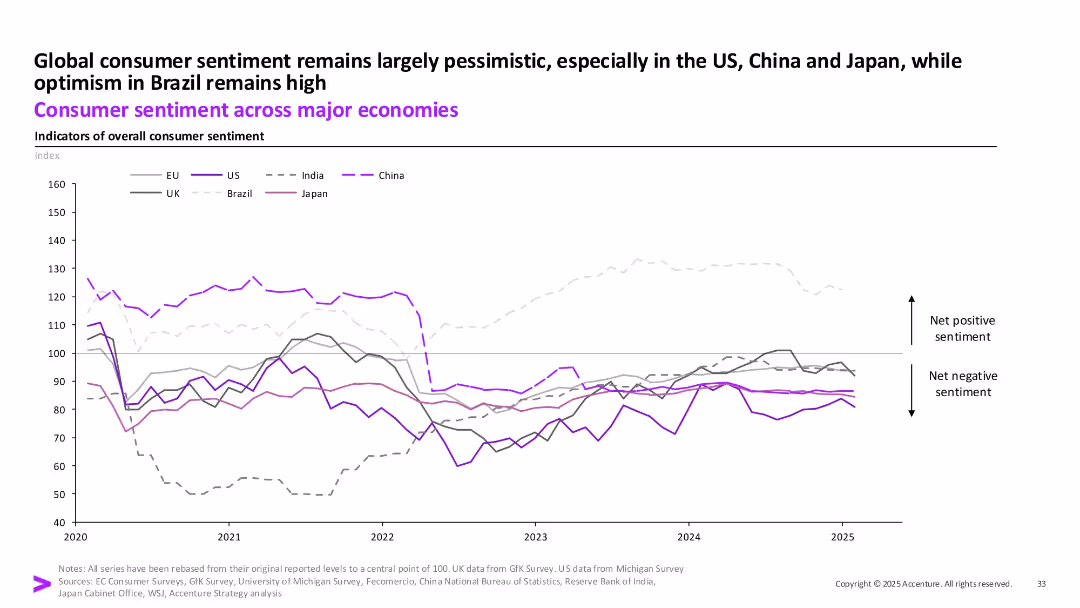
Line chart showing sentiment index trends from 2020 to 2025 across regions (EU, US, India, China, UK, Brazil, Japan).
Strategic Planning
Financial Services
The chart reflects long-term consumer sentiment trends. While Brazil remains optimistic, most other economies like the US, China, and Japan are entrenched in negative sentiment zones, showing low consumer confidence.
Consumer Sentiment, Brazil, Pessimism, Global Outlook, Index, Confidence, 2025
false
Global consumer sentiment remains largely pessimistic, especially in the US, China and Japan, while optimism in Brazil remains highFebruary Macro Brief
Single Chart
Accenture
View slide
A column chart comparing the use of various crypto trading platforms in 2023 and 2022, with an additional column chart for 2023 platforms usage not listed in 2022.
Market Analysis and Trends
Financial Services
This slide presents the usage rates of different crypto trading platforms in 2023 compared to 2022, highlighting significant changes and trends in user preferences.
Crypto, trading, platforms, 2023, 2022, comparison
false
Crypto Trading Platforms Used The most common crypto trading platforms used remained consistent compared to 2022.CRYPTO ASSET SURVEY 2023
Multiple Chart
IPSOS
View slide
This slide features a line chart displaying equity, interest rate, and foreign exchange volatility, and a scatter plot showing hedge fund returns versus short-term US T-bill yields over various decades.
Risk Assessment and Management
Financial Services
The slide explores the relationship between market volatility, interest rates, and hedge fund returns, providing a historical perspective on investment performance.
volatility, interest rates, hedge fund returns, T-bill yields, market analysis
false
Volatility, rates and hedge fund returnsGuide to Alternatives
Multiple Chart
JP Morgan
View slide
A map of Southeast Asia highlighting six countries with respective population figures, set against a simple backdrop. It's visually straightforward with a focus on the geographical distribution.
Market Analysis and Trends
Technology & Software
A geographic and demographic overview of Southeast Asia, indicating the total population across six key countries and their relevance to the digital economy of the region.
Southeast Asia, Population, Countries, Digital Economy, Geography, Demographics
false
e-Conomy SEA covers 6 countries in Southeast Asiae-Conomy SEA 2022 Through the waves, towards a sea of opportunity
Uncategorized
Bain
View slide
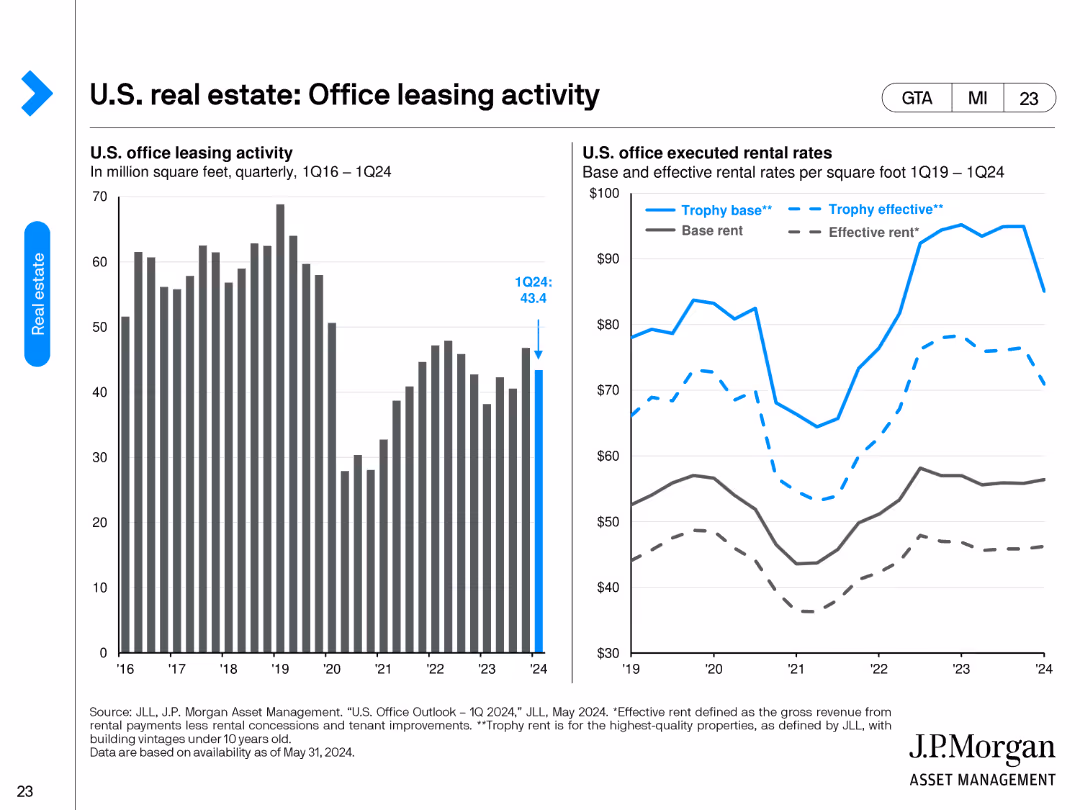
The slide contains two column charts. The left chart shows U.S. office leasing activity in million square feet from 1Q16 to 1Q24. The right chart compares base and effective rental rates per square foot from 1Q19 to 1Q24.
Market Analysis and Trends
Real Estate & Construction
This slide tracks U.S. office leasing activity and rental rates over time, providing insights into office space demand and rent dynamics. It's useful for understanding the office market's performance and trends in leasing and rental rates.
office leasing, rental rates, market performance, leasing activity, office space demand
false
U.S. real estate: Office leasing activityGuide to Alternatives
Multiple Chart
JP Morgan
View slide
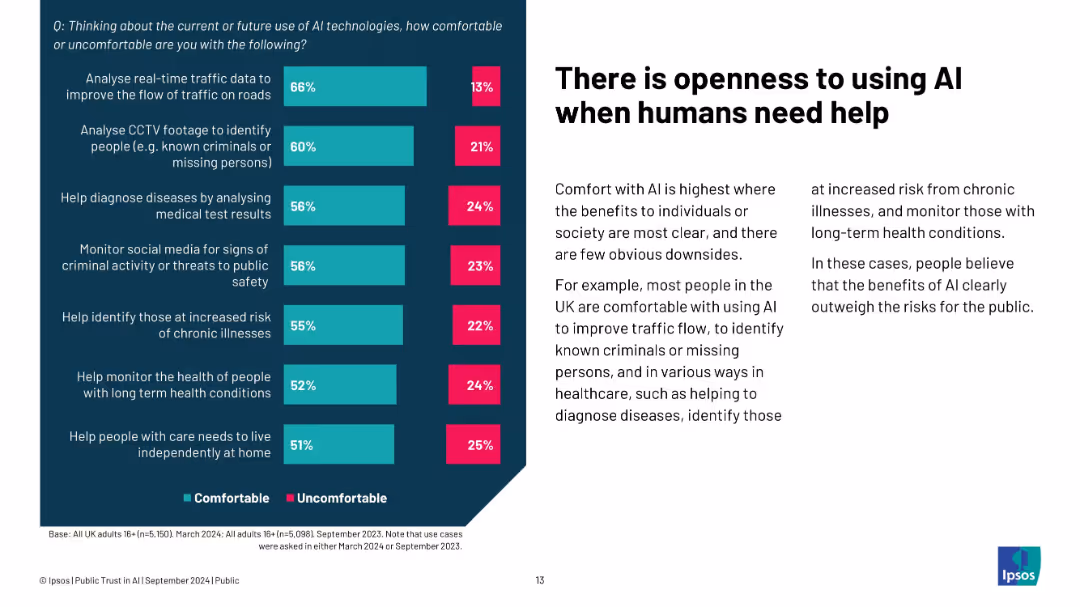
Two-column layout; left: chart showing comfort with specific AI uses; right: explanation of comfort reasons
Product and Service Analysis
Artificial Intelligence
The slide shows that the public is most open to AI applications where it provides tangible help—like health diagnostics, crime prevention, or traffic optimization. Public comfort increases when benefits clearly outweigh risks, particularly in healthcare and safety.
healthcare AI, public comfort, Ipsos, social value, diagnostic tools, AI applications, helpful technology
false
There is openness to using AI when humans need helpPUBLIC TRUST IN AI: IMPLICATIONS FOR POLICY AND REGULATION
Mixed Chart
IPSOS
View slide
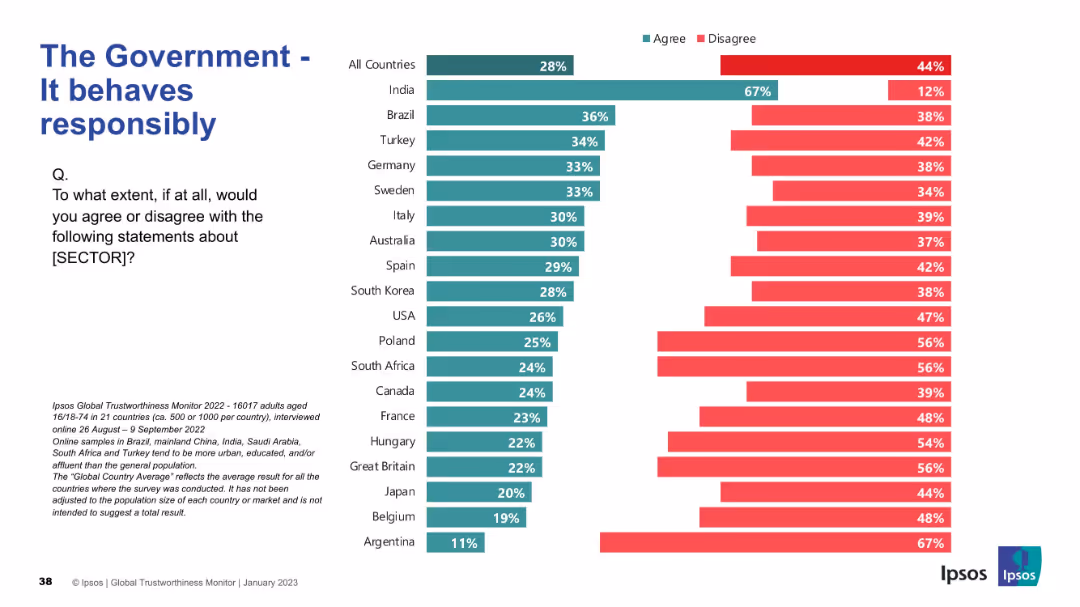
Same bar layout as previous slides; agree/disagree rating per country
Strategic Planning
Government & Public Sector
This slide presents opinions on whether governments act responsibly. India shows the highest agreement, but in most countries, disagreement exceeds agreement.
responsibility, trust, behavior, governance, Ipsos, ethics, survey results, international comparison
false
The Government - It behaves responsiblyIPSOS GLOBAL TRUSTWORTHINESS MONITOR January 2023
Mixed Chart
IPSOS
View slide
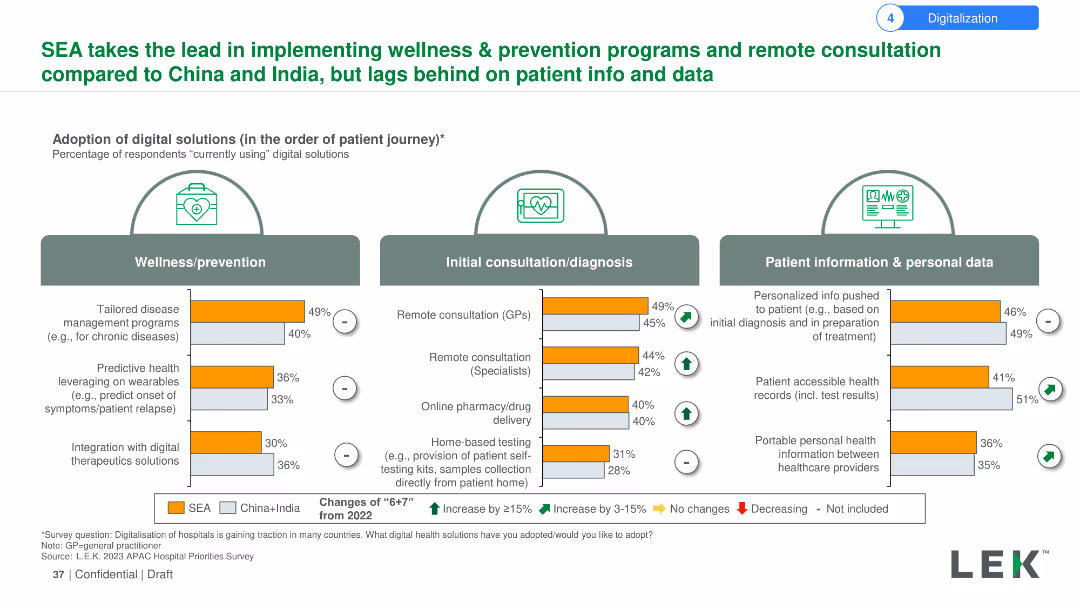
The slide uses a combination of bar charts and icons to show the adoption rates of digital solutions in wellness/prevention, initial consultation/diagnosis, and patient information/personal data. Changes from 2022 are indicated with arrows and symbols.
Market Analysis and Trends
Healthcare & Pharmaceuticals
The slide showcases SEA's leadership in adopting wellness and prevention programs and remote consultations compared to China and India. It highlights the percentage changes in digital solutions adoption rates from 2022 for different stages of the patient journey.
Wellness, prevention, remote consultation, digital solutions, SEA, China, India, adoption, patient journey, comparison
false
SEA takes the lead in implementing wellness & prevention programs and remote consultation compared to China and India, but lags behind on patient info and data2023 SEA Hospital Insights Survey Findings Summary materials
Multiple Chart
LEK
View slide
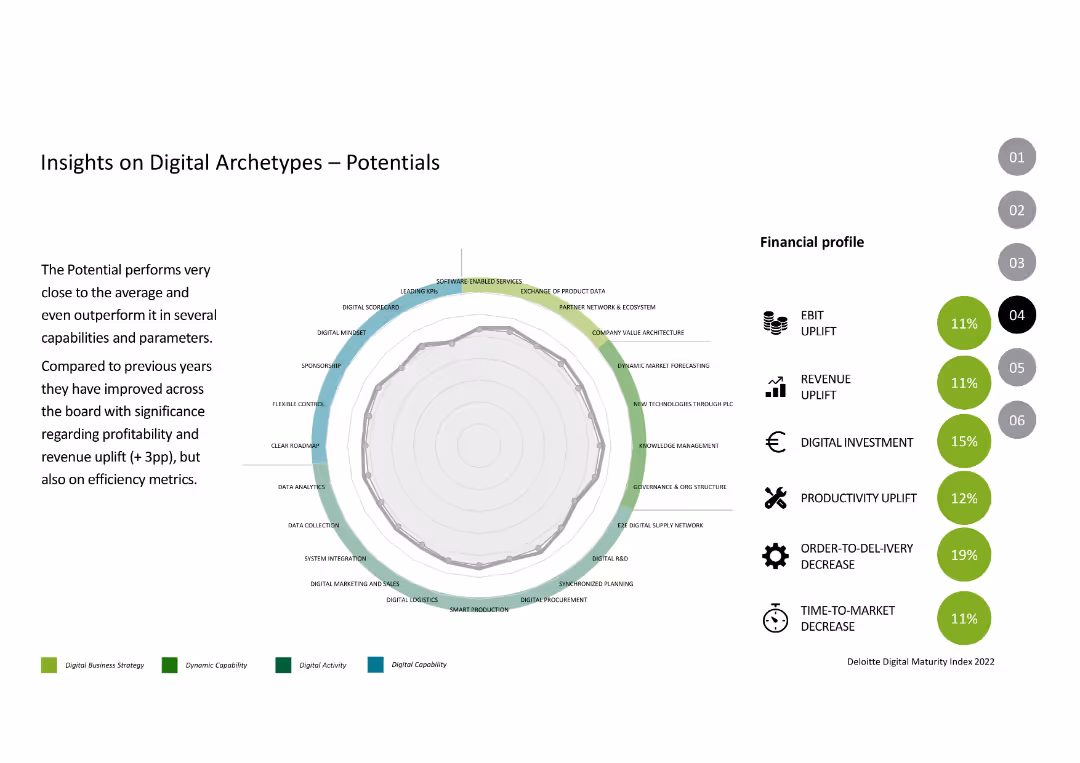
The slide includes a radar chart showing capabilities and parameters, with financial profile metrics like EBIT, revenue uplift, and productivity uplift.
Competitive Landscape
Industrial & Manufacturing
The slide discusses the "Potentials" archetype, showing their improvement in digital capabilities and financial performance over the previous year.
Digital Archetypes, Potentials, Performance, Digital Capabilities, Financial Metrics
false
Insights on Digital Archetypes – PotentialsDigital Maturity Index Survey 2022
Mixed Chart
Deloitte
View slide
This detailed slide presents a multi-layered line graph comparing the growth of 'real 10-year Treasury,' 'real S&P 500,' and 'real T-Bills' over an extensive timeline, highlighting the superior performance of equities over bonds and T-Bills. On the right, a bar chart provides 'Strategic Return Estimates (SRE) %' for various investment types. It utilizes a color scheme of blue, green, and orange to differentiate between the datasets.
Investment Analysis
Financial Services
The slide analyzes the long-term growth potential of corporate equities against fixed income investments. It contrasts the real growth, inflation, and dividends of equities with the global nominal bond yield, presenting a compelling case for equities in terms of earning inflation-adjusted returns. The strategic return estimates suggest potential returns for a range of investment types, assuming a specific average inflation rate over the next decade.
corporate equities, inflation, fixed income, S&P 500, T-Bills, Treasury, strategic return estimates, investment
false
Corporate equities (public/private) earn inflated dollars, unlike most fixed incomeCiti Global Wealth Investments OUTLOOK 2022
Mixed Chart
Citigroup
View slide
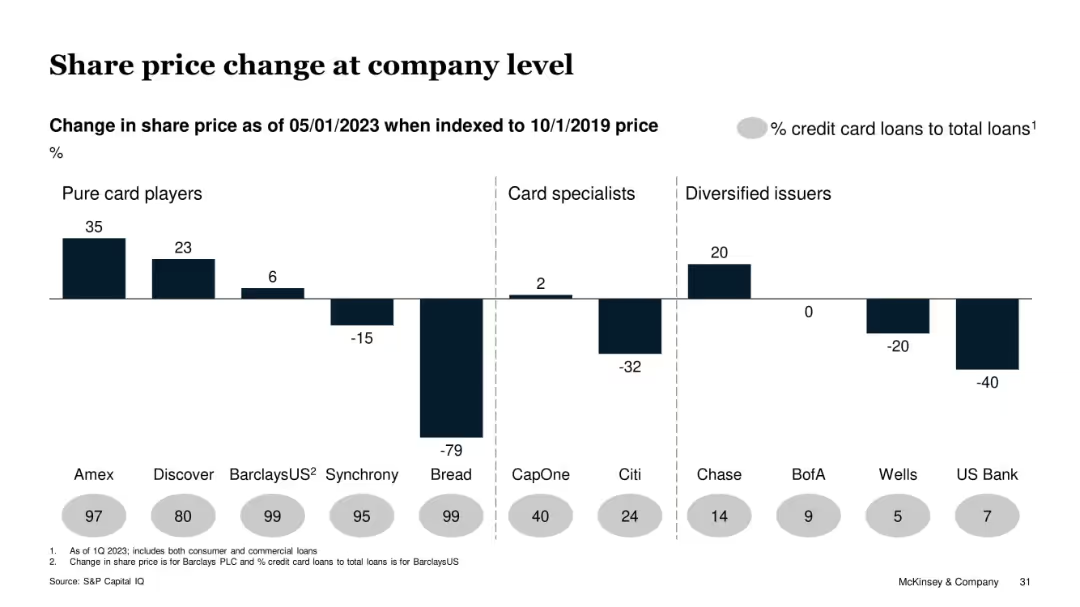
Bar chart segmented by type of issuer with annotations on credit card loan ratios
Investment Analysis
Financial Services
This slide shows share price changes (indexed to 2019) for various card issuers as of May 2023. It compares pure card players, card specialists, and diversified issuers. Players with high exposure to credit card loans (e.g., Bread) saw mixed or negative performance, while Amex had the highest gain.
share price, credit card loans, issuer comparison, McKinsey, performance analysis, equities
false
Share price change at company levelUS Credit Card Issuer Performance, 1Q 2023
Single Chart
McKinsey
View slide
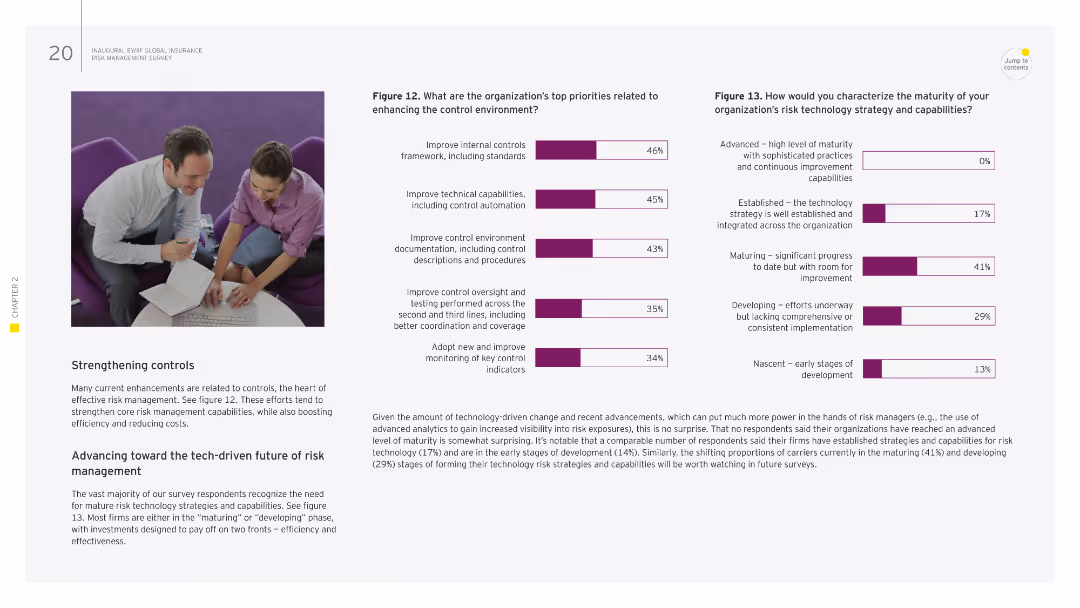
Image of two people reviewing documents. Column chart displaying the organization's top priorities related to enhancing the control environment on the right.
Risk Assessment and Management
Financial Services
This slide discusses priorities for enhancing control environments in organizations, including internal control frameworks, technical capabilities, and control environment documentation. It highlights the importance of strengthening controls and advancing towards tech-driven risk management.
controls, risk management, internal controls, technology, documentation
false
Figure 12. What are the organization’s top priorities related to enhancing the control environment?Risk management in a time of transformation
Multiple Chart
EY
View slide
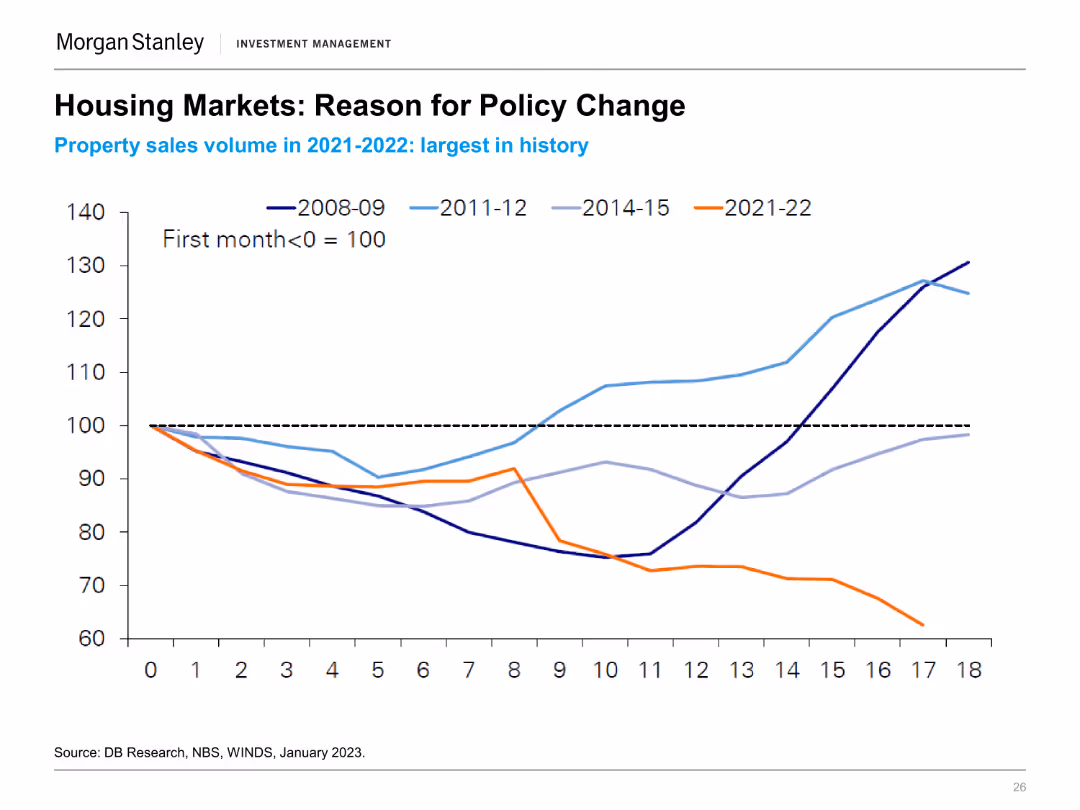
A line chart showing property sales volume (first month = 100) from 2008-09, 2011-12, 2014-15, and 2021-22, indicating historical comparisons and trends.
Regulatory and Compliance
Real Estate & Construction
The slide provides insights into China's housing market policy changes driven by the largest property sales volumes in recent history, comparing past cycles.
Housing Market, Policy Change, Property Sales, China, Historical Trends
false
Housing Markets: Reason for Policy ChangeMorgan Stanley Investment Management Emerging Markets / Asia
Single Chart
Morgan Stanley
View slide
Multiple line charts displaying mobility trends in various sectors across different countries, with annotations for key events.
Market Analysis and Trends
Transportation & Logistics
Analyzes changes in mobility patterns due to COVID-19 impacts, aiding in understanding sector-specific recoveries and ongoing restrictions.
mobility, COVID-19, sector analysis, restrictions, recovery trends
false
Retail and recreation mobility recovered fastest; public transit and workplace mobility remains lower in most countriesHow COVID-19 Changed the Consumer
Multiple Chart
BCG
View slide
The slide presents a graph depicting the importance of various online activities categorized as Essentials, Social, and Entertainment based on user enjoyment and hours spent. It features a purple color scheme, with circles representing data points.
Market Analysis and Trends
Technology & Software
The slide illustrates how users on the nbn network prioritize essential tasks but spend more time on activities they enjoy, with large circles for music streaming and social media indicating significant user importance and time investment.
nbn, user behavior, online activities, streaming, social media, essentials, enjoyment, engagement
false
The majority of nbn users consider essential online tasks more important, however they tend to spend more time on activities they find enjoyableAccenture Consumer Value Report 2021
Single Chart
Accenture
View slide
Bar chart showing the share of consumers by age who describe themselves as addicted to social media in 2019, and a column chart showing the average daily time spent on social media from 2012 to 2021.
Market Analysis and Trends
Media & Entertainment
The slide highlights the impact of social media addiction, particularly among younger age groups. It presents data on the percentage of users addicted to social media by age and the increasing amount of time spent on social media daily, raising concerns about the negative societal effects of pervasive social media use.
Social Media, Addiction, Time Spent, Age Groups
false
New technologies do not necessary influence society for the better Younger age groups state a notable addiction to social mediaMegatrend 5 - Technology & Innovation
Multiple Chart
Roland Berger
View slide
Presents a series of column chart with quantitative data about Macquarie's capital requirements, accompanied by a side panel detailing key drivers affecting these figures.
Operational Efficiency
Financial Services
This slide analyzes business capital requirements and the key drivers affecting them within Macquarie. It is relevant for discussions on financial planning and operational efficiency.
Capital Requirements, Financial Planning, Key Drivers, Operational Efficiency
false
Business capital requirementsMorgan Stanley Virtual Hong Kong Summit
Mixed Chart
Morgan Stanley
View slide
Slide features a pie chart in dark grey background. The chart details share of global GDP among services, emission-intensive industries, and all others.
Industry Overview
Energy & Utilities
This slide discusses the distribution of global GDP, emphasizing the smaller proportion held by emission-intensive industries, which might be seen as less competitive due to emissions constraints.
GDP, services, industries, emissions, competitiveness
false
Fear of losing competitiveness is overstatedClimate Change: BCG’s Perspectives and Offerings
Single Chart
BCG
View slide
The slide includes a split purple and violet background with two illustrative images and text. On the left are icons representing 'Essential tasks' and 'Enriching activities'.
Technology and Digital Transformation
Technology & Software
It showcases key messages about the nbn network's role in providing essential services and enriching lives, emphasizing its value and necessity.
nbn network, essential services, enriching activities, connectivity, online tasks, value proposition, brand messaging
false
AgendaAccenture Consumer Value Report 2021
Agenda
Accenture
View slide
The slide displays a column chart comparing the personal luxury goods market by geography and consumer nationality between 2016 and 2017. It uses color distinctions in red and gray to represent different areas and consumer groups, highlighting shifts in market compositions and growth rates.
Market Analysis and Trends
Consumer Goods
Examines growth in the personal luxury goods market, detailing shifts by geographical and consumer nationality perspectives from 2016 to 2017. Emphasizes the accelerating purchases in regions and among different consumer bases, particularly noting the substantial growth among Chinese consumers.
luxury goods, market growth, geographical analysis, consumer trends
false
POSITIVE GROWTH ACROSS THE BOARD, WITH BOTH CHINA AND CHINESE PURCHASES ACCELERATINGALTAGAMMA 2017 WORLDWIDE LUXURY MARKET MONITOR
Multiple Chart
Bain
View slide
The slide features column charts comparing CO₂ emissions and abatement costs across different energy sources and scenarios. It's moderately complex with clear visuals.
Risk Assessment and Management
Energy & Utilities
Evaluates the impact of connecting injection plants to REN without grid back-up on CO₂ emissions and associated costs, presenting detailed emissions data and analysis.
CO₂ emissions, injection plants, REN, grid back-up, abatement cost, 2030, risk management, cost analysis
false
Avoided CO2 and abatement cost (2030, kgCO2/kgH2, $ per tCO2)Hydrogen applications and business models
Multiple Chart
Kearney
View slide
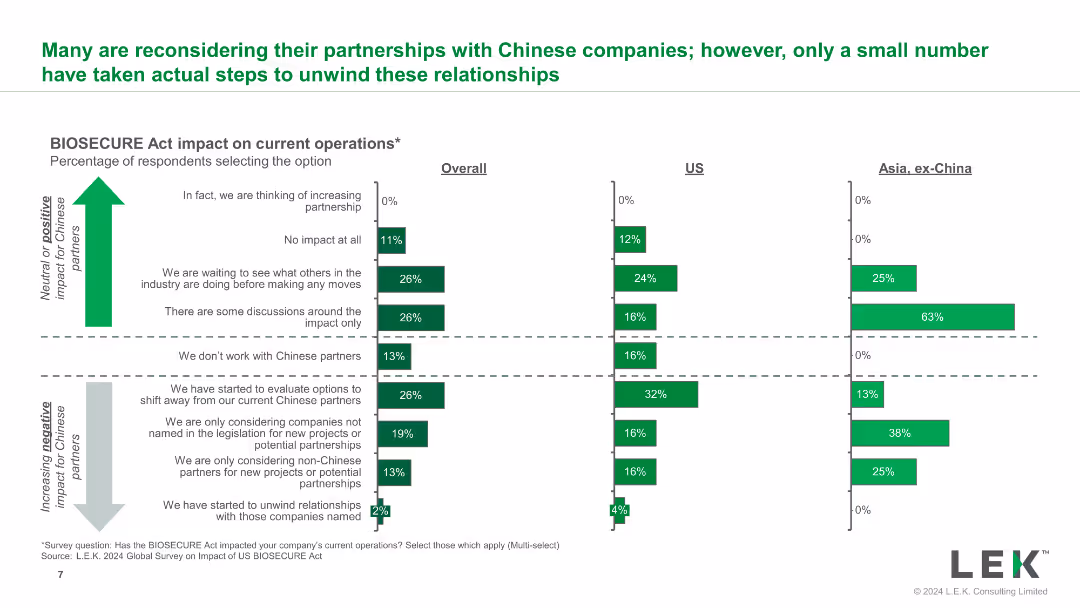
The slide features a bar chart that shows the percentage of respondents selecting various impacts of the BIOSECURE Act on their current operations. The chart is divided into overall, US, and Asia categories.
Regulatory and Compliance
Healthcare & Pharmaceuticals
This slide provides insights into how the BIOSECURE Act has affected current operations across different regions, highlighting the percentage of companies reconsidering their partnerships.
BIOSECURE Act, operations impact, respondents, current operations, Asia, US
false
Many are reconsidering their partnerships with Chinese companies; however, only a small number have taken actual steps to unwind these relationshipsImpact of the US BIOSECURE Act on Biopharmas, Contract Services and Investors
Multiple Chart
LEK
View slide
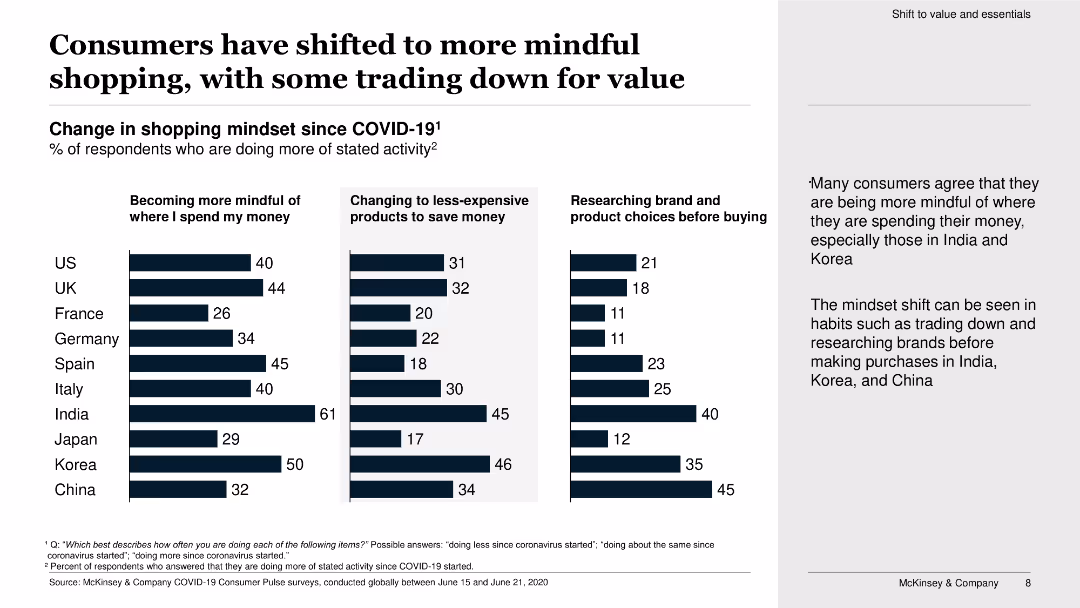
The slide contains three vertical bar charts showing the percentage of respondents becoming more mindful of spending, changing to less-expensive products, and researching before buying.
Market Analysis and Trends
Retail & E-commerce
The slide shows changes in consumer shopping mindsets since COVID-19, highlighting an increase in mindful spending, trading down for value, and product research.
mindful shopping, trading down, value, COVID-19, bar chart, consumer behavior, spending, research, products, survey
false
Consumers have shifted to more mindful shopping, with some trading down for valueA global view of how consumer behavior is changing amid COVID-19
Multiple Chart
McKinsey
View slide
The slide includes column charts showing Americans' coping mechanisms during the pandemic and generational differences in mental health perceptions.
Market Analysis and Trends
Healthcare & Pharmaceuticals
This slide explores changing attitudes towards mental health in America, particularly in light of the pandemic, and highlights the differences in mental health views and coping strategies across generations.
Mental health, pandemic impact, generational differences, survey, wellness
false
How are mental health views changing?WHAT THE FUTURE: WELLNESS
Multiple Chart
IPSOS
View slide
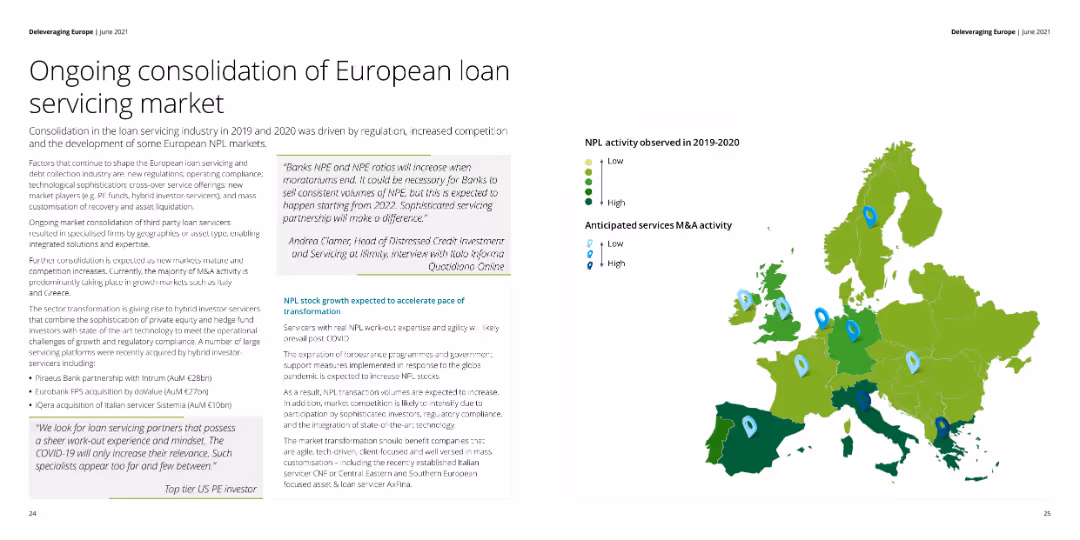
The slide includes a map showing NPL activity across Europe with varying intensities. Text blocks provide insights into market consolidation, regulatory impacts, and quotes from industry experts.
Market Analysis and Trends
Financial Services
This slide discusses the consolidation of the European loan servicing market, driven by regulatory changes and market conditions. It includes a map showing NPL activity levels and anticipates M&A activity.
NPL activity, market consolidation, Europe, M&A
false
Ongoing consolidation of European loan servicing marketDeleveraging Europe
Graphic
Deloitte
View slide
The slide features two visual sections: a column chart on the left representing financing and wallet share gains and showing a 10-year revenue mix. The header and footer are dark blue, and the page number is at the bottom right.
Financial Performance
Financial Services
Catered to the financial services industry, the slide portrays a 10-year revenue mix and illustrates durable revenue growth from a solid base. The visual representations are suited for demonstrating financial stability and strategic growth to investors or stakeholders, focusing on the importance of a solid financial base for enduring revenue growth, and can be effectively used in financial strategy sessions or investor relations communications.
Revenue Growth, Stability, Financial Base, Wallet Share, Financing, Global Markets
false
Global Markets: Grow More Durable Revenues from a Solid BaseGoldman Sachs Presentation to Bernstein Strategic Decisions Conference
Multiple Chart
Goldman Sachs
View slide
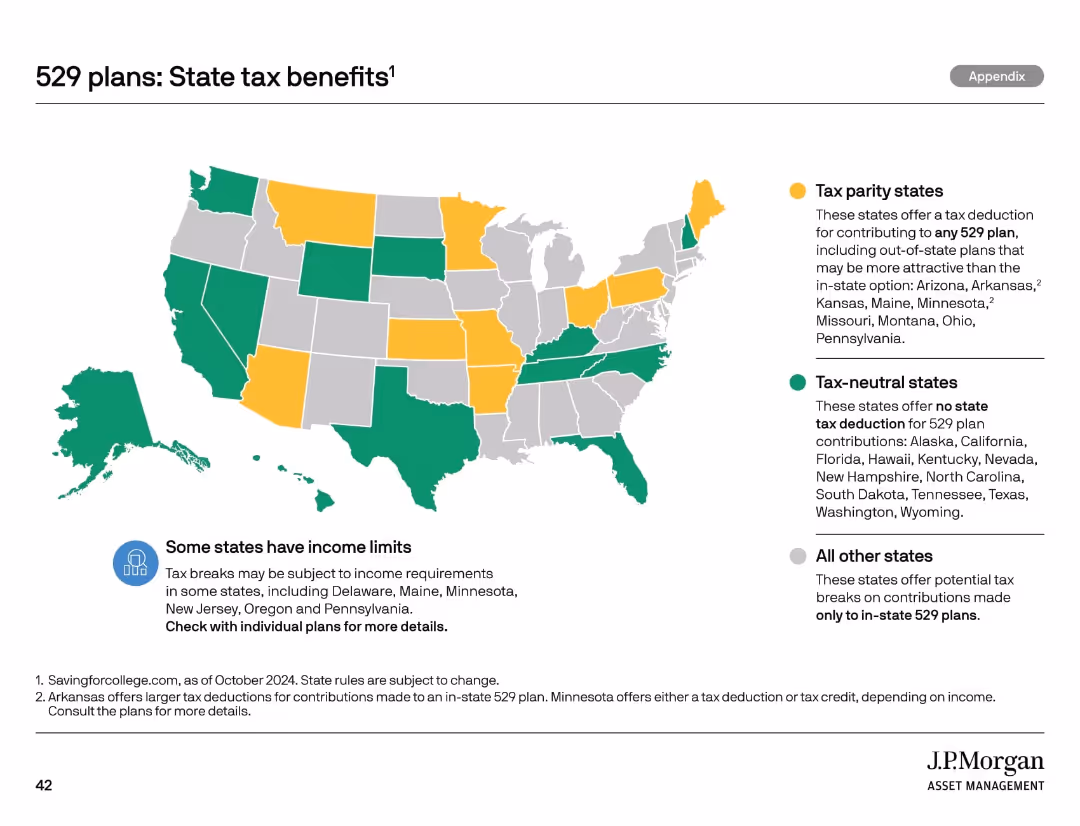
U.S. map color-coded by tax benefit categories. Text boxes explain tax rules and conditions per state.
Regulatory and Compliance
Financial Services
Displays the differences in state tax benefits for 529 plan contributions. Distinguishes between tax parity, tax-neutral, and in-state-only benefit states. Encourages checking local rules for contribution advantages.
529 plan, state tax, map, regulation, contributions
false
529 plans: State tax benefitsCollege Planning Essentials A comprehensive guide to saving and investing
Mixed Chart
JP Morgan
View slide
Multiple column charts over three slides, showing global perspectives on the strength of organizational culture including purpose, leadership, and employee motivation.
Market Analysis and Trends
Professional Services
Examines the perceived strength of organizational cultures globally, focusing on leadership's effectiveness and employee connection to organizational goals.
organizational culture, leadership effectiveness, employee motivation, global perspectives
false
5. Innovation, talent and digitization are top concerns across major economiesGlobal Culture Survey 2021
Single Chart
PwC/Strategy&
View slide
Single-column layout with a bar chart showing fintech adoption rates across 20 markets. Uses flags and horizontal bars to represent adoption percentages for each country.
Market Analysis and Trends
Financial Services
Shows the progress of fintech adoption globally, highlighting the percentage of adoption in various countries, categorized by early adopters, early majority, and late majority.
fintech, adoption, global, markets, progress
false
Fintech has achieved initial mass adoption in most marketsInsights from the EY FinTech Adoption Index and EY FinTech Australia Census
Single Chart
EY
View slide
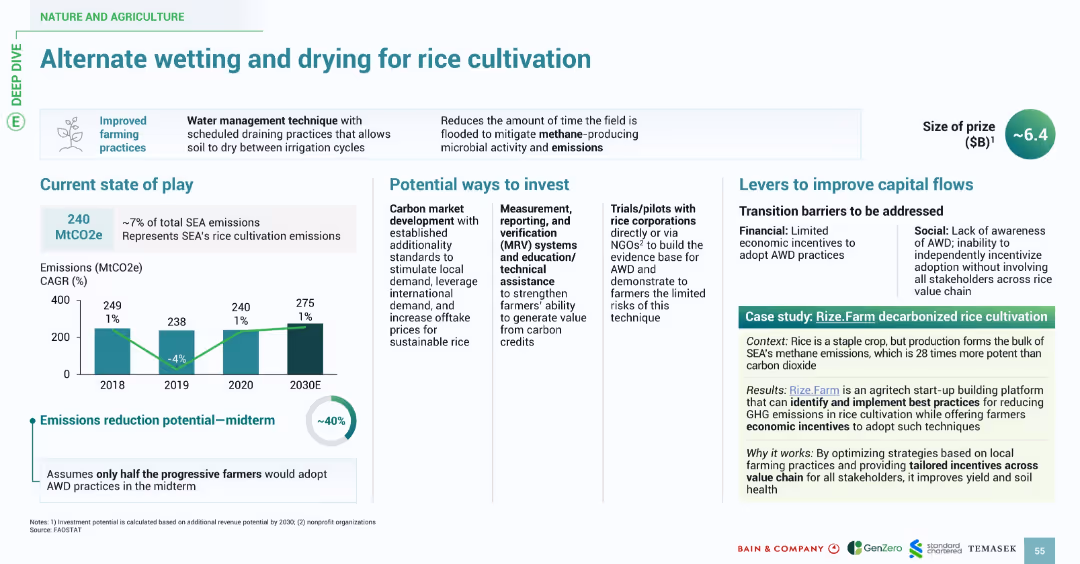
Split into sections with icons and clearly labeled headings. Includes bar chart (emissions), bullet-point lists, and a case study box. Color accents in green and teal reinforce environmental theme.
Operational Efficiency
Agriculture & Food Production
This slide promotes a water management technique for rice cultivation in Southeast Asia (SEA) that reduces methane emissions. It outlines current emissions levels, potential investment pathways, emission reduction potential (~40%), and implementation challenges. A case study (Rize.Farm) demonstrates how optimized local farming practices and incentives can improve soil health and reduce GHG emissions.
AWD, rice cultivation, methane, emissions, investment, case study, farming, SEA, carbon
false
Alternate wetting and drying for rice cultivationSOUTHEAST ASIA’S GREEN ECONOMY 2024
Multiple Chart
Bain
View slide
Column chart with annotations comparing marketplace and logistics funding over years, set against a white and blue backdrop.
Market Analysis and Trends
Technology & Software
Analyzes the e-commerce sector's shift, noting a reduction in logistics deals after a period of growth and market consolidation.
e-commerce, logistics, funding trends, market consolidation, deal reduction, column chart, marketplace, SEA
false
E-commerce: Logistics deals diminishing after years of growthe-Conomy SEA 2022 Through the waves, towards a sea of opportunity
Mixed Chart
Bain
View slide
The slide presents a diagram categorizing different carbon separation technologies. It uses a hierarchical structure with boxes and arrows, featuring both text and colored elements.
Technology and Digital Transformation
Energy & Utilities
The slide categorizes various CO₂ separation technologies, detailing methods like absorption, adsorption, membranes, liquid/supercritical CO₂, and novel technologies.
Carbon separation, absorption, adsorption, membranes, CO₂ technologies, energy, utilities, chemical processes
false
The separation of CO2 molecules contained in exhausting gases can be realized through four main technologies (1/3)Carbon Capture Utilization and Storage
Diagram
Kearney
View slide
The slide contains multiple column charts and a pie chart, presenting data on hourly, monthly, and daily consumption. It uses different colors to differentiate between various consumption metrics and customer types.
Operational Efficiency
Energy & Utilities
The slide provides a comprehensive dashboard for energy consumption data, including hourly, monthly, and daily consumption metrics, segmented by customer type, aiding in operational monitoring and efficiency.
Consumption, Dashboard, Energy, Metrics, Customer Types
false
Additional Information Consumption Dashboard*SAP Innovation Awards 2022 Entry Pitch Deck
Multiple Chart
EY
View slide
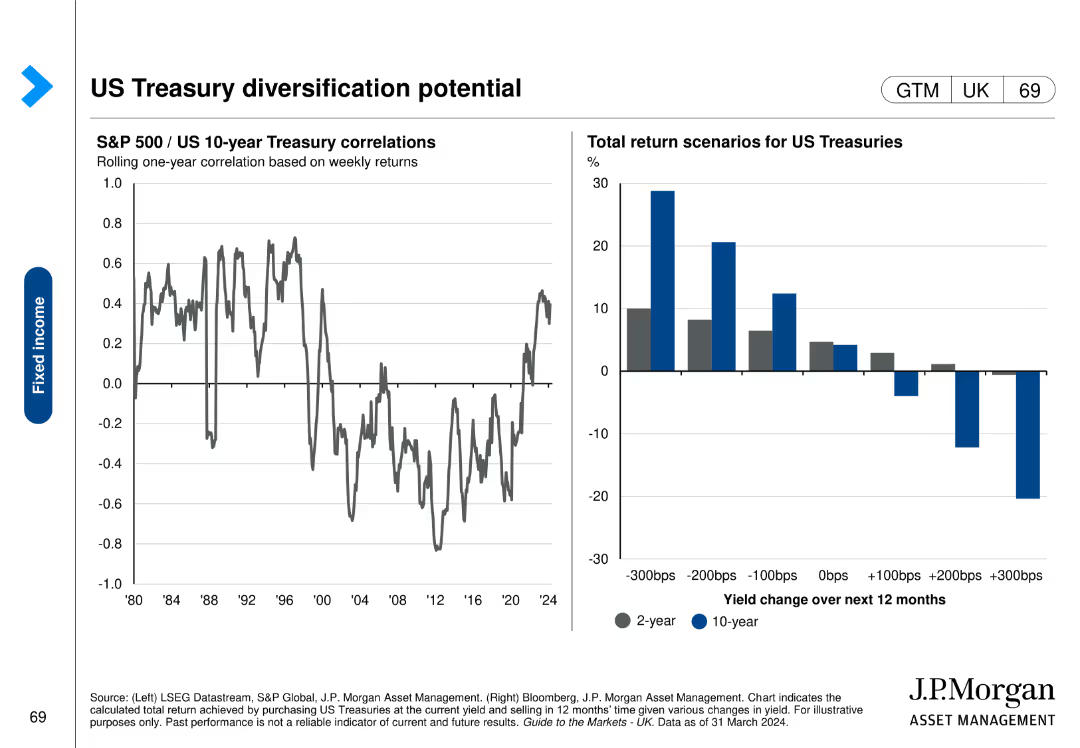
Contains a line chart on the left showing S&P 500/US 10-year Treasury correlations over time and a column chart on the right displaying total return scenarios for US Treasuries.
Investment Analysis
Financial Services
This slide analyzes the correlation between S&P 500 and US 10-year Treasury bonds, highlighting the potential diversification benefits. It includes return scenarios for different yield changes.
US Treasuries, diversification, correlations, return scenarios, S&P 500
false
US Treasury diversification potentialGuide to the Markets UK | Q2 2024
Multiple Chart
JP Morgan
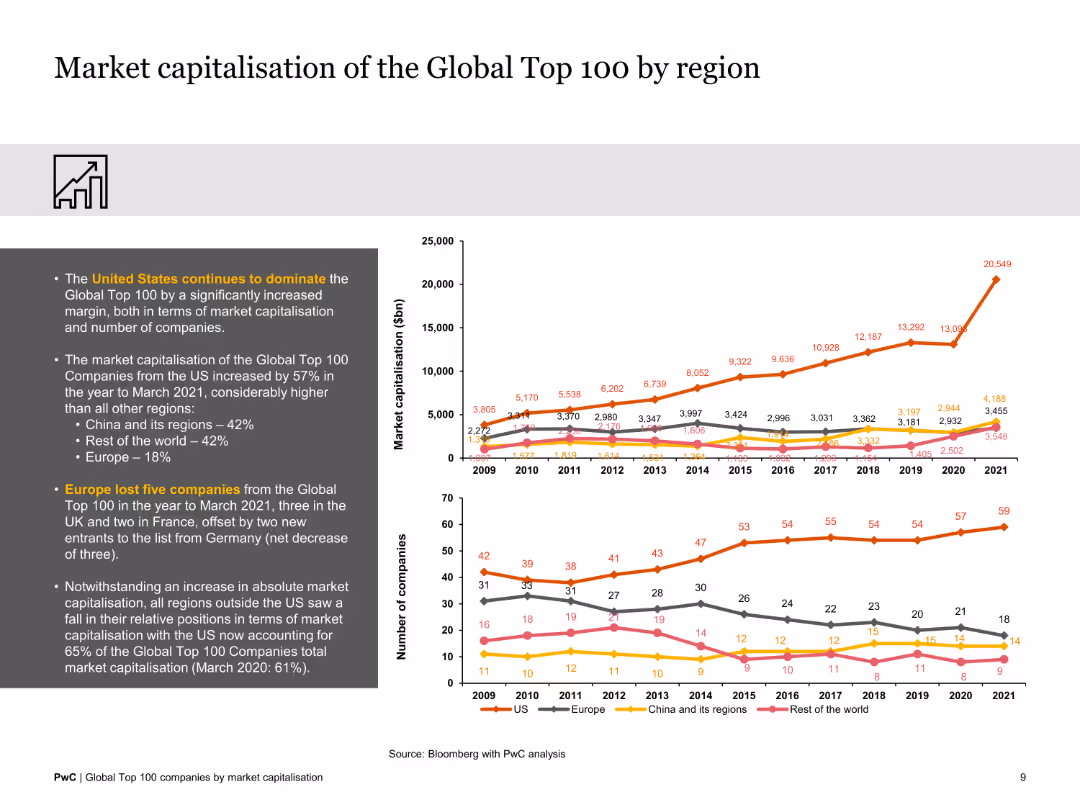
View slide
Contains two line charts displaying regional market capitalization data and the number of companies from each region. The slide is visually organized and data-rich.
Market Analysis and Trends
Financial Services
The slide provides an analysis of market capitalization by region, showing the dominance of the US and comparing it with other regions like Europe, China, and the rest of the world.
regional analysis, market dominance, US, Europe, China, financial comparison, global trends
false
Market capitalisation of the Global Top 100 by regionGlobal Top 100 companies by market capitalisation
Multiple Chart
PwC/Strategy&
View slide
This slide features a mix of text and a column chart. The text is on the left side, while the chart is on the right. The chart highlights various performance optimization approaches by percentage.
Investment Analysis
Financial Services
The slide discusses different approaches APAC family offices plan to implement to optimize performance and measure success, focusing on ESG factors and sustainability initiatives.
APAC, family offices, performance, optimization, ESG
false
APAC family offices are deploying a number of approaches to optimize & measure performanceEY Family Office Study
Mixed Chart
EY
View slide
Photos of branch interiors and community engagement. Data boxes outline community strategy and roles.
Strategic Planning
Financial Services
Bank's approach to community engagement through tailored branch formats and local strategy implementation.
Community Engagement, Branch Evolution, Tailoring Execution, Local Strategy, Financial Services
false
We are evolving our branches and tailoring execution to meet the needs of local communitiesConsumer & Community Banking
Table
JP Morgan
View slide
Similar flow diagram to previous slide, but based on unit counts instead of tonnes, with same structure and annotations
Operational Efficiency
Environmental Services & Sustainability
This slide mirrors the previous one but tracks the same aluminium can material flows in billions of units rather than kilotonnes. It reaffirms the flow of waste through CDS, sorting, and exports while emphasizing export destinations and sources of material inefficiencies.
aluminium units, flow chart, recycling units, CDS export, waste tracking, sustainability, Australia
false
Material flows of aluminium cans, 2020-21 [b units2)3), (% of total POM volume)]Aluminum Cans Market Assessment - Australia
Mixed Chart
Roland Berger
View slide
A column chart displaying tax-equivalent yields of various bonds and a column chart showing 5-year correlations with municipal bonds. The design is clean and data-focused.
Financial Performance
Financial Services
The slide compares the tax-equivalent yields of different bond types and their 5-year correlations with municipal bonds, useful for evaluating bond investment strategies.
municipal bonds, tax-equivalent yield, correlation, investment, bonds
false
Municipal Bonds Tax equivalent Yield and 5 year CorrelationMonthly Market Monitor November 2023
Multiple Chart
Morgan Stanley
View slide
Line chart displaying population growth trends by region from 2012–2021, with CAGR metrics. Organized by country/region, clean layout.
Market Analysis and Trends
Government & Public Sector
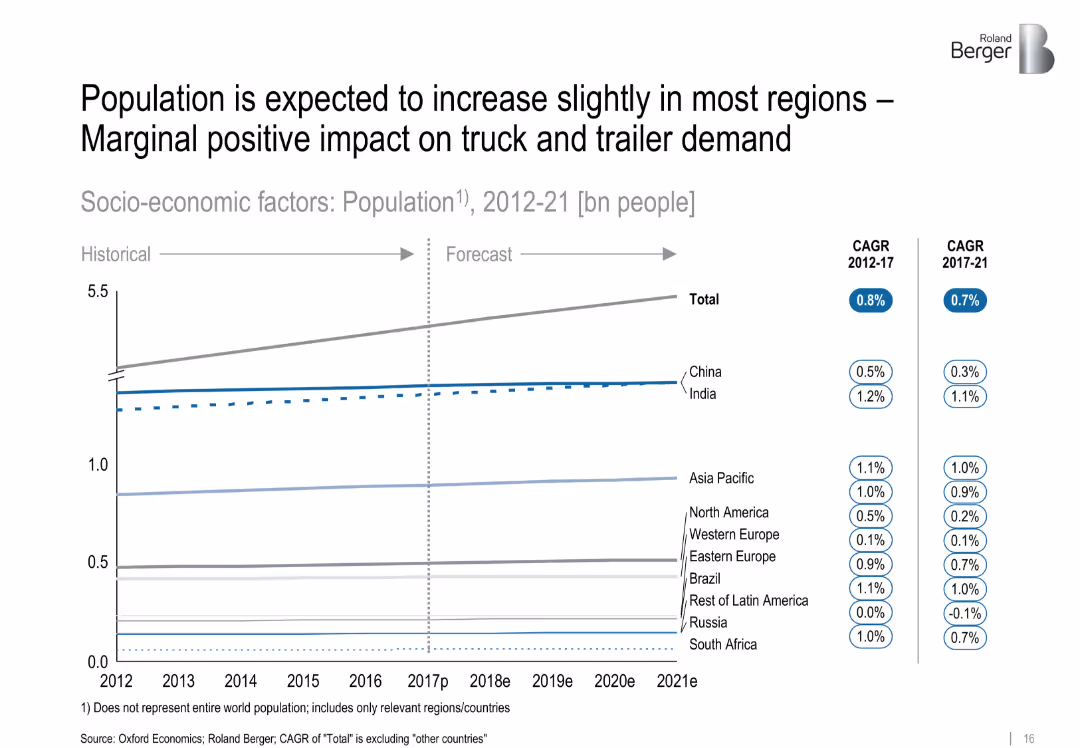
The slide projects population growth across various regions, noting modest increases. The implication is a marginal positive effect on logistics and truck/trailer demand due to expanding consumer bases.
['population', 'demographics', 'growth trend', 'logistics impact', 'market drivers', 'regional analysis', 'forecast']
false
Population is expected to increase slightly in most regions – Marginal positive impact on truck and trailer demandTruck and trailer components – Success factors for suppliers in specialized markets
Single Chart
Roland Berger
View slide
The slide features a line graph showing the GDP and employment trends in Canada, illustrating a steep drop-off and recovery.
Market Analysis and Trends
Financial Services
It depicts the economic impact of the pandemic on GDP and employment, showing a classic "V" shaped recovery pattern.
GDP, employment, Canada, economic impact, pandemic, recovery, V-shape, trends, line graph, analysis
false
Steep Drop-Off and Steep Recovery – Classic “V”Market Year in Review and Outlook 2021
Single Chart
IPSOS
View slide
This slide contains a column chart showing the emphasis on following Agile ceremonies over outcomes, with green and blue bars.
Strategic Planning
Technology & Software
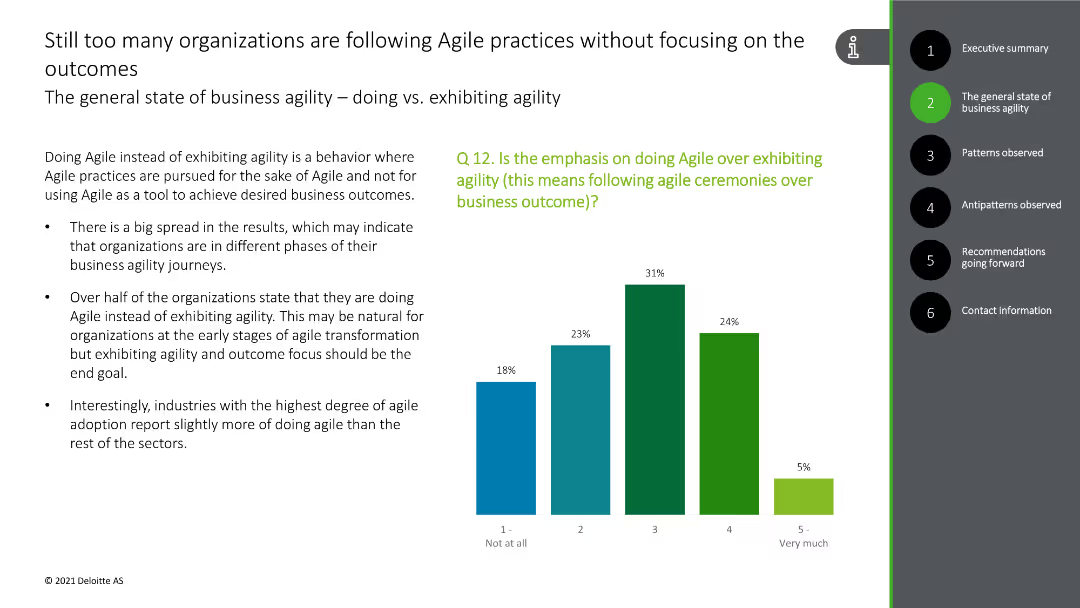
The slide discusses the focus on Agile practices rather than outcomes in many organizations, with survey data supporting this observation.
Agile practices, outcomes, focus, survey data, organizational behavior
false
Still too many organizations are following Agile practices without focusing on the outcomesDeloitte Business Agility Survey 2021 A pulse check of business agility in the Nordics
Mixed Chart
Deloitte
View slide
This slide serves as a section header or cover slide for a report on Southeast Asia's digital economy. It features a timeline from 2016 to 2030 with key milestones and a graphical representation of wind turbines.
Industry Overview
Financial Services
A summary of the digital economy's growth in Southeast Asia, tracking significant milestones over time and looking towards a sustainable digital economy by 2030.
Digital Economy, SEA, Google, Temasek, Bain, Research, Growth, Sustainability
false
7 th edition of e-Conomy SEA by Google, Temasek, Bain: Southeast Asia’s digital economy research programmee-Conomy SEA 2022 Through the waves, towards a sea of opportunity
Linear Flow
Bain
View slide
This slide displays a combination of column charts and line graphs in a blue and white color palette, projecting the growth of the Philippines' digital economy, specifically highlighting e-commerce, transport & food, online travel, and online media sectors. Each sector's growth trajectory from 2021 to 2030 is clearly shown, with annotations for compounded annual growth rates (CAGR).
Market Analysis and Trends
Retail & E-commerce
This slide analyzes the anticipated growth of the digital economy in the Philippines, with a projection of reaching approximately $35 billion by 2025, driven by e-commerce. It serves as an analytical tool for market researchers, strategists, and business development professionals to identify trends and investment opportunities within the digital marketplace of the Philippines.
Philippines, Digital Economy, E-commerce, Growth, Projection, CAGR, Online Travel, Media, Transport
false
Philippines Philippines is expected to continue its double-digit climb towards ~$35B by 2025, largely fueled by e-commercee-Conomy SEA 2023 report: Philippines
Multiple Chart
Bain
View slide
The slide includes a column chart showing the number of esports M&A deals by quarter from 2019 to Q3 2022. Text provides insights into investment activities and trends within the esports sector during this period.
Mergers and Acquisitions
Media & Entertainment
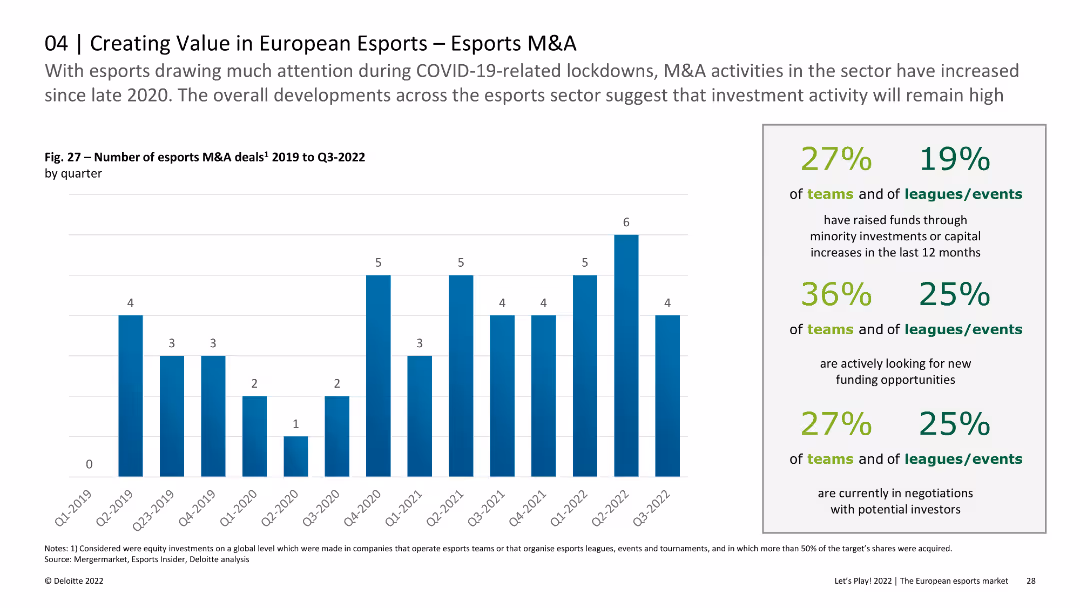
This slide analyzes the quarterly number of M&A deals in the esports sector from 2019 to Q3 2022, discussing how COVID-19 and other factors influenced investment activities and the overall market dynamics.
esports, M&A, quarterly deals, investment, trends
false
With esports drawing much attention during COVID-19-related lockdowns, M&A activities in the sector have increased since late 2020.Let’s Play! 2022 The European esports market
Mixed Chart
Deloitte
View slide
The slide is text-heavy with bullet points under three headers: Depth of disruption, Length of disruption, and Shape of recovery, each with key indicators to monitor.
Strategic Planning
Financial Services
Designed for business strategists, this slide outlines the key indicators to monitor during a crisis for assessing disruption depth, length, and recovery shape.
disruption, indicators, recovery, crisis management, business strategy, monitoring, depth, length, shape
false
What business leaders should look for in coming weeks Epidemiological indicator Economic indicator There are three questions business leaders are asking, and a small number of indicators that can give cluesCOVID-19: Briefing Note
Header Horizontal
McKinsey
View slide
Slide with a pie chart and world map indicating market share and growth expectations. Use of icons and color-coding for regions.
Market Analysis and Trends
Financial Services
Analyzes global ultra-high net worth investable assets with goals for hiring wealth advisors and regional growth percentages.
wealth management, market share, UHNW, global assets, growth expectations, private wealth advisors, regional analysis, hiring goals, strategy
false
Unique Wealth Management Capabilities with Room to Increase ShareGoldman Sachs Investor Day
Mixed Chart
Goldman Sachs
View slide
The slide presents a comparative analysis of three consumer clusters (EV owners, EV prospects, EV sceptics) using column charts and text boxes. It highlights key traits and focus areas for each group.
Customer and Market Segmentation
Consumer Goods
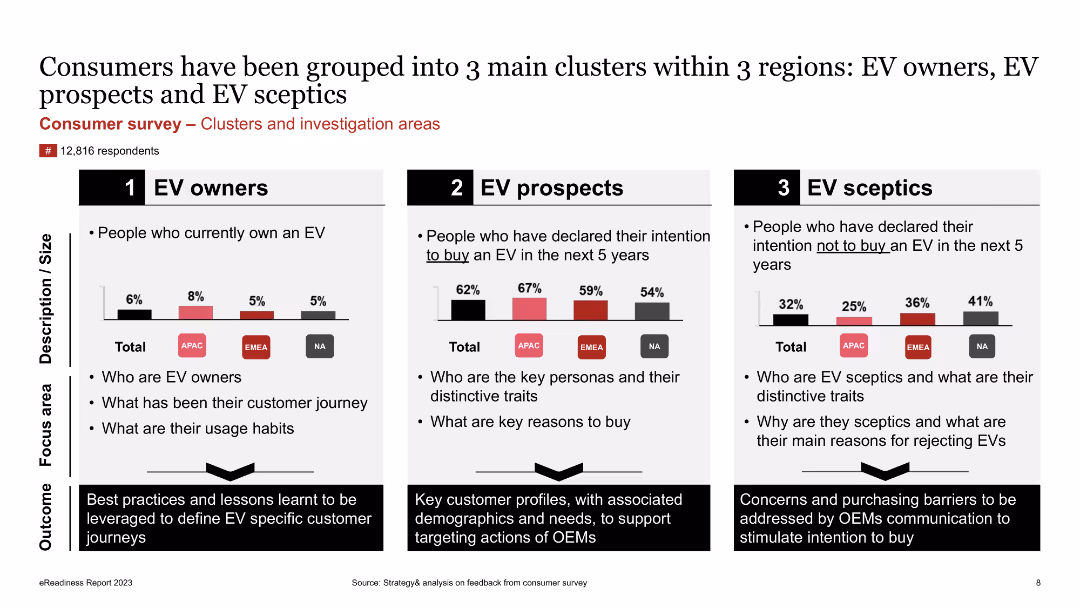
The slide categorizes consumers into three clusters based on their EV ownership and intentions: EV owners, EV prospects, and EV sceptics. It identifies the key traits, usage habits, and reasons for or against buying EVs, providing insights for targeted marketing strategies.
Consumer Survey, Clusters, EV Owners, EV Prospects, EV Sceptics, Market Segmentation, Traits, Focus Areas
false
Consumers have been grouped into 3 main clusters within 3 regions: EV owners, EV prospects and EV sceptics4th edition eReadiness 2023
Multiple Chart
PwC/Strategy&
View slide
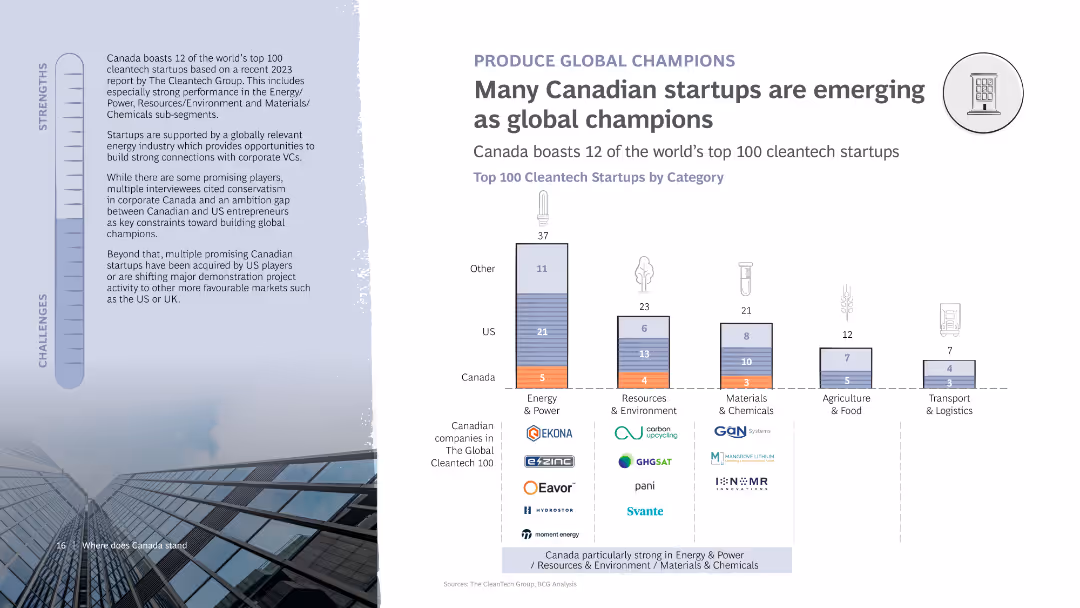
The slide includes a column chart showing the top 100 cleantech startups by category, with a breakdown of companies from Canada and the US. It features text discussing the strengths and challenges of Canadian startups in becoming global champions.
Competitive Landscape
Technology & Software
Discusses the emergence of Canadian startups as global leaders in cleantech, with specific examples from various categories. Highlights strengths and challenges in achieving global recognition and success.
Startups, Cleantech, Canada, Global champions, Chart
false
Many Canadian startups are emerging as global championsTHE CANADIAN VENTURE OPPORTUNITY
Mixed Chart
BCG
View slide
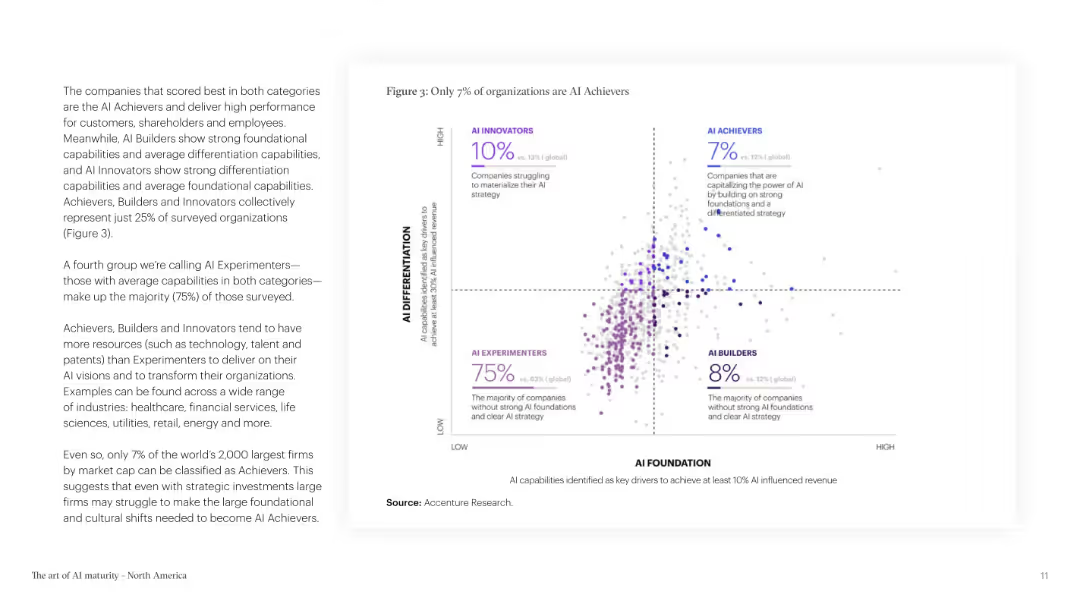
The slide features text and a scatter plot chart categorizing organizations based on AI differentiation and foundation. The color scheme is purple and white.
Technology and Digital Transformation
Technology & Software
The slide categorizes organizations into achievers, builders, innovators, and experimenters based on their AI strategies and foundations, highlighting the small percentage of AI achievers.
AI Achievers, Organizational Strategy, AI Foundation, AI Differentiation, Technology, Business Strategy
false
Figure3: Only 7% of organizations are AI AchieversThe art of AI maturity Advancing from practice to performance North America
Mixed Chart
Accenture
View slide
The slide showcases line graphs for yield ratios and credit quality spreads, with annotations for current, 1-month ago, 12-months ago, and median values.
Market Analysis and Trends
Financial Services
Focuses on the investment attractiveness of municipal bonds by comparing yields and credit spreads with benchmarks, useful for trend analysis and strategic decision-making in fixed income investments.
municipal bonds, yield ratios, credit spreads, line graphs, market trends, investment analysis
false
Municipal Bond Market UpdateMonthly Market Monitor November 2023
Multiple Chart
Morgan Stanley
View slide
The slide presents a stacked column chart comparing expenses for two fiscal years, with annotations detailing contributing factors to changes in expenses.
Operational Efficiency
Financial Services
This slide analyzes expense growth, offering insights into cost management and areas where the company has invested or saved. It is useful for stakeholders interested in understanding the financial management and operational efficiency of the company.
expenses, fiscal year, cost management, operational efficiency
false
FY 2022 vs. FY 2021 Expense GrowthEarnings Results Presentation Fourth Quarter and Full Year 2022
Single Chart
Citigroup
View slide
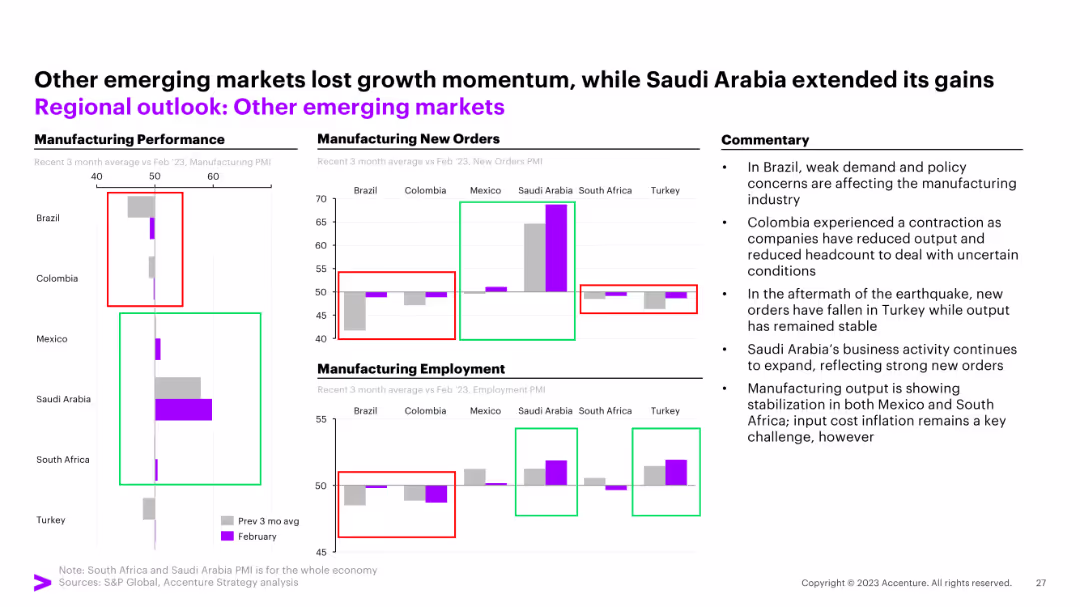
Combination of bar charts and column charts for manufacturing performance, new orders, and employment
Market Analysis and Trends
Financial Services
This slide focuses on other emerging markets, detailing manufacturing performance, new orders, and employment trends.
emerging markets, manufacturing performance, new orders, employment trends
false
Other emerging markets lost growth momentum, while Saudi Arabia extended its gainsMarch Macro Brief Financial fissures emerge
Multiple Chart
Accenture
View slide
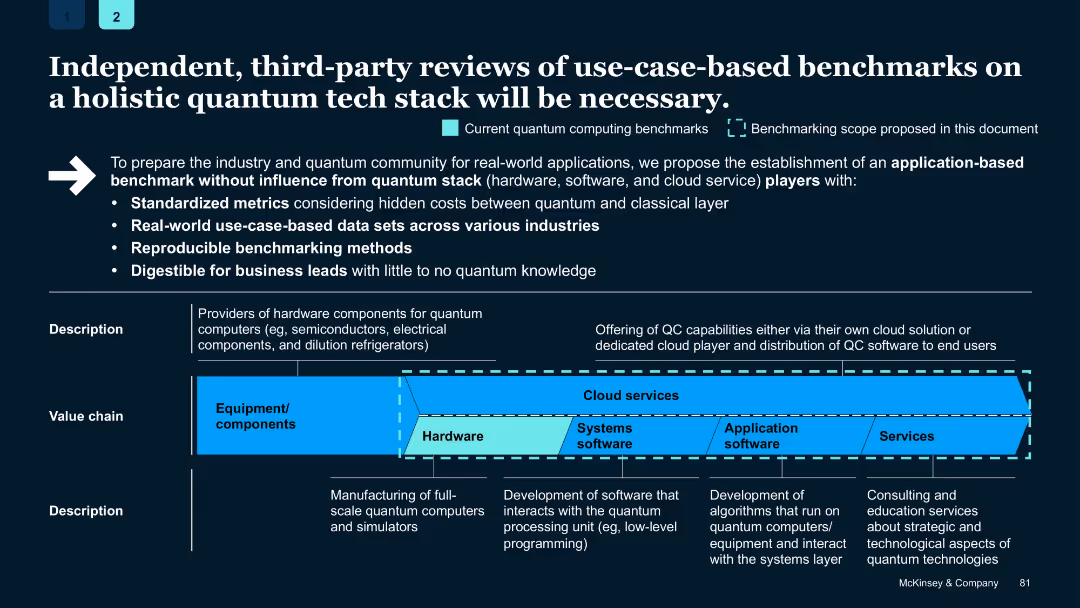
Dark-themed slide with horizontal value chain diagram, arrows and bullet points; callouts highlight benchmarking domains
Technology and Digital Transformation
Technology & Software
Emphasizes the need for unbiased, third-party benchmarking for quantum computing tech stacks using standardized metrics, reproducible methods, and real-world data to support business decisions across the stack from hardware to services.
quantum computing, benchmarking, tech stack, standardized metrics, hardware, software, cloud, third-party
false
Independent, third-party reviews of use-case-based benchmarks on a holistic quantum tech stack will be necessary.Quantum Technology Monitor
Uncategorized
McKinsey
View slide
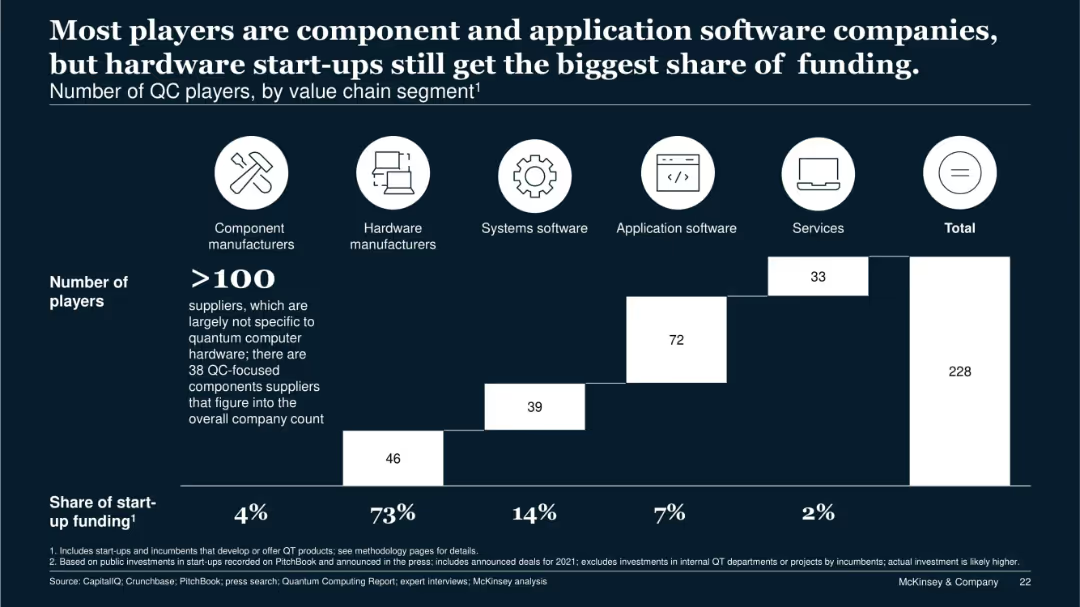
Stacked bar chart segmented by company type; icons for categories above the chart; funding share noted below.
Competitive Landscape
Technology & Software
This slide segments 228 quantum computing companies by value chain role. Although hardware manufacturers represent only a fraction of players, they receive 73% of total startup funding. It illustrates market imbalance and the dominant capital flow toward hardware.
value chain, QC players, startup funding, hardware, components, services
false
Most players are component and application software companies, but hardware start-ups still get the biggest share of funding.Quantum Technology Monitor June 2022
Single Chart
McKinsey
View slide
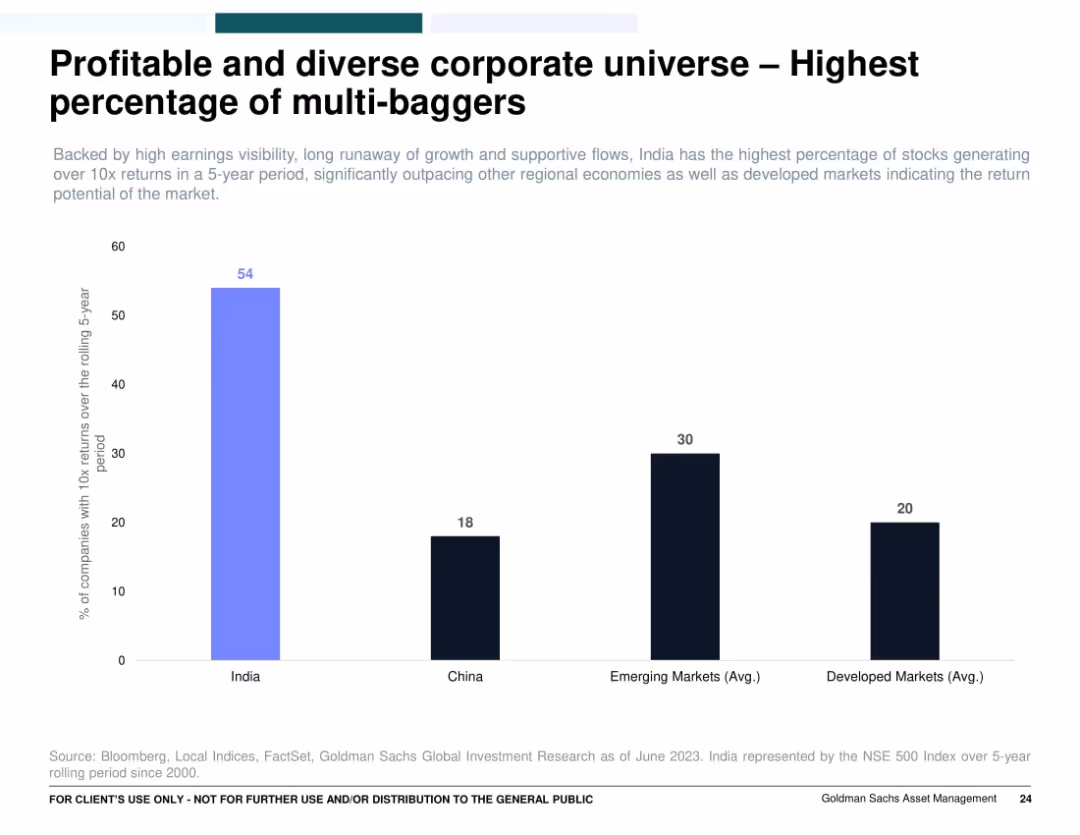
Single bar chart comparing the percentage of companies delivering 10x returns across countries/regions (India, China, EM, DM); clean layout with color-coded bars.
Investment Analysis
Financial Services
Emphasizes that India has the highest percentage of companies with 10x returns over a rolling 5-year period, far outpacing China, emerging markets, and developed markets. It highlights India’s market potential and wealth creation opportunity through multi-bagger investments.
multi-baggers, India equities, stock returns, investment opportunity, wealth generation, 10x returns
false
Profitable and diverse corporate universe – Highest percentage of multi-baggersIndien: Probleme und Chancen auf dem Subkontinent
Single Chart
Goldman Sachs
View slide
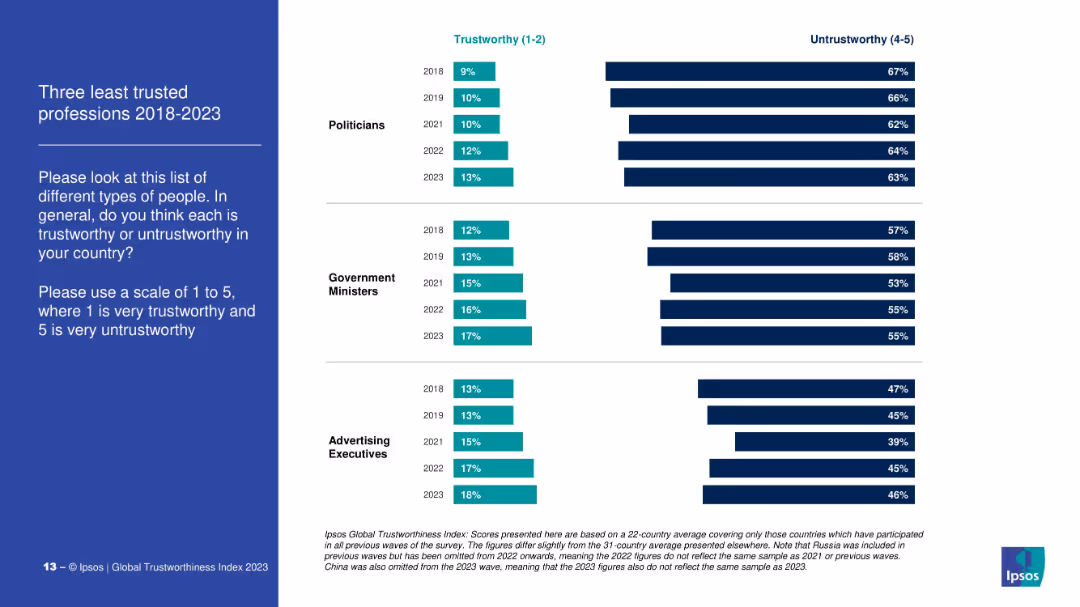
Dual bar chart comparing % of people who consider three professions (politicians, gov’t ministers, ad execs) trustworthy vs. untrustworthy from 2018 to 2023.
Market Analysis and Trends
Government & Public Sector
This slide examines public perception of the least trusted professions, contrasting the proportion of people rating them as trustworthy (1–2) and untrustworthy (4–5). Politicians are consistently ranked the lowest across all years.
distrust, politicians, government, advertising, perception, Ipsos, trust ranking, public opinion
false
Three least trusted professions 2018–2023IPSOS GLOBAL TRUSTWORTHINESS INDEX 2023
Mixed Chart
IPSOS
View slide
A data-rich slide with multiple bar graphs representing regional economic impacts. The slide is text-heavy with key statistics highlighted.
Technology and Digital Transformation
Government & Public Sector
Focuses on the economic contribution of the Tempest programme to various UK regions, presenting data and graphs on regional impact and productivity.
Tempest, economic contribution, UK, regions, impact, productivity, data
false
The Tempest programmes’ economic contribution is expected to benefit UK regions which are most in needAssessment of the expected economic impact of the Tempest Programme (2021-2050)
Multiple Chart
PwC/Strategy&
View slide
A split-view slide with two sets of column charts. The left chart in blue shows quarterly revenue in euros for five quarters, while the right green chart tracks the order book value for the same periods. A high-contrast footer with the event name and date grounds the slide. In the top-right corner, an image of an office environment with people provides a real-world connection to the data presented.
Financial Performance
Real Estate & Construction
Illustrates the company's order book growth across all businesses, providing a snapshot of revenue and orders, which is pertinent for stakeholders during financial updates or company meetings.
order book, business growth, revenue, financial analysis, quarterly data, real estate, construction, performance review
false
Order book grew in all businessesGoldman Sachs Symposium presentation
Multiple Chart
Goldman Sachs
View slide
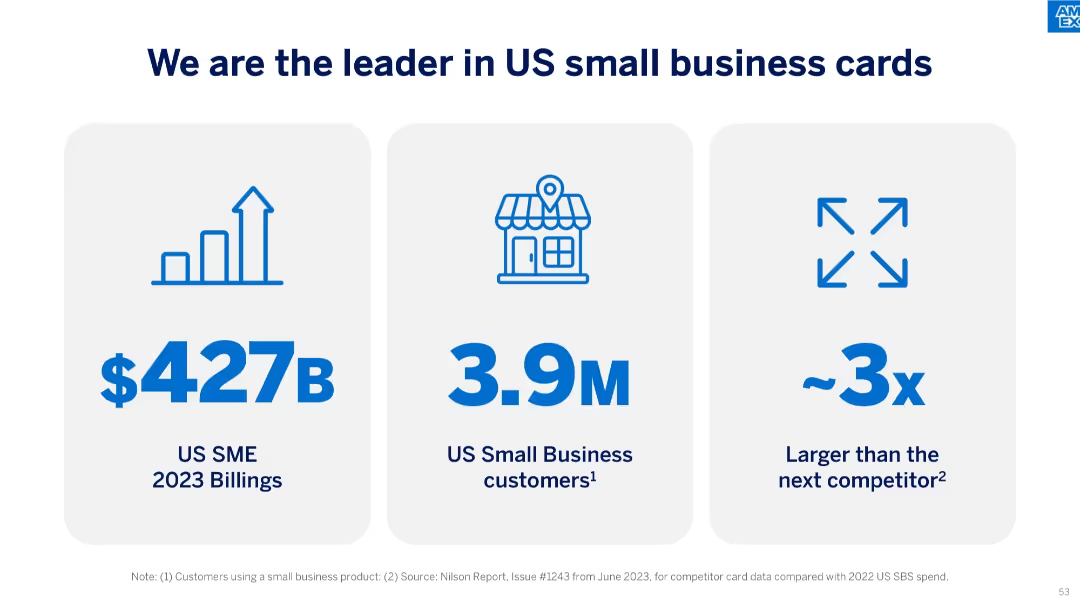
A 3-column layout using icons and large text, showing 2023 US SME billings, customer count, and scale vs. competition.
Strategic Planning
Financial Services
This slide emphasizes American Express’ leadership in the small business card sector, highlighting $427B in 2023 billings, 3.9M customers, and being roughly three times larger than the next competitor.
leadership, SME, billings, customer base, scale advantage, US market, credit cards, strategic positioning
false
We are the leader in US small business cardsAmerican Express Investor Day 2024
Pillar
McKinsey
View slide
Column chart showing other actions taken to manage lower income during the COVID-19 pandemic, comparing May 2020 and December 2020 data.
Financial Performance
Financial Services
Discusses additional measures households took to cope with lower income during the pandemic, such as food banks and grants.
lower income, financial management, food banks, COVID-19, household actions
false
Other actions taken to manage with a lower incomeThe Impact of COVID-19 on wellbeing in Scotland: Ipsos MORI report
Single Chart
IPSOS
View slide
The slide contains a line chart on the left showing the global PMI for manufacturing and services from 2007 to 2023. On the right, there is a heatmap displaying the global PMI for manufacturing by country (U.S., Japan, Australia, Eurozone, China, etc.) from April 2023 to March 2024.
Market Analysis and Trends
Industrial & Manufacturing
The slide provides a detailed view of global manufacturing performance through PMI indices, offering insights into the health of the manufacturing sector across different countries.
PMI, Manufacturing, Global, Services, Heatmap
false
Global PMI for manufacturing and services IndexGuide to the Markets Australia | 2Q 2024
Mixed Chart
JP Morgan
View slide
Showcases examples of impact created by space technology across industries, using visuals and case study summaries.
Client Case Studies
Technology & Software
Offers concrete case studies of how space technologies have been applied to produce insights and impact in sectors like agriculture and commodities trading.
space technology, agriculture insights, commodity tracking, satellite analytics, case studies
false
Who has successfully created impact with space technologies slide 1McKinsey Technology Trends Outlook 2022 Future of space technologies
Boxed
McKinsey
View slide
The slide includes a pie chart and text. The chart indicates the offer of mobile applications to clients.
Technology and Digital Transformation
Financial Services
The slide discusses the growing trend of adopting a mobile-first approach to enhance customer engagement in financial services.
Mobile-first, customer engagement, financial services, mobile applications, technology
false
Offence is the best defenceBlurred lines: How FinTech is shaping Financial Services
Mixed Chart
PwC/Strategy&
View slide
Simple design with two columns comparing 'Secular Forces' on the left to their 'Impact' on the right, minimal graphical elements.
Strategic Planning
Financial Services
Slide presenting strategic business changes and their implications, likely aimed at stakeholders for discussing future plans.
Secular Forces, Impact, Strategy, Business, Future
false
Evolving Our Business For the FutureGoldman Sachs Investor Day
Table
Goldman Sachs
View slide
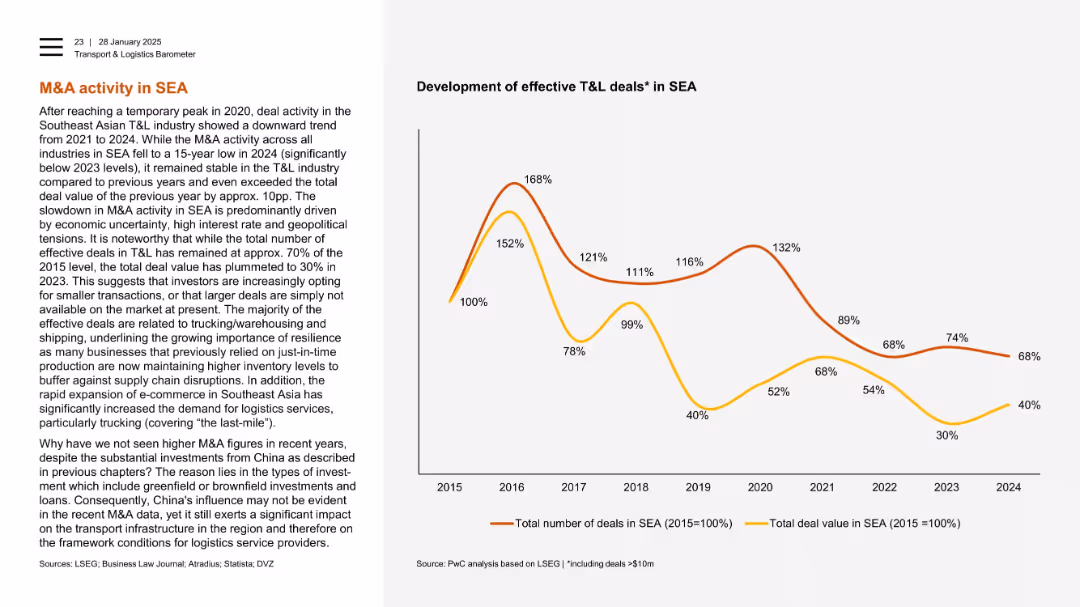
Left panel with explanation, right with dual-line chart showing relative M&A deal trends (2015–2024).
Mergers and Acquisitions
Transportation & Logistics
Despite a long-term decline in M&A activity in Southeast Asia, total deal value in 2024 exceeded 2023 levels. The slide points to investor caution and focus on smaller freight/logistics deals amid geopolitical risks. It also notes the indirect impact of Chinese investment.
Southeast Asia, M&A, logistics, deal value, freight, shipping, economic uncertainty, China
false
M&A activity in SEATransport & Logistics Barometer
Mixed Chart
PwC/Strategy&
View slide
Multiple graphs including a column chart for net revenue performance, and line charts for spreads, unemployment, and household debt.
Financial Performance
Financial Services
This slide showcases SP’s revenue diversification and stable performance through various economic cycles, highlighting key financial metrics.
Revenue diversification, performance, economic cycles, financial metrics, net revenue
false
SP’s revenue diversification coupled with flexible capital allocation results in stable performance through the cycleCredit Suisse Investor Day 2018 Managing our business through the cycle
Multiple Chart
Credit Suisse
View slide
The slide contains text on the left side and two doughnut charts on the right. The text discusses effective targeting strategies, and the charts compare 'All Entrants' and 'All Winners' with respect to having a primary target.
Strategic Planning
Media & Entertainment
This slide explains the effectiveness of mass and targeted strategies in driving brand growth, comparing the presence of a primary target between all entrants and winners.
targeting strategies, mass, targeted, primary target, brand growth
false
Mass and Targeted can both be Effective Strategies2020 Effie UK Report • In partnership withIpsos
Multiple Chart
IPSOS
View slide
The slide contains several rectangular callout boxes with icons, a column chart, and text descriptions. It uses a blue and white color palette and has a balanced distribution of visuals and text.
Strategic Planning
Financial Services
Outlines a strategic plan for a wealth franchise, detailing service offerings like full-service, remote advice, and self-directed investing. It serves to illustrate the comprehensive approach to client service across multiple channels, aimed at capturing a larger share of the investment wallet.
Wealth franchise, Strategic plan, Service offerings, Investment, Channels
false
Looking ahead, we are creating a wealth franchise to best serve clients across all channelsConsumer & Community Banking
Mixed Chart
JP Morgan
View slide
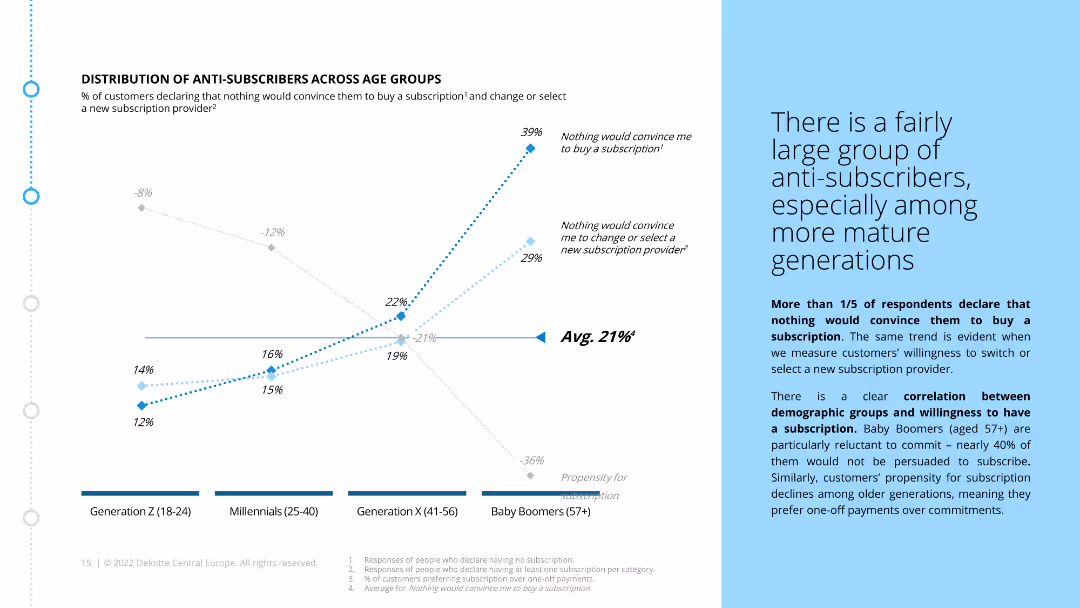
The slide includes a line chart that shows the percentage of anti-subscribers across different age groups. It also contains a text box explaining the correlation between age and subscription reluctance.
Market Analysis and Trends
Consumer Goods
The slide highlights the demographic distribution of customers who are reluctant to subscribe, particularly among older generations. It shows a clear correlation between age and subscription resistance.
anti-subscribers, age groups, market segmentation, customer demographics, subscription reluctance, generational differences, ecommerce, retail
false
DISTRIBUTION OF ANTI SUBSCRIBERS ACROSS AGE GROUPSDemystifying the hype of subscription
Mixed Chart
Deloitte
1
...
Next
Load More
Hold On!
We are searching in our database
If nothing, comes up, please try different filters!
Create a FREE account to continue browsing
Receive Instant Access to 1,000+ slides from companies like McKinsey, Google, and Goldman Sachs
First Name
Last Name
Email
Password
I agree to all
Terms & Privacy Policy
Thank you! Your submission has been received!
Oops! Something went wrong while submitting the form.
Have an account?
Sign in
Column Chart
Heatmap
Chevron
Org Chart
Infographic
Callouts
Timeline
List
Graphic
Picture
Process Flow
Diagram
Paragraph
Map
Table
Framework
Subtitle
Takeaway Box
Icon
Other Chart
Radar Chart
Waterfall Chart
Mekko Chart
Pie Chart
Scatter Plot
Line Chart
Bar chart
Bullet points


![Material flows of aluminium cans, 2020-21 [b units2)3), (% of total POM volume)]](https://cdn.prod.website-files.com/654e70fb59937215cac87b19/689997460727c755a84b1b56_l0hZ3kB9Q_LwuRdExYq8z5mX-iOzLyBOemY7QuSpKTk.avif)