My Account
My Slides
Search by Category
Templates
View All Templates
Download Template Slides
Leave Feedback
Login
Logout
Get Started
Browse all Slides
Browse all Slides
Create a FREE Account
Instant access to 1,000+ real slides from top companies like McKinsey, BCG, Goldman Sachs, Google and many more!
First Name
Last Name
Email
Password
I agree to all
Terms & Privacy Policy
Thank you! Your submission has been received!
Oops! Something went wrong while submitting the form.
Have an account?
Sign in
Instant access to the internet's best slides
Get access to 40+ advanced filters and more
Advanced Search and Filters
Access to
10,000+ slides
Access to Category Pages
Save/Bookmark Slides
PowerPoint Template Library (New)
Choose your plan
MONTHLY
$12/month
Billed every month, cancel anytime.
YEARLY
$9/month
Billed $108 annually, cancel anytime.
Checkout for $12/month
Checkout for $108/yr
Secured by Stripe | AES-256 bit encryption
Spark Your Next Big Idea with New Presentation Templates
VIEW ALL Templates
Welcome,
Welcome
Upgrade to SlideStart
Pro
Instant access to 15,000+ slides
Show Featured Only
Checkbox 8
Companies
Mckinsey
Bain
BCG
EY
Deloitte
Accenture
PwC/Strategy&
JP Morgan
Goldman Sachs
Morgan Stanley
Citigroup
Deutsche Bank
Barclays
LEK
Kearney
Oliver Wyman
Booz Allen Hamilton
Gartner
IPSOS
Nielsen
Slide type
Header Horizontal
Framework
Vertical Flow
Single Chart
Single Chart
Text Only
Mixed Chart
Header Vertical
Graphic
Pillar
Multiple Chart
Agenda
Title
Table
Linear Flow
Upgrade to SlideStart
Pro
Instant access to 40+ advanced filters
Industry
Upgrade to SlideStart
Pro
Instant access to 40+ advanced filters
Technology
Healthcare
Financial Services
Consumer Goods
Energy & Utilities
Manufacturing
Retail
E-commerce
Logistics
Telecommunications
Real Estate
Professional Services
Education
Media
Entertainment
Hospitatlity
Tourism
Agriculture
Food Production
Government & Public Sector
Environmental
Sustainability
Use Case
Upgrade to SlideStart
Pro
Instant access to 40+ advanced filters
Sales and Business Development
Mergers and Acquisitions
Corporate Finance and Valuation
Performance Metrics and KPIs
Client Case Studies
Competitive Landscape
Product and Service Analysis
Customer and Market Segmentation
Organizational Structure
Human Resources and Talent Management
Industry Overview
Regulatory and Compliance
Risk Assessment and Management
Agriculture & Food Production
Hospitality and Tourism
Government
Environmental
Sustainability
Clear all
Thank you! Your submission has been received!
Oops! Something went wrong while submitting the form.
Show Featured Only
Checkbox 8
Companies
Mckinsey
Bain
BCG
EY
Deloitte
Accenture
PwC/Strategy&
JP Morgan
Goldman Sachs
Morgan Stanley
Citigroup
Deutsche Bank
Barclays
LEK
Kearney
Oliver Wyman
Booz Allen Hamilton
Gartner
IPSOS
Nielsen
Slide type
Text Only
Linear Flow
Vertical Flow
Single Chart
Header Horizontal
Mixed Chart
Header Vertical
Pillar
Multiple Chart
Graphic
Agenda
Title
Table
Framework
Industry
Technology
Healthcare
Financial Services
Consumer Goods
Energy & Utilities
Manufacturing
Retail
E-commerce
Logistics
Telecommunications
Real Estate
Professional Services
Education
Media
Entertainment
Hospitatlity
Tourism
Agriculture
Food Production
Government & Public Sector
Environmental
Sustainability
Use Case
Sales and Business Development
Mergers and Acquisitions
Corporate Finance and Valuation
Performance Metrics and KPIs
Client Case Studies
Competitive Landscape
Product and Service Analysis
Customer and Market Segmentation
Organizational Structure
Human Resources and Talent Management
Industry Overview
Regulatory and Compliance
Risk Assessment and Management
Agriculture & Food Production
Hospitality and Tourism
Government
Environmental
Sustainability
Clear all
Thank you! Your submission has been received!
Oops! Something went wrong while submitting the form.
Tag
View slide
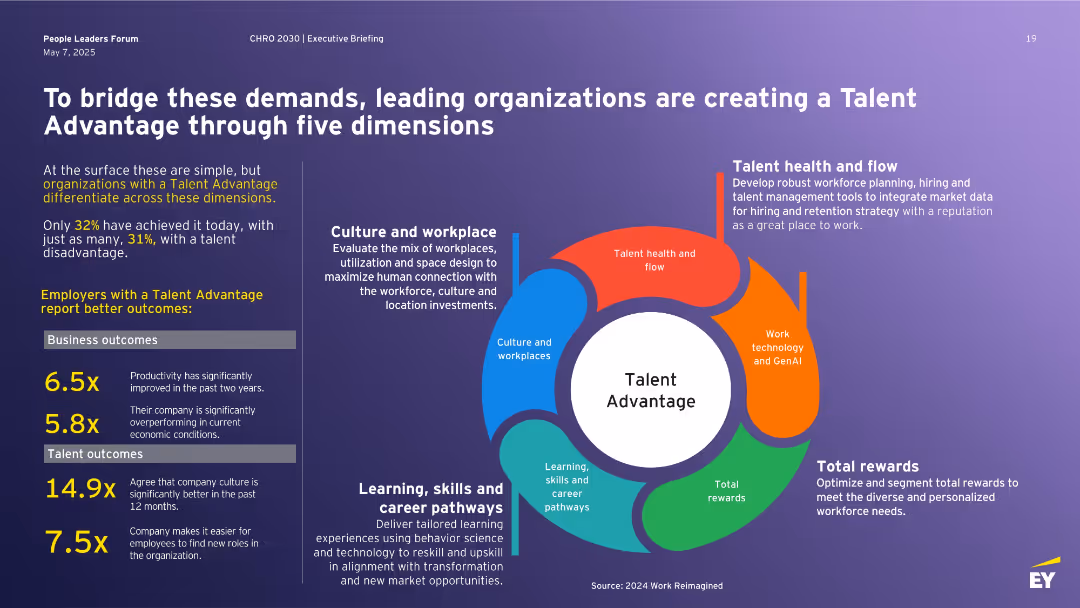
Left block of stats and outcomes; right side features a circular infographic with five dimensions of Talent Advantage: culture, learning, rewards, health, and tech.
Human Resources and Talent Management
Professional Services
Describes how leading companies build a Talent Advantage across five dimensions to address workforce challenges. Includes stats on performance outcomes for talent-advantaged firms and emphasizes the strategic value of culture, learning pathways, reward systems, technology, and workforce planning to stay competitive.
Talent Advantage, workforce strategy, learning, rewards, culture, technology, retention
false
To bridge these demands, leading organizations are creating a Talent Advantage through five dimensionsPeople Leaders Forum
Vertical Flow
EY
View slide
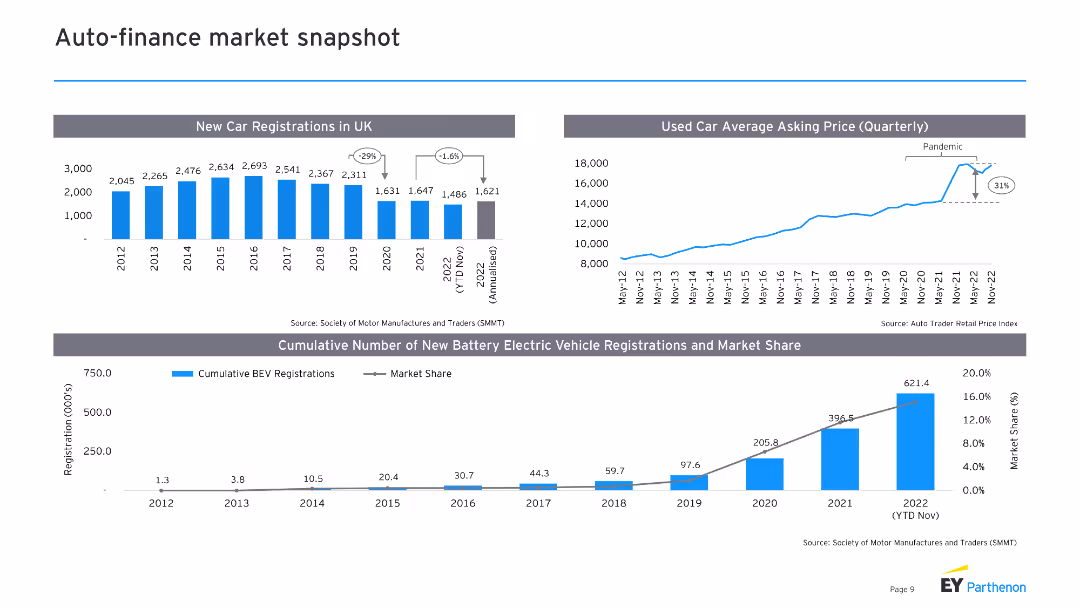
The slide features two column charts and one line chart, depicting new car registrations in the UK, used car average asking prices, and cumulative BEV registrations and market share.
Market Analysis and Trends
Financial Services
This slide analyzes the auto-finance market, presenting data on new and used car markets and electric vehicle trends, helpful for understanding market dynamics.
auto-finance, car registrations, used cars, BEV, market share
false
Auto finance market snapshotMonthly Market Insights Banking, Speciality Finance and Capital Markets
Multiple Chart
EY
View slide
This slide contains multiple bar charts and textual content. There are three bar charts arranged horizontally, comparing Australia, US, and Indonesia in terms of production costs for lithium. The bar charts are divided into categories like Feedstock, Conversion Costs, Capex, and Tax. Each country's chart is distinguished by a different color and there are annotations and percentage changes highlighted.
Competitive Landscape
Energy & Utilities
The slide details the competitive advantages in production costs for lithium hydroxide in Australia compared to the US and Indonesia, emphasizing Australia's lower costs due to integration of mining and refining activities.
Australia, lithium, refining, cost comparison, mineral reserves, production costs, competitive advantage, integration benefits, global market
false
Australia can leverage its critical mineral reserves to vertically integrate upstream, allowing Australian lithium refining to be globally cost competitiveCharging Ahead Australia’s battery powered future
Multiple Chart
Accenture
View slide
Slide displays a mekko chart detailing the value of deals in Singapore by key themes with annotations about top themes by investment types, deal example, and active investors.
Investment Analysis
Energy & Utilities
Analyzes the growth of green investments in Singapore, focusing on sectors like solar energy and alternative proteins. It includes a notable deal example involving Sunseap and EDP Renewables and lists key investors like Temasek and K3 Ventures.
green investment, Singapore, solar, Temasek, Sunseap
false
Green investments continue to grow across asset categories, with alternative proteins gaining spotlightSoutheast Asia’s Green Economy 2022 Report
Mixed Chart
Bain
View slide
The slide features three separate columns titled "Revenue Growth," "Efficiency Measures," and "Capital Efficiency," each containing bullet points and percentage values. The design includes blue and white color themes with horizontal arrangement and clear section separators.
Financial Performance
Financial Services
This slide presents Deutsche Bank's Q3 2023 progress in revenue growth, efficiency measures, and capital efficiency targets, highlighting specific achievements and future goals.
revenue growth, efficiency, capital, target, banking
false
Continued accelerated execution with material progress on capital efficiencyQ3 2023 results
Table
Deutsche Bank
View slide
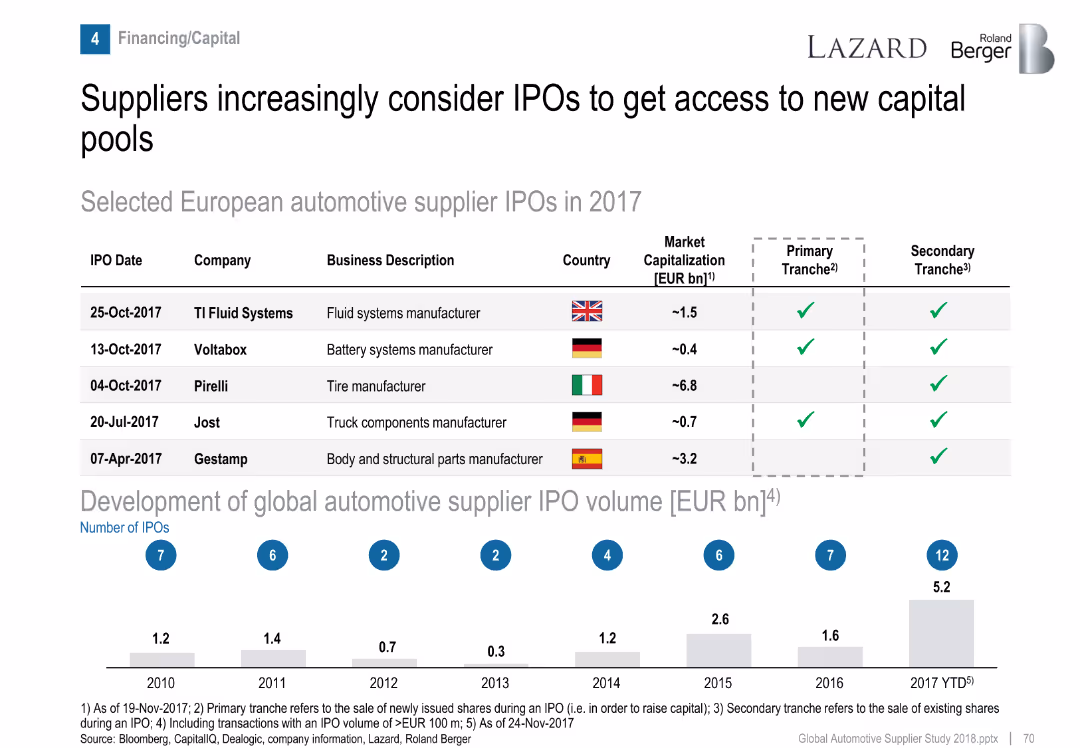
Table of IPOs and bar graph of historical IPO volumes.
Corporate Finance and Valuation
Industrial & Manufacturing
Highlights five European automotive supplier IPOs in 2017 and presents a trend in global IPO volume growth, indicating increased interest in capital markets by suppliers.
IPO, automotive suppliers, capital access, financing, market trends
false
Suppliers increasingly consider IPOs to get access to new capital poolsThe overall positive sentiment was also reflected in the supplier valuation levels that still trade above their long-term average
Mixed Chart
Roland Berger
View slide
Depicts column charts with percentages showing purchase cancellations by income level in various regions.
Market Analysis and Trends
Transportation & Logistics
Studies the impact of income on the likelihood of maintaining or cancelling car purchase plans during the pandemic.
income effect, purchase decisions, market behavior
false
Across markets, higher-income households seem less likely to revise their initial purchase intentCOVID-19 Auto & Mobility Consumer Insights
Multiple Chart
McKinsey
View slide
Detailed bullet points with strategic advice on channel exploration, accompanied by colorful icons and case study examples.
Strategic Planning
Retail & E-commerce
Provides guidance on the exploration of new channels, emphasizing the importance of value understanding and experimentation for growth.
New Channels, Experimentation, Value Drivers, Strategy, Market Opportunities
false
Don’t be shy about exploring new channels – understand value drivers, focus on experimentation and big opportunitiesBCG Executive Perspectives: The Future of Sales and Marketing is Here
Graphic
BCG
View slide
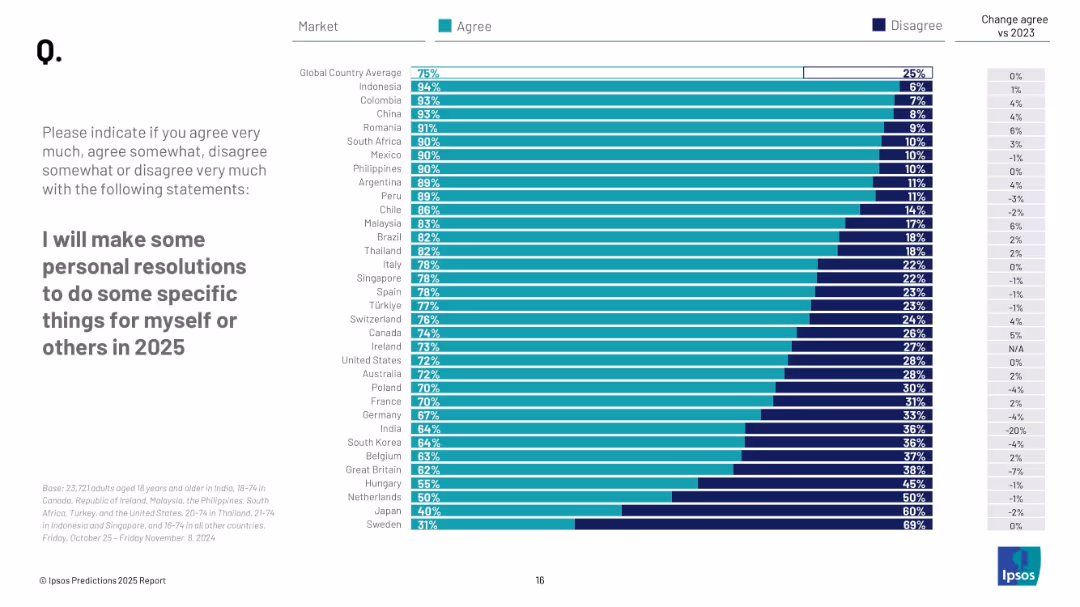
Ranked bar chart of country responses; shows % agree, % disagree, and change from 2023.
Human Resources and Talent Management
Professional Services
The slide highlights intent to make personal resolutions in 2025, with countries like Indonesia (94%) and Colombia (93%) showing strong agreement. Global average is 75%. Sweden ranks lowest at 31%, reflecting wide cultural differences in resolution-setting.
personal goals, behavior change, public resolution, 2025 plans, Ipsos survey, global comparison
false
I will make some personal resolutions to do some specific things for myself or others in 2025PREDICTIONS 2025 REPORT
Mixed Chart
IPSOS
View slide
Horizontal stacked bar chart comparing country-level agreement rates. Text box summarizes key insight with visual on the right.
Regulatory and Compliance
Environmental Services & Sustainability
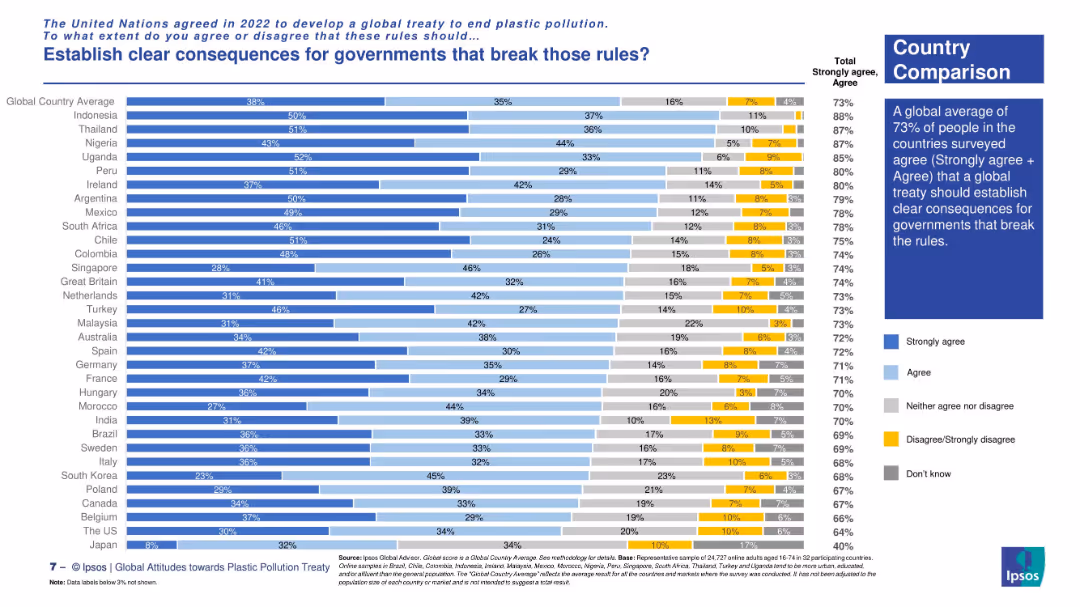
The slide presents country-by-country agreement levels on establishing consequences for rule-breaking governments under a global plastic treaty. Highest support is seen in Indonesia, Uganda, and Thailand, with a 73% global average.
international treaty, plastic rules, accountability, country comparison, environmental regulation, Ipsos survey, global consensus, compliance
false
Establish clear consequences for governments that break those rules?Attitudes towards a global plastic pollution treaty
Mixed Chart
IPSOS
View slide
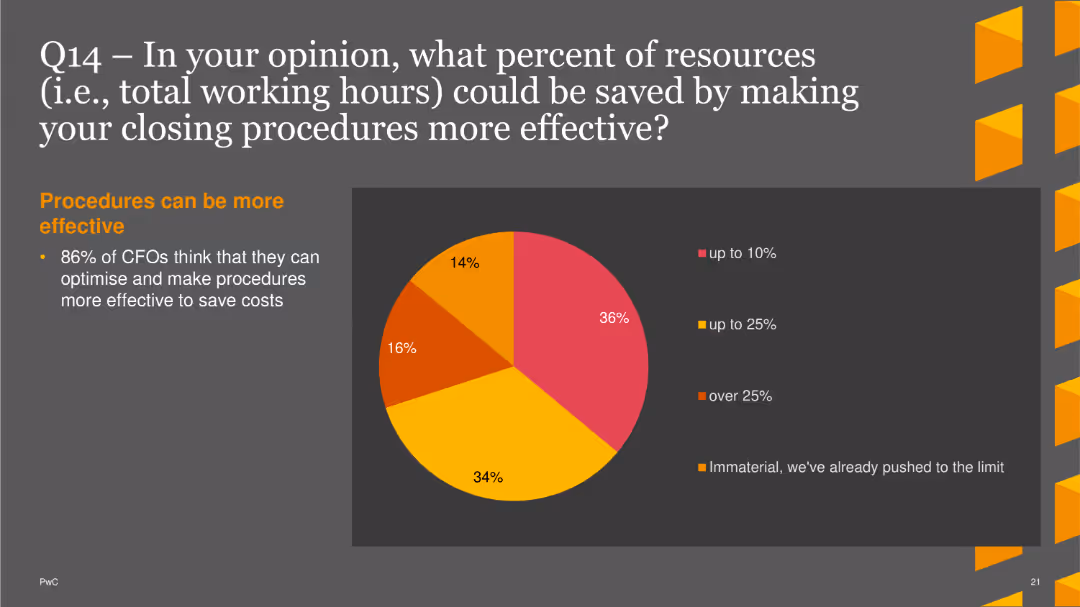
Four pie charts showing the current percentage of time spent on different tasks. Each chart is labeled with a task and its corresponding percentage
Operational Efficiency
Financial Services
This slide asks about current time allocation for tasks like data processing, analysis, forecasting, and decision-making within finance departments.
time allocation, data processing, analysis, forecasting, decision-making
false
Q14 – In your opinion, what percent of resources (i.e., total working hours) could be saved by making your closing procedures more effective?PwC CFO Insights Survey 2022
Single Chart
PwC/Strategy&
View slide
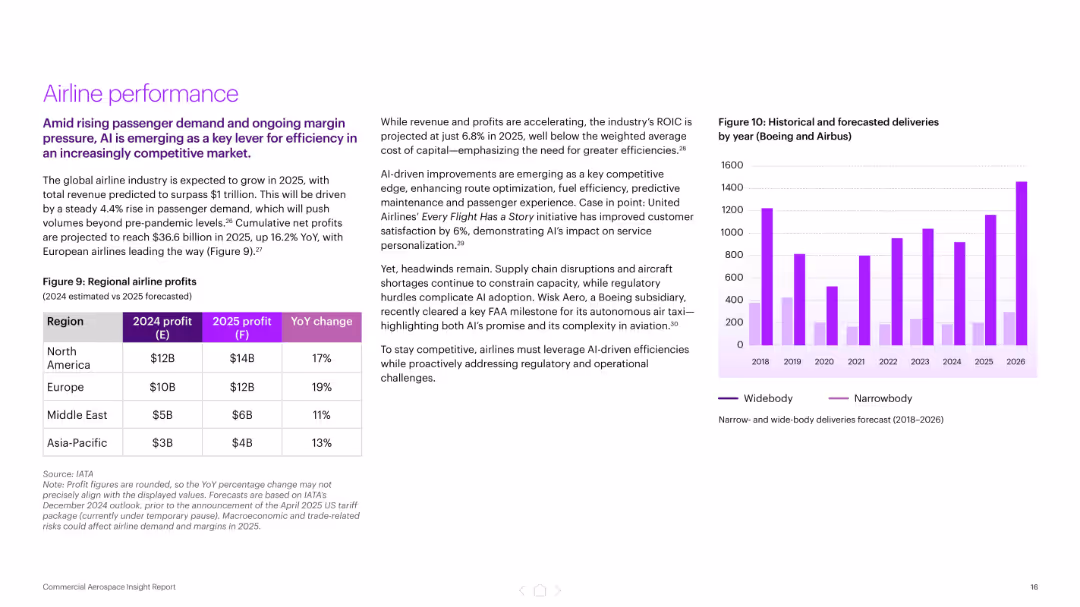
Split layout with left-side text and table showing regional airline profits, right side includes a bar chart of aircraft deliveries by type (2018–2026). Purple color palette.
Financial Performance
Industrial & Manufacturing
Highlights projected industry growth to $1 trillion by 2025, led by rising passenger demand and AI-driven efficiencies. Includes regional airline profit forecasts and delivery trends by aircraft type. AI’s role in improving customer satisfaction and cost efficiency is emphasized.
airline profits, AI, aerospace, passenger demand, aircraft deliveries, United Airlines, predictive maintenance, financial performance
false
Airline performanceNavigating uncertain skies Commercial Aerospace Insight Report
Mixed Chart
Accenture
View slide
Bar chart showing market growth strategies on the left and market optimization strategies on the right.
Strategic Planning
Financial Services
Describes strategies for optimizing market footprint and focusing investments on high-priority markets.
market optimization, investment, strategy, priority markets, growth
false
Continue to optimize footprint and focus investment on priority marketsInvestor Deep Dive 2022
Mixed Chart
Credit Suisse
View slide
Slide includes financial results tables and a column chart showing net revenues from FICC and equities. The layout is data-heavy with a clear distinction between the segments. Blue and grey bars represent the different revenue streams.
Market Analysis and Trends
Financial Services
Analyzes the financial results in global markets, presenting year-over-year and year-to-date comparisons. Useful for evaluating market trends, and understanding performance in FICC and equities for strategic decision-making.
Global Markets, FICC, Equities, Net Revenue
false
Global Markets Financial ResultsSecond Quarter 2022 Earnings Results Presentation
Mixed Chart
Goldman Sachs
View slide
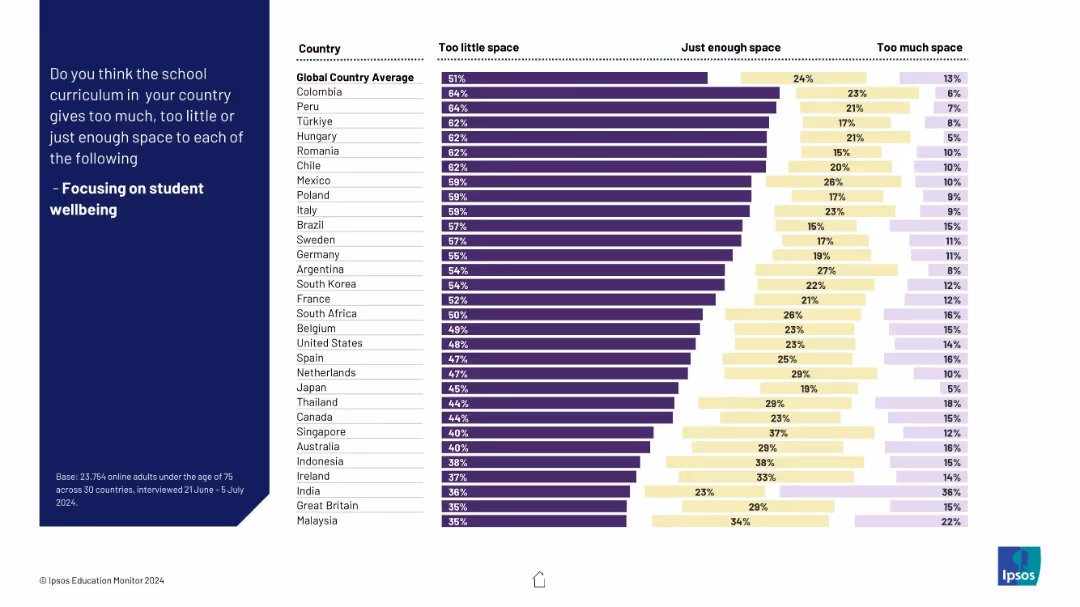
Bar chart comparison by country; vertical layout with three segments: "Too little", "Just enough", "Too much".
Market Analysis and Trends
Education & Training
This slide presents global survey results showing public opinion on how well school curricula focus on student wellbeing. Most countries show high dissatisfaction, indicating that wellbeing receives too little space in education.
education, wellbeing, global survey, school curriculum, student needs, priorities, country comparison, perception, policy, Ipsos
false
Focusing on student wellbeingIPSOS EDUCATION MONITOR 2024
Mixed Chart
IPSOS
View slide
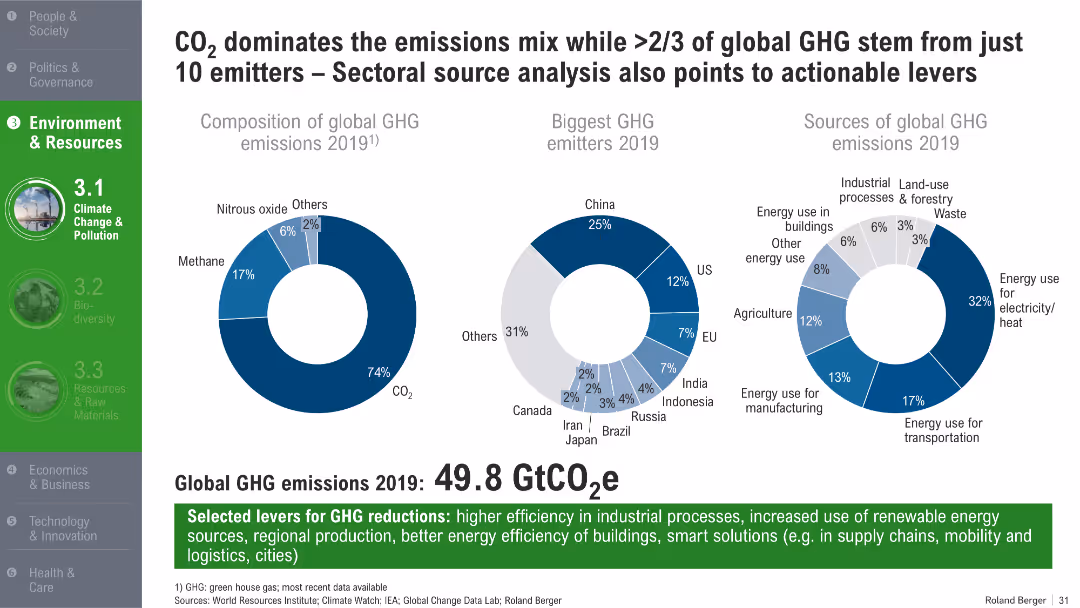
Three pie charts showing GHG composition, emitter countries, and sectoral sources; bold green headers and footnotes
Customer and Market Segmentation
Environmental Services & Sustainability
The slide identifies the dominance of CO₂ in global GHG emissions and highlights that a small group of countries and sectors contribute the most. It presents 2019 data on emission distribution by gas type, country, and economic sector, and suggests potential levers for emissions reduction.
GHG emissions, CO₂, top emitters, energy sectors, 2019 emissions, reduction strategies, industrial efficiency
false
CO2 dominates the emissions mix while >2/3 of global GHG stem from just 10 emitters – Sectoral source analysis also points to actionable leversTrend Compendium 2050 Six megatrends that will shape the world
Mixed Chart
Roland Berger
View slide
Contains a line graph showing trends over time.
Financial Performance
Technology & Software
Shows historical data and future projections on marketing analytics spending, emphasizing its growth within the marketing budget.
Marketing, Analytics, Budget, Trends, Projection, Line Graph, Spending Growth, Future, Historical Data
false
Spending on marketing analytics hits decade long all time high and is predicted to grow by 63% in three yearsThe CMO Survey Marketing in a Post Covid Era
Single Chart
Deloitte
View slide
Displays a balance sheet with vertical column charts of assets and liabilities as of Q4 2023, along with a coverage ratio indicator.
Financial Performance
Financial Services
Presents UBS Group AG's balance sheet for Q4 2023, detailing various asset and liability components and the overall coverage ratio.
UBS, balance sheet, assets, liabilities, coverage ratio, financial, performance, Q4 2023, analysis
false
Balance sheet For the quarter-end 4Q23Fourth quarter 2023 Fixed Income investor presentation
Multiple Chart
UBS
View slide
Text and iconography highlighting top reasons for brand switching by region.
Customer and Market Segmentation
Retail & E-commerce
Details why Southeast Asian consumers switch brands, focusing on value and product quality.
brand choice, consumer insights, value, product quality, retail
false
Southeast Asian consumers switched brands mainly for value and product qualitySoutheast Asia's digital consumers: A new stage of evolution
Boxed
Bain
View slide
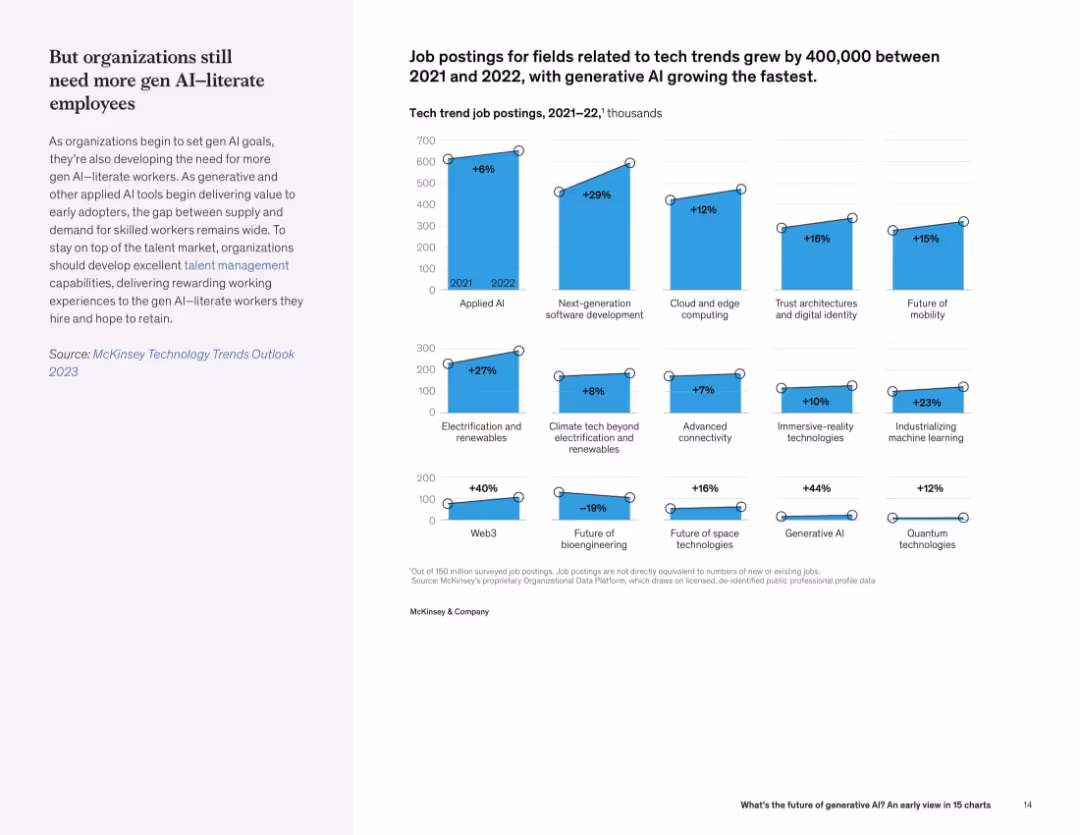
Left-aligned text with a grid of vertical bar charts on the right showing % growth in job postings across various tech fields.
Human Resources and Talent Management
Artificial Intelligence
This slide shows sharp increases in job postings in tech domains, especially for generative AI and Web3. The trend highlights growing demand for AI-literate employees.
tech hiring trends, job growth, generative AI, Web3, talent demand, AI workforce
false
Job postings for elds related to tech trends grew by 400,000 between 2021 and 2022, with generative AI growing the fastestWhat’s the future of generative AI? An early view in 15 charts
Mixed Chart
McKinsey
View slide
Bar chart shows profit before tax and key financial metrics for 1Q20.
Financial Performance
Financial Services
Highlights UBS's financial performance in 1Q20, with significant profit growth and return on CET1.
profit, financial performance, CET1, growth, operating leverage
false
1Q20 net profit USD 1.6bn, +40%; 17.7% RoCET1First quarter 2020 results
Mixed Chart
UBS
View slide
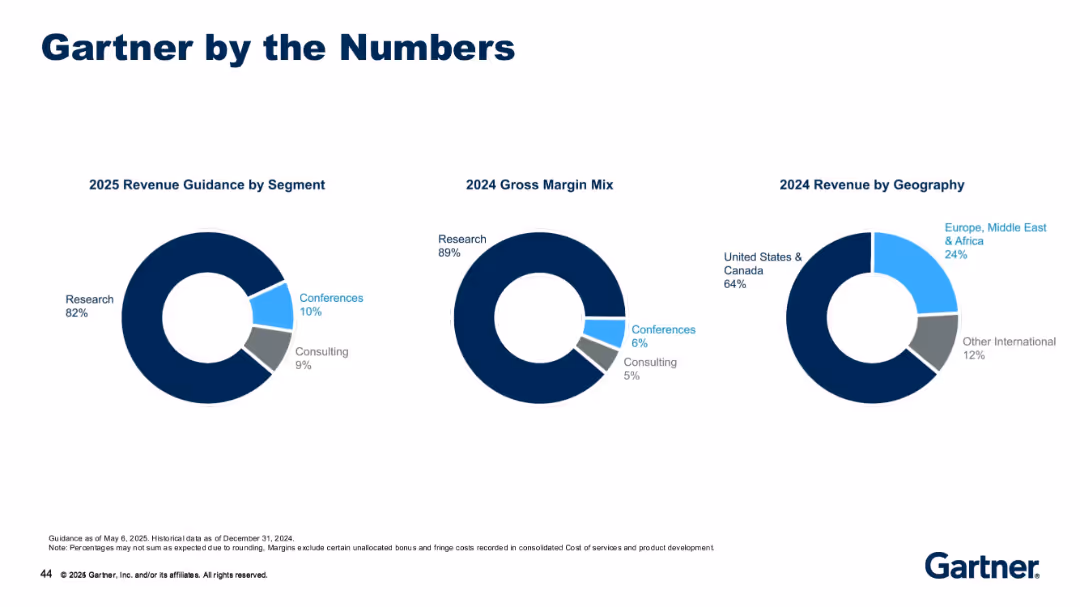
Three donut charts showing revenue by segment (2025), margin mix (2024), and revenue by geography (2024).
Strategic Planning
Technology & Software
This slide provides a high-level financial snapshot, showing the dominance of Research in revenue and margin mix, as well as U.S. and Canada as the major revenue sources. It illustrates Gartner’s business composition by segment/geography.
research, revenue mix, consulting, conferences, gross margin, geography, segment split, 2024, 2025
false
Gartner by the NumbersGartner Introduction 2025
Single Chart
Gartner
View slide
This slide includes a sectioned layout with one side presenting a list of contactless payment advantages, and the other featuring a column chart with statistics on consumer behavior changes during and after the pandemic. Additionally, there's a background image of a person making a payment.
Client Case Studies
Technology & Software
Highlights the shift to contactless payments and consumer adoption rates, offering insights on post-pandemic behavior. The slide could serve as a case study for payment technology impact.
contactless payments, consumer behavior, pandemic impact, payment technology, case study
false
Discover the new payments normalKEEP MOVING FORWARD
Mixed Chart
JP Morgan
View slide
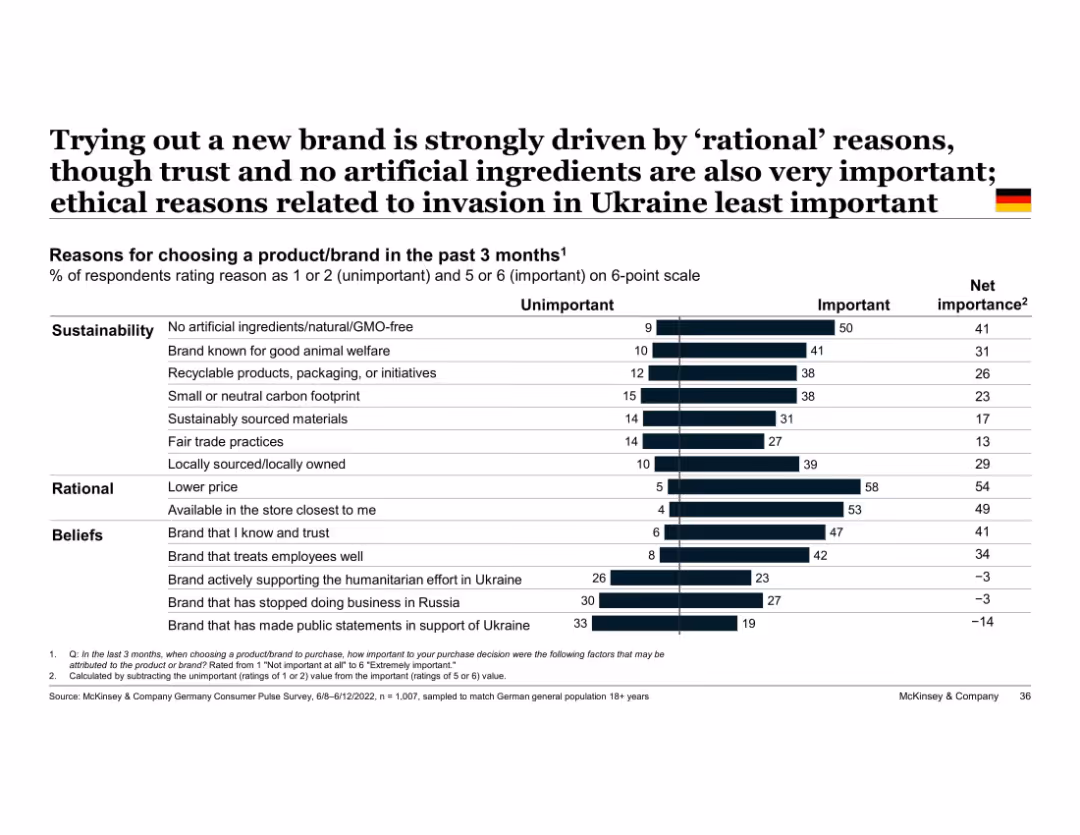
Vertical bar chart with two-part segments (unimportant vs important); grouped by theme (e.g., beliefs)
Market Analysis and Trends
Consumer Goods
Highlights top reasons German consumers tried new brands, with rational factors like price and store availability ranking highest, followed by sustainable and belief-driven factors. Ukraine war-related factors least influential.
rational decision-making, sustainability, trust, Ukraine, brand choice, Germany, ethical purchasing, consumer reasons
false
Trying out a new brand is strongly driven by ‘rational’ reasons, though trust and no artificial ingredients are also very important; ethical reasons related to invasion in Ukraine least importantEuropean Consumer Sentiment Survey: How current events in Europe are shaping consumer behavior
Single Chart
McKinsey
View slide
This slide features horizontal bar charts comparing percentages of agreement and disagreement on various social statements. A table highlights the highest and lowest agreement countries.
Market Analysis and Trends
Government & Public Sector
The slide discusses the belief in "live and let live" across different countries, illustrating tensions and divisions. It also shows where agreement is highest and lowest for these beliefs.
agreement, social beliefs, live and let live, tensions, divisions, countries, percentage, bar chart, highest, lowest
false
While most people believe in ‘live and let live’, it is clear that such an approach can create tensions and divisionsA NEW WORLD DISORDER?
Mixed Chart
IPSOS
View slide
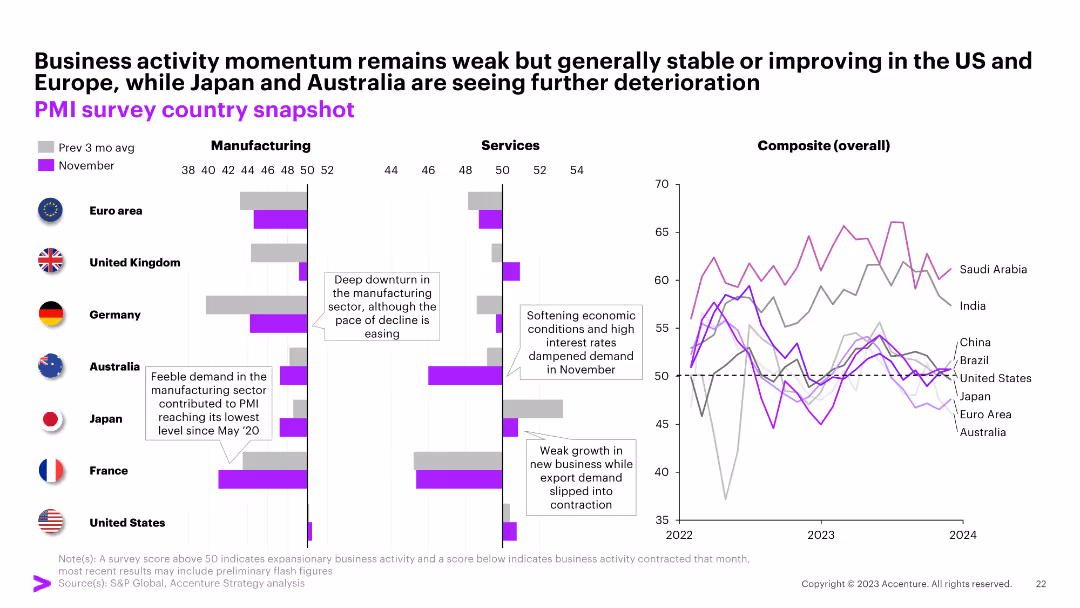
Multiple column charts showing PMI data for manufacturing and services across various countries. Includes a line chart with composite overall PMI data.
Market Analysis and Trends
Financial Services
The slide presents a snapshot of business activity momentum globally, comparing manufacturing and services PMI data across different countries, highlighting economic conditions.
PMI, manufacturing, services, global, economic
false
Business activity momentum remains weak but generally stable or improving in the US and Europe, while Japan and Australia are seeing further deteriorationYear-end Macro Brief Into the Fog of Winter
Multiple Chart
Accenture
View slide
The slide features a detailed case study on the emerging market for bio jet fuels in the US, covering the description, process characteristics, global market overview, and drivers/barriers. It includes a column chart showing aviation energy consumption forecast by fuel type from 2018 to 2040.
Client Case Studies
Transportation & Logistics
This slide provides an in-depth analysis of the bio jet fuel sector in the US, detailing the process steps, market potential, and the benefits and challenges of developing bio jet fuels as a renewable energy source for aviation.
bio jet fuel, US, case study, process description, market overview, drivers, barriers, aviation energy consumption
false
Kearney XX/ID 122 The US is one of the main emerging markets for bio jet fuels but their uptake is still limited by technical and market constraintsDeveloping sustainable carbon circularity Looking at advanced applications and business models
Mixed Chart
Kearney
View slide
A column charts illustrates the historical and projected Liquidity Coverage Ratio (LCR), while a side panel details EOP Available Liquidity Resources. Textual commentary is provided for context and explanation.
Regulatory and Compliance
Financial Services
The slide aims to communicate the bank's adherence to regulatory liquidity requirements, with a breakdown of various components contributing to the LCR. This data is essential for regulatory bodies and financial analysts.
Liquidity Coverage, Regulatory Compliance, LCR, EOP Liquidity, Financial Analysts, Regulatory Requirements
false
2Q23 Liquidity Coverage RatioEarnings Results Presentation Second Quarter 2023
Multiple Chart
Citigroup
View slide
Comprised of bullet-pointed information on green energy investment and icons representing partnerships, this slide details the activities of the Green Investment Group with visual emphasis on key figures.
Regulatory and Compliance
Financial Services
Showcases the scale of green energy investments and partnerships of the Green Investment Group. It emphasizes the group's commitment to the green transition, serving as a reference for sustainability-focused discussions.
Green Energy, Investment, Partnerships, Sustainability, Transition
false
Green Investment GroupMorgan Stanley Virtual Hong Kong Summit
Pillar
Morgan Stanley
View slide
This slide features a column chart illustrating the skills expected to rise in value due to Generative AI adoption. It uses clear color coding to distinguish between human-centered and technology-centered skills.
Human Resources and Talent Management
Professional Services
The slide focuses on the increasing value of certain skills in the AI era, with data analysis, prompt engineering, and creativity among the top skills. It presents survey results with percentages for each skill category.
Generative AI, skills, data analysis, prompt engineering, creativity, technology, human-centered, survey results, workforce, value
false
Skills rising in valueNow decides next: Getting real about Generative AI
Mixed Chart
Deloitte
View slide
The slide is text-heavy, with bullet points across three main columns, labeled 'Transformation', 'Strategic Execution', and 'Culture and Talent.'
Strategic Planning
Financial Services
This slide summarizes key strategic achievements and priorities, offering an overview of organizational changes and performance initiatives, targeting stakeholders who need to understand the company's strategic direction.
strategic, transformation, execution, culture, talent, performance
false
2022 Year in Review Against Our PrioritiesEarnings Results Presentation Fourth Quarter and Full Year 2022
Table
Citigroup
View slide
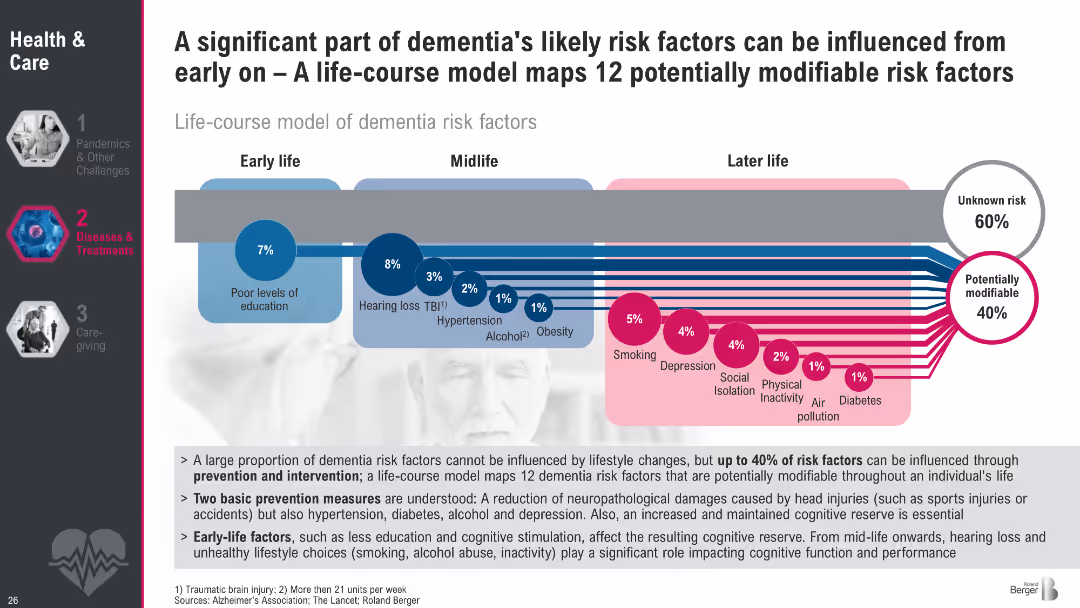
Flowchart mapping modifiable dementia risk factors by life stage; early, mid, and later life
Risk Assessment and Management
Healthcare & Pharmaceuticals
This slide outlines a life-course model showing 12 potentially modifiable risk factors for dementia. It emphasizes early intervention and lifestyle factors like education, smoking, and physical inactivity that influence dementia risk over time.
dementia prevention, risk factors, lifestyle, public health, education, smoking, obesity, hearing loss, cognitive decline, modifiable risks
false
A significant part of dementia's likely risk factors can be influenced from early on A life course model maps 12 potentially modifiable risk factorsMegatrend 2 Health & Care
Multiple Chart
Roland Berger
View slide
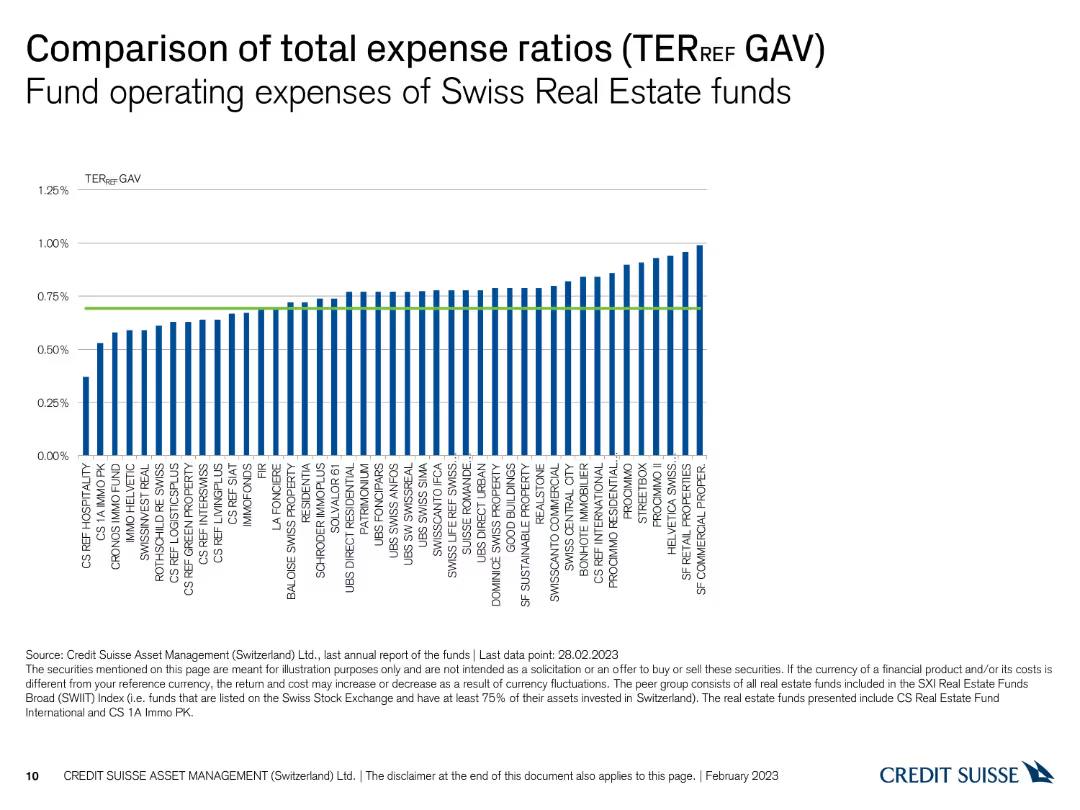
This slide contains a column chart comparing the total expense ratios (TER) of various Swiss real estate funds. The chart has vertical bars representing different funds, with a green horizontal line for reference.
Financial Performance
Real Estate & Construction
The slide shows the fund operating expenses for Swiss real estate funds, helping to analyze cost efficiency across different funds. It is used for evaluating and comparing fund performance.
Real estate, expense ratios, funds, TER, comparison
false
Comparison of total expense ratios (TER REF GAV) Fund operating expenses of Swiss Real Estate fundsSwiss Real Estate Funds At a glance February 2023
Single Chart
Credit Suisse
View slide
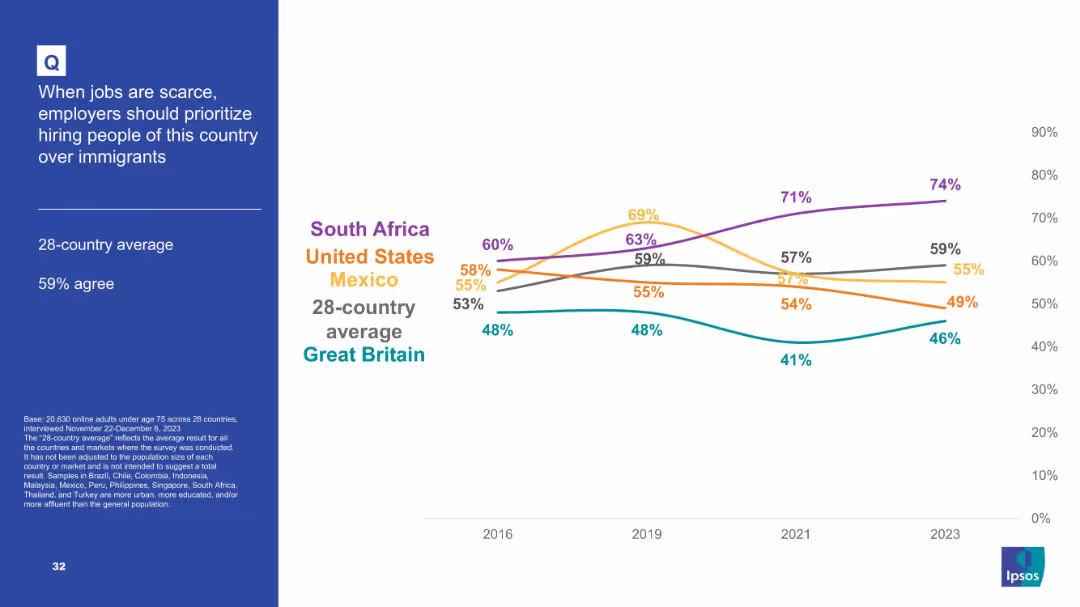
Split layout: left panel with question and stats, right panel features a line chart showing trend data (2016–2023) for selected countries; uses color-coded lines.
Market Analysis and Trends
Government & Public Sector
This slide presents a longitudinal comparison of agreement with the statement that employers should prioritize native citizens over immigrants when jobs are scarce. The line chart tracks sentiment across five countries and a 28-country average from 2016 to 2023, highlighting increasing support in some countries.
immigration, employment, public opinion, trend analysis, labor market, nationalism, Ipsos, 2023 data, country comparison, native preference
false
When jobs are scarce, employers should prioritize hiring people of this country over immigrantsPOPULISM IN 2024
Mixed Chart
IPSOS
View slide
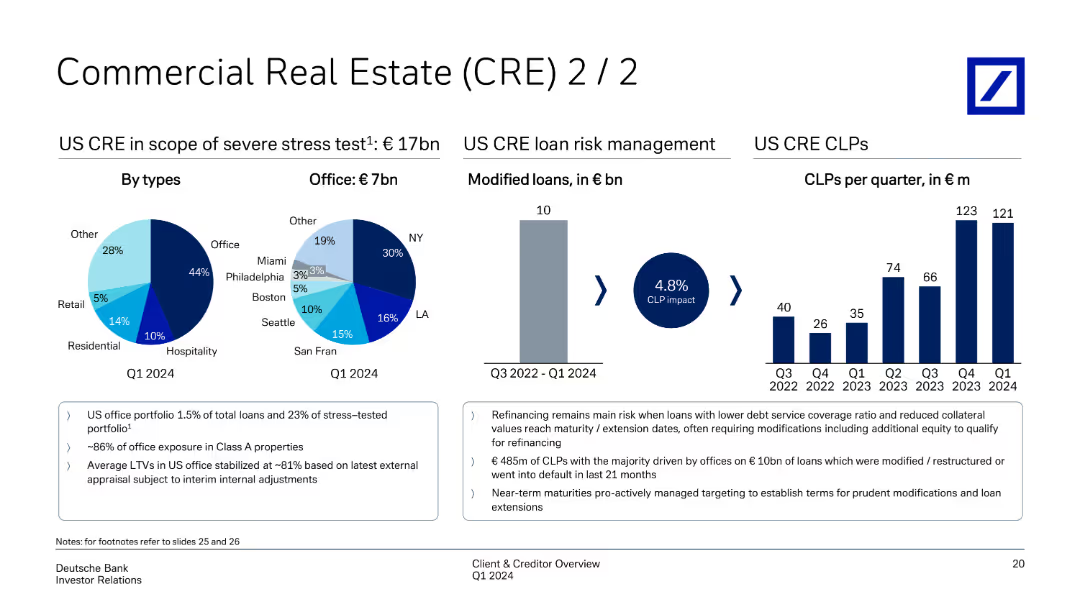
Features pie charts on CRE in severe stress tests, by types, and office distribution. It also shows a bar chart of modified loans and CLPs per quarter, indicating risk management actions.
Risk Assessment and Management
Real Estate & Construction
Explores CRE portfolio under stress scenarios, highlighting types and office distribution. The slide presents modified loans and CLPs, detailing risk management practices to handle potential defaults and refinancing risks within the CRE segment.
CRE, stress test, modified loans, CLPs, risk management
false
Commercial Real Estate (CRE) 2/2Client & Creditor Overview May, 2024
Multiple Chart
Deutsche Bank
View slide
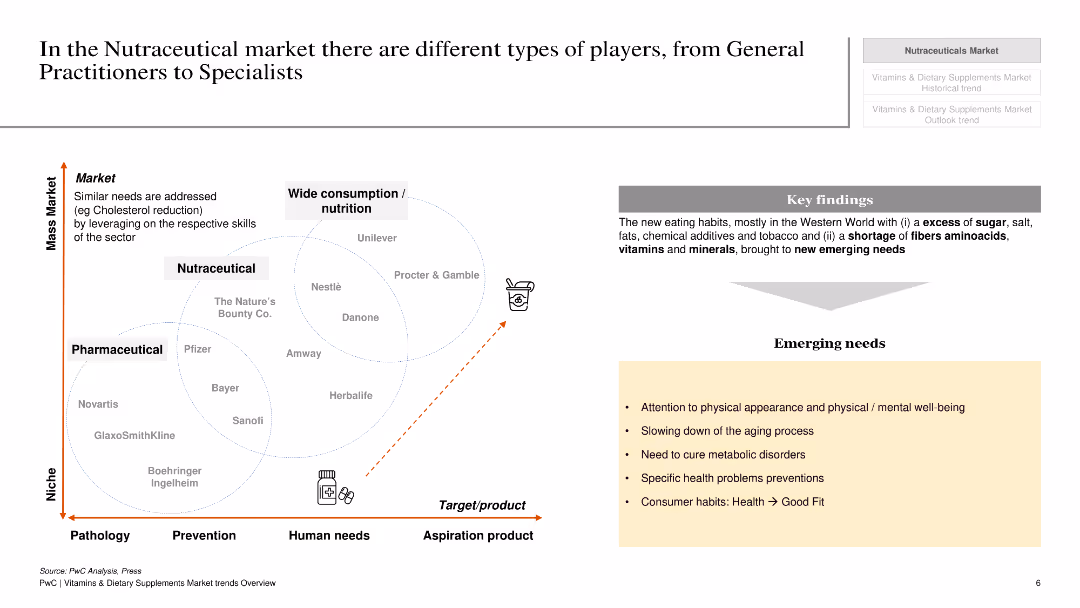
The slide features a white background with a scatter plot showing different players in the nutraceutical market and their respective positions.
Competitive Landscape
Healthcare & Pharmaceuticals
This slide categorizes different types of players in the nutraceutical market, from general practitioners to specialists, and their market strategies and positions.
Nutraceutical, market, players, strategies, positions, healthcare, pharmaceuticals, specialists, general practitioners
false
In the Nutraceutical market there are different types of players, from General Practitioners to SpecialistsVitamins & Dietary Supplements Market trends - Overview
Diagram
PwC/Strategy&
View slide
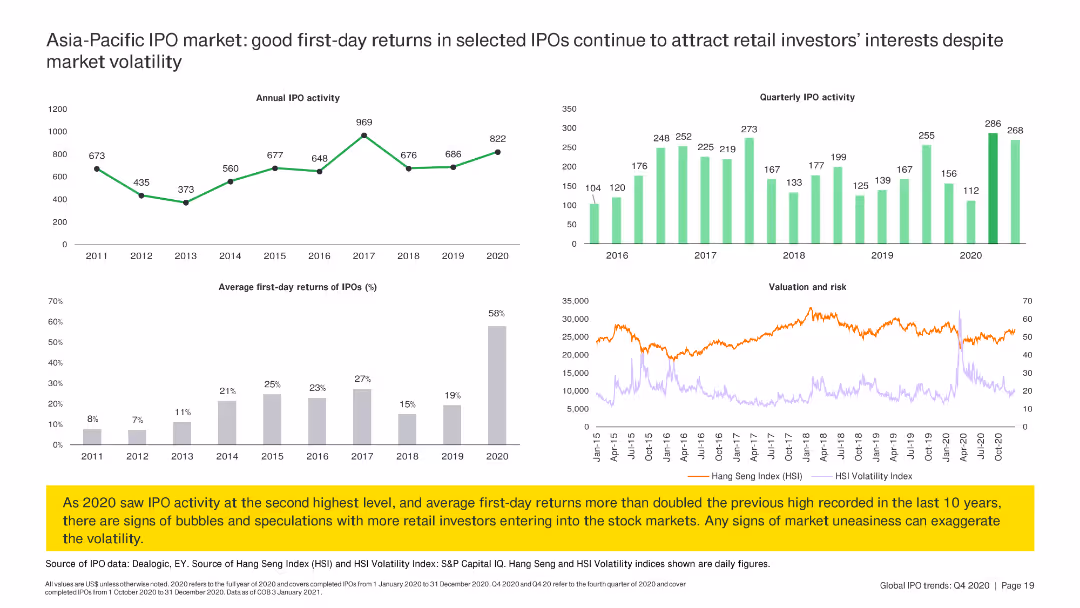
The slide includes line charts and column charts summarizing annual IPO activity, first-day returns, and quarterly IPO activity in the Asia-Pacific region.
Market Analysis and Trends
Financial Services
The slide reviews IPO activity in the Asia-Pacific region, focusing on good first-day returns and quarterly IPO trends, despite market volatility.
IPO, Asia-Pacific, returns, trends, volatility
false
Asia-Pacific IPO market: good first-day returns in selected IPOs continue to attract retail investors’ interests despite market volatilityIs your business model resilient enough to weather any storm?
Multiple Chart
EY
View slide
This slide features six column charts with face icons representing different focus areas of companies. The charts are color-coded in shades of blue.
Industry Overview
Environmental Services & Sustainability
The slide presents statistics on the current focus areas of companies for responsible production. It highlights the emphasis on sustainable materials and solutions within the supply chain.
Sustainability, Production, Focus Areas, Companies, Supply Chain
false
To respond to these challenges companies know they need to collaborate with their suppliers. Not only on production and waste management, but also on the logistics and distribution for a sustainable supply chain.The Future of Food Challenges & opportunities
Single Chart
Deloitte
View slide
Two sections, each with column charts comparing consumer sentiment before, during, after COVID-19. Titled 'Initial surge in cooked Food Deliveries' and 'Thin line between cooked foods and groceries'. Descriptive text on the right side of the slide.
Market Analysis and Trends
Technology & Software
Examines shifts in consumer behavior regarding food delivery services during COVID-19, highlighting the initial surge and subsequent diversification in services. Valuable for e-commerce and food industry analysis regarding consumer trends and market changes.
Food delivery, Consumer behavior, COVID-19, Service diversification, E-commerce
false
Initial surge in cooked Food Deliveries gave way to a wider repertoire of servicese-Conomy SEA 2020 At full velocity: Resilient and racing ahead
Mixed Chart
Bain
View slide
This slide presents pie charts and donut charts detailing equity and lending investments, using colors to distinguish between sectors and asset classes. The information is well-organized, making it visually accessible.
Investment Analysis
Financial Services
The slide illustrates the diversification and categorization of assets in equity and lending investments. It provides a breakdown by industry, asset class, and region, offering a detailed overview for investment analysis and decision-making processes within asset management.
Asset mix, Equity investments, Lending, Investment analysis, Asset management
false
Asset Management – Asset MixFull Year and Fourth Quarter 2021 Earnings Results Presentation
Multiple Chart
Goldman Sachs
View slide
Compares the weekly study hours before and after solar power adoption in Nigerian boarding schools, using column charts to visualize the data.
Strategic Planning
Education & Training
Highlights the effectiveness of solar power in increasing study hours at night, presenting data that shows enhanced educational outcomes and improved academic performance among students.
education, solar power, Nigeria, boarding schools, study hours, night studies, academic improvement
false
Study hours: Enhancing power access in public boarding schools could extend student study time by ~86-127%, and improve students' education outcomesSocio-economic case for deepening solar PV deployment in Nigeria
Mixed Chart
BCG
View slide
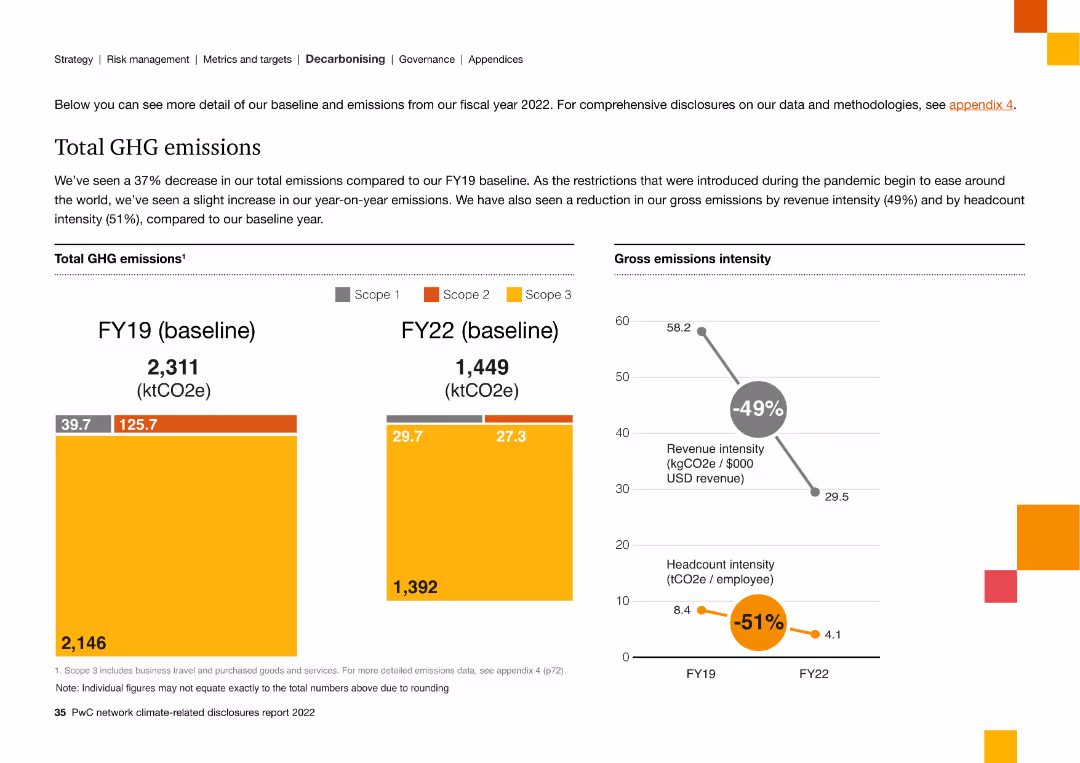
The slide presents data with column charts comparing GHG emissions between FY19 and FY22, showing a decrease in total emissions and intensity metrics.
Financial Performance
Energy & Utilities
The slide compares FY19 and FY22 GHG emissions data, demonstrating a 37% reduction in total emissions and improvements in emission intensity.
GHG emissions, FY19, FY22, reduction, intensity, scope, baseline, data
false
Total GHG emissionsPwC Network Climate-related disclosures report
Multiple Chart
PwC/Strategy&
View slide
The slide combines text with a central diagram that connects drilling, receiving real-time information, and accurate subsurface data. It features a quotation for a personal touch and provides a concise visual representation of the company's technological focus.
Technology and Digital Transformation
Industrial & Manufacturing
The slide explains how the company's technologies enhance drilling and data analysis, used to highlight innovation in operational technologies and their impact on cost-effective operations.
Technology, Innovation, Drilling, Data Analysis, Cost-Effective
false
What Our Technologies Do Enable successful cost-effective operationsIMDEX Presentation Morgan Stanley Conference
Framework
Morgan Stanley
View slide
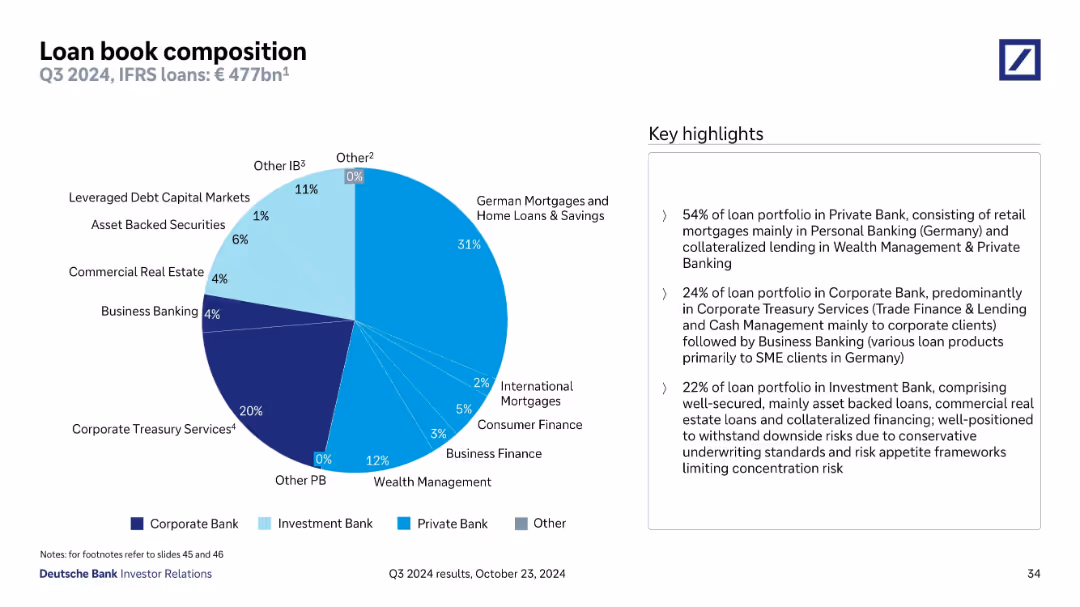
Pie chart showing breakdown of total loan book (€477bn) by type and segment (Private, Corporate, Investment Bank); right-side panel summarizes proportions and risk profiles.
Risk Assessment and Management
Financial Services
This slide analyzes the composition of Deutsche Bank’s loan book. 54% is in Private Bank (mainly German mortgages), 24% in Corporate (mainly treasury services), and 22% in Investment Bank. The slide also underscores risk distribution and lending standards.
loan book, mortgages, private bank, corporate, investment, risk
false
Loan book composition – Q3 2024Q3 2024 results
Mixed Chart
Deutsche Bank
View slide
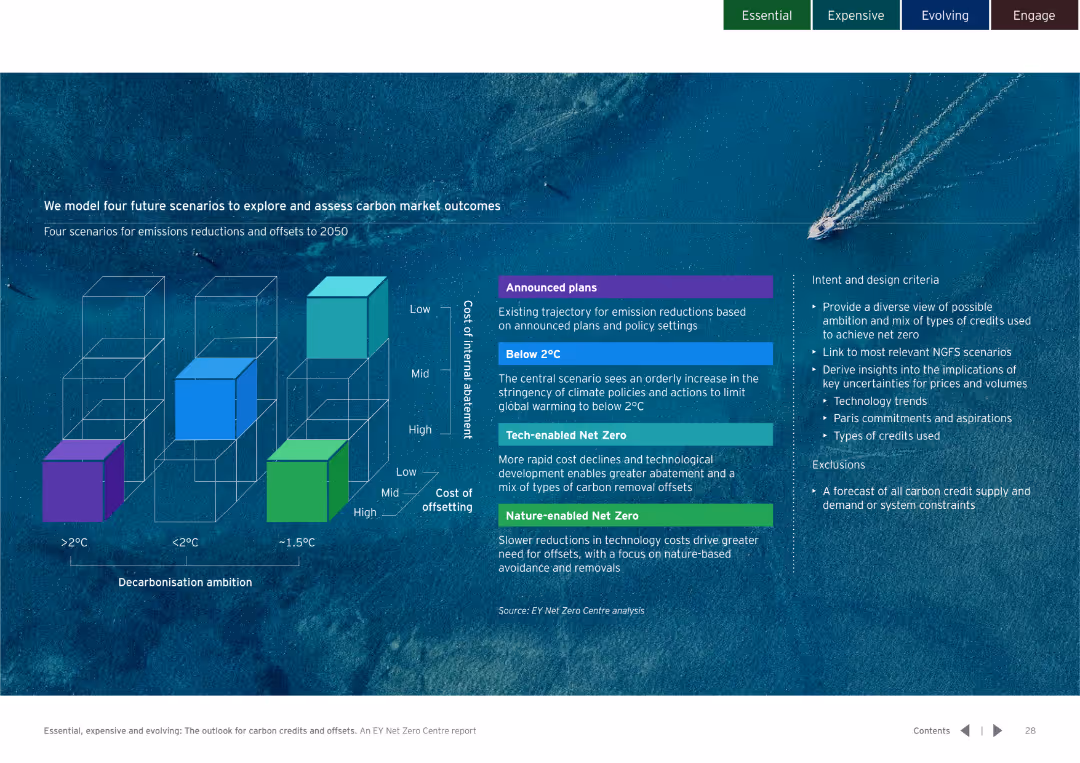
Three-dimensional block diagram comparing different decarbonisation scenarios and strategies. Clear color-coded sections for easy understanding.
Strategic Planning
Environmental Services & Sustainability
Models four scenarios for carbon market outcomes up to 2050. Details the potential impacts and design criteria for each scenario.
carbon market, future scenarios, decarbonisation
false
We model four future scenarios to explore and assess carbon market outcomesEssential, expensive and evolving: The outlook for carbon credits and offsets
Diagram
EY
View slide
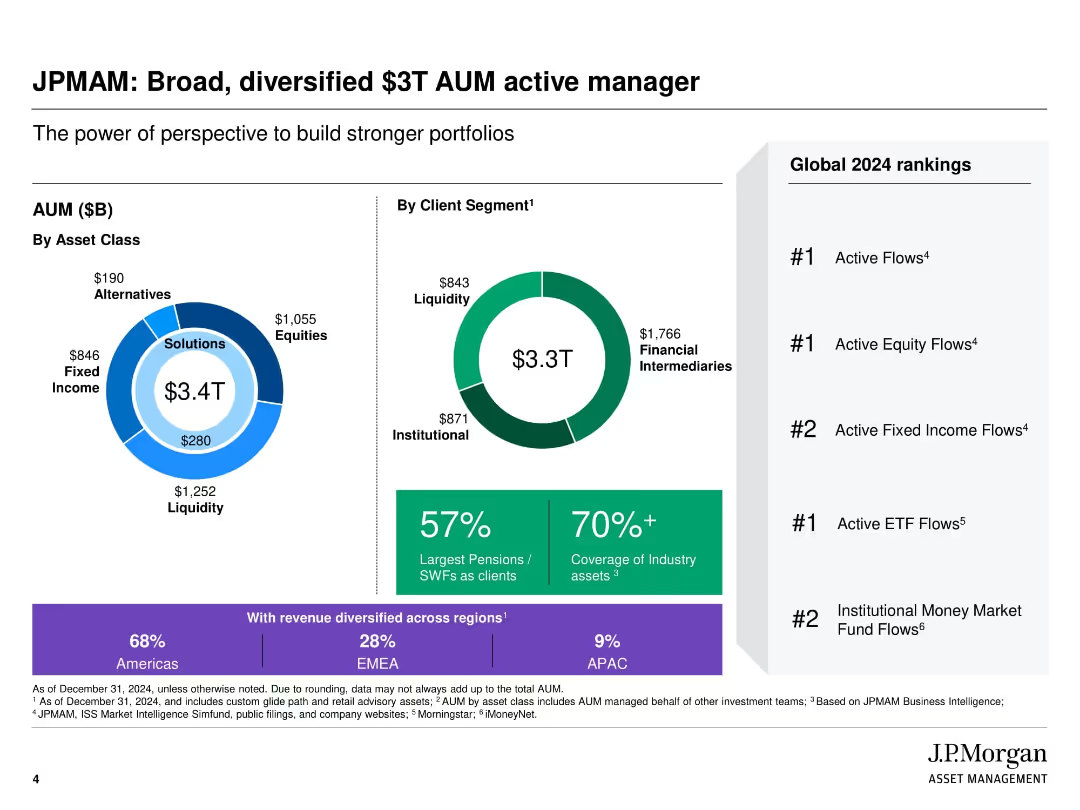
Circular infographics and bar charts showing AUM distribution by asset class and client type; ranking list on the right
Industry Overview
Financial Services
Highlights the scale and diversification of JPMorgan Asset Management, emphasizing its $3.3T AUM and strong global rankings in various asset classes. Shows distribution by client segments, asset classes, and regional revenue breakdown, reinforcing JPMAM’s breadth and reach.
AUM, asset classes, global rankings, client segment, JPMorgan, diversification, industry leader
false
JPMAM: Broad, diversified $3T AUM active managerJ.P. Morgan US Technology Leaders Strategy
Multiple Chart
JP Morgan
View slide
A line chart shows the CAC versus CO2 emissions from electricity generation by 2030 for various countries, comparing costs for grid, grid + wind, grid + solar, and blue hydrogen CAC setups.
Market Analysis and Trends
Energy & Utilities
The slide evaluates the cost-effectiveness of hydrogen from grid-powered electrolyzers for reducing emissions, noting the carbon footprint threshold for competitive cost.
CO2 emissions, CAC, grid, wind, solar, hydrogen, electrolyzer, cost-effectiveness
false
CAC vs. CO2 emissions from electricity gen. (2030)Hydrogen applications and business models
Mixed Chart
Kearney
View slide
The slide splits into two sections, one with bullet points outlining strategic imperatives and the other with a graphic metaphor of "timeboxing" the virus. It's simple with minimal color usage, primarily black and white.
Strategic Planning
Healthcare & Pharmaceuticals
This slide discusses strategic imperatives to safeguard lives and livelihoods amid COVID-19, alongside a graphic illustrating the concept of "timeboxing" the pandemic's impact. It's useful for conveying strategic actions and their expected outcomes.
Strategic Imperatives, COVID-19, Timeboxing, Safety
false
The Imperative of our TimeCOVID-19: Briefing Note
Mixed Chart
McKinsey
View slide
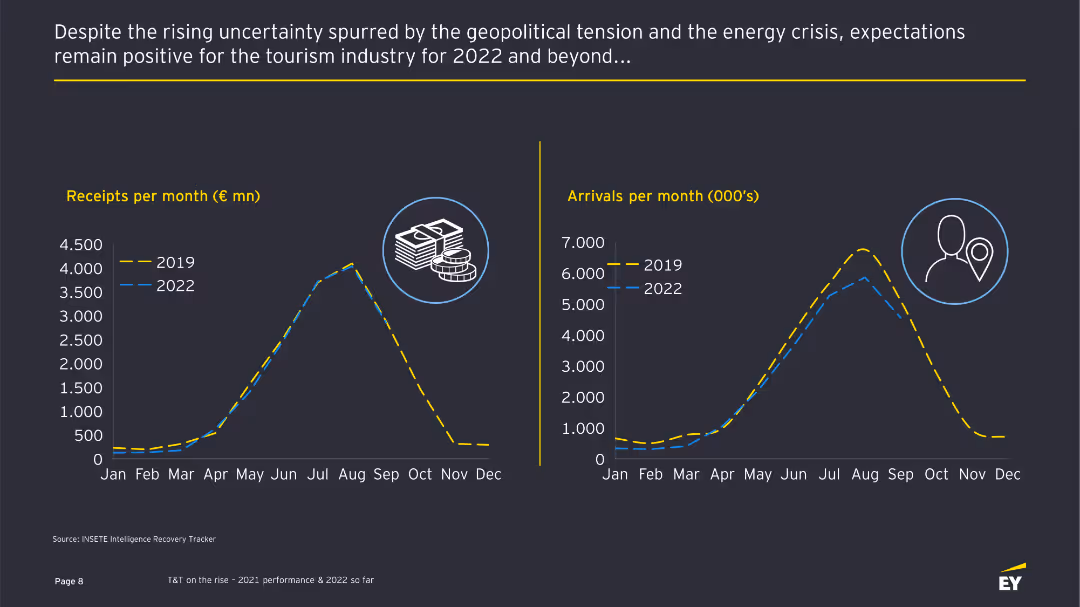
The slide features two line charts comparing monthly receipts and arrivals in 2019 and 2022, accompanied by text describing the positive expectations despite geopolitical tensions.
Market Analysis and Trends
Hospitality & Tourism
This slide shows a positive outlook for the tourism industry in 2022, comparing monthly receipts and arrivals with those of 2019 and discussing the industry's resilience.
Tourism industry, expectations, line charts, market trends, financial data
false
Despite the rising uncertainty spurred by the geopolitical tension and the energy crisis, expectations remain positive for the tourism industry for 2022 and beyond...Industry Pulse Report: Travel & Tourism
Multiple Chart
EY
View slide
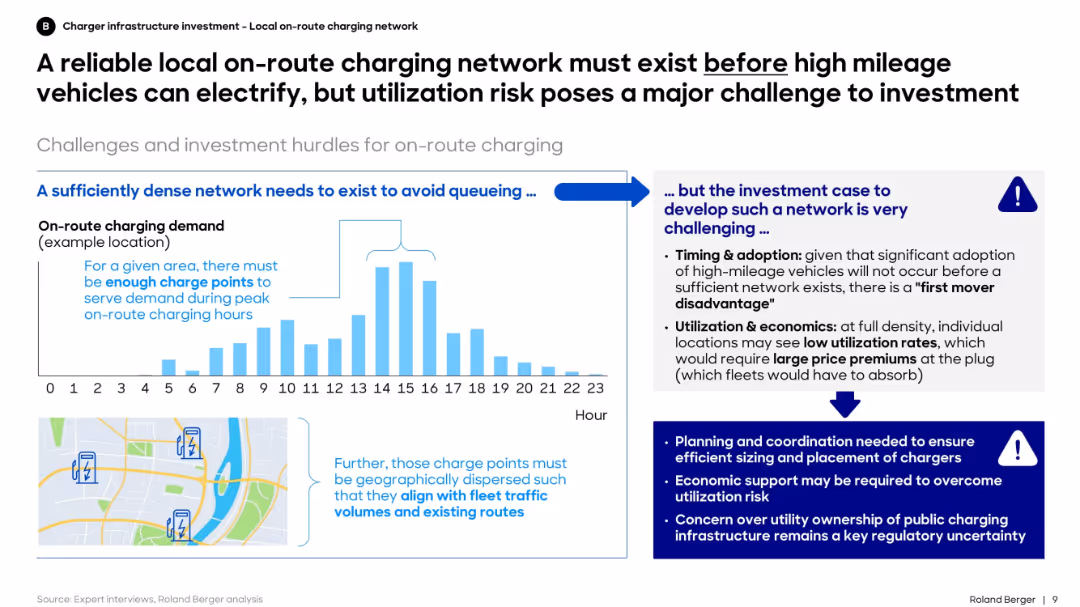
Left side shows charging demand over time and map-based charger siting need. Right section discusses investment hurdles and risks.
Regulatory and Compliance
Transportation & Logistics
The slide highlights that investment in local on-route charging must precede widespread electrification of high-mileage fleets. However, it stresses the challenge of ensuring high utilization rates to justify this upfront investment.
utilization, charging network, investment, electrification, high-mileage, planning, fleet, infrastructure
false
A reliable local on route charging network must exist before high mileage vehicles can electrify, but utilization risk poses a major challenge to investmentForecasting a Realistic Electricity Infrastructure Buildout for Medium- & Heavy-Duty Battery Electric Vehicles
Mixed Chart
Roland Berger
View slide
A table outlines the top criteria LGBT+ talents consider when choosing an employer in various countries.
Human Resources and Talent Management
Professional Services
Prioritizes the aspects most important to LGBT+ talents in their employment decisions.
LGBT+, employment criteria, employer choice, top criteria
false
LGBT+ friendly culture is LGBT+ talent top 1 criteria to chose a company in Germany/Austria/SwitzerlandOut @ Work Barometer
Table
BCG
View slide
Features two sections: a detailed definition of blockchain and a diagrammatic representation of how blockchain functions, highlighting nodes and blocks with minimalist icons and blue color tones.
Technology and Digital Transformation
Technology & Software
Provides a fundamental explanation of blockchain technology, describing its decentralized nature and the process of adding new data blocks to the network. Aimed at educating viewers new to blockchain concepts.
blockchain, digital ledger, decentralization, nodes, technology
false
BlockchainBlockchain and Digital Assets
Boxed
McKinsey
View slide
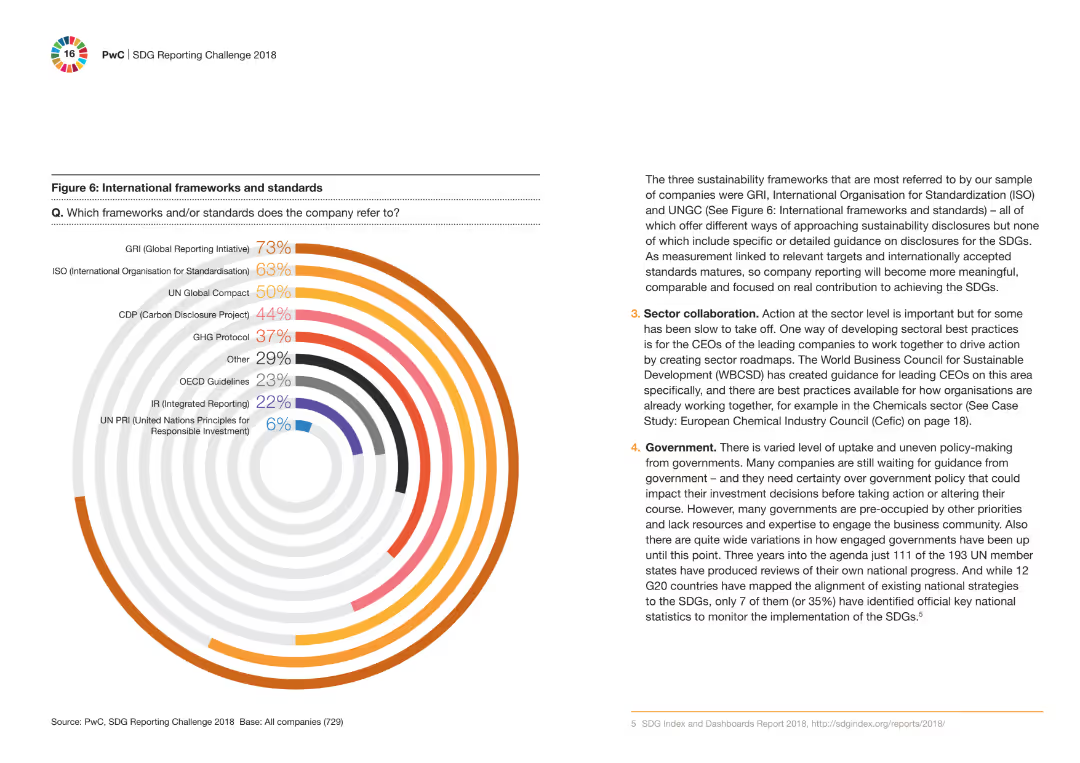
A circular bar chart displaying the percentage of companies referring to different international frameworks and standards. Accompanying text explains the importance of these frameworks in sustainability reporting.
Regulatory and Compliance
Financial Services
The slide showcases the international frameworks and standards most referred to by companies for sustainability reporting, with a circular bar chart highlighting the key standards like GRI, ISO, and UNGC.
frameworks, standards, sustainability, reporting, companies
false
Figure 6: International frameworks and standardsFrom promise to reality: Does business really care about the SDGs?
Mixed Chart
PwC/Strategy&
View slide
The slide includes a bar chart showing various use cases for DCRs like data anonymization, privacy compliance, data cleaning, and transformation, with percentages for each.
Technology and Digital Transformation
Technology & Software
The slide explains the main use cases for data clean rooms (DCRs) among current users, emphasizing their role in addressing privacy concerns and audience activation.
DCR use cases, privacy, data anonymization, compliance
false
Currently, DCR users are primarily leveraging the technology to address privacy concerns and activate audiencesState of Data 2023
Single Chart
IPSOS
View slide
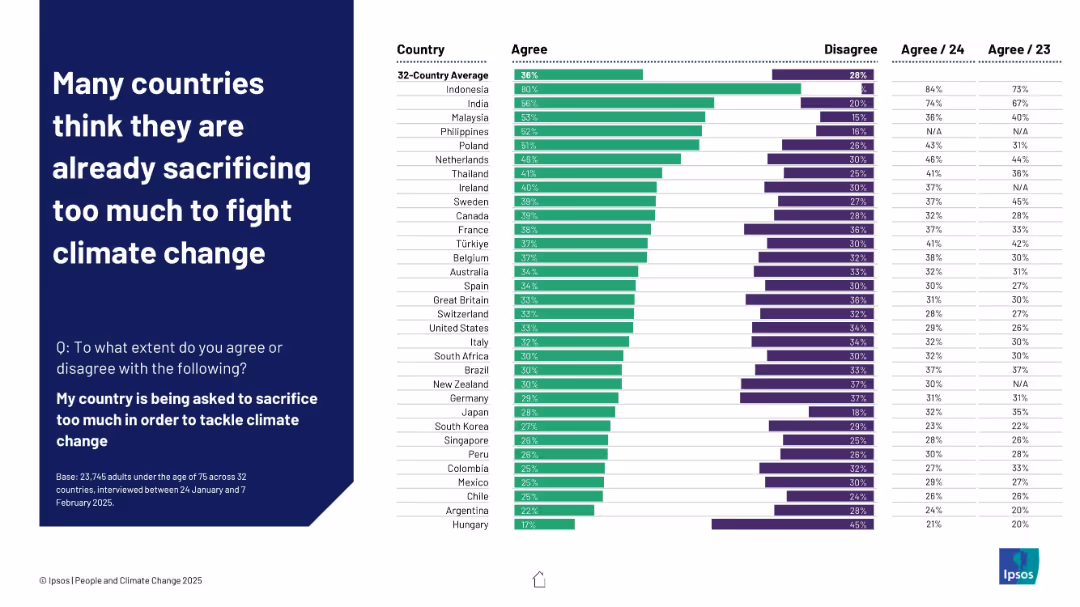
Left-aligned header on dark blue background; right side presents a horizontal bar chart ranking agreement by country with comparative historical data
Customer and Market Segmentation
Environmental Services & Sustainability
This slide shows that people in countries like Indonesia and India feel their nations are sacrificing too much to tackle climate change. The data is contextualized with agreement percentages from 2023 and 2024, indicating shifting attitudes over time.
sacrifice, climate change, public opinion, survey, Ipsos, 2025, international comparison, perception shift, sustainability
false
Many countries think they are already sacrificing too much to fight climate changePEOPLE AND CLIMATE CHANGE
Mixed Chart
IPSOS
View slide
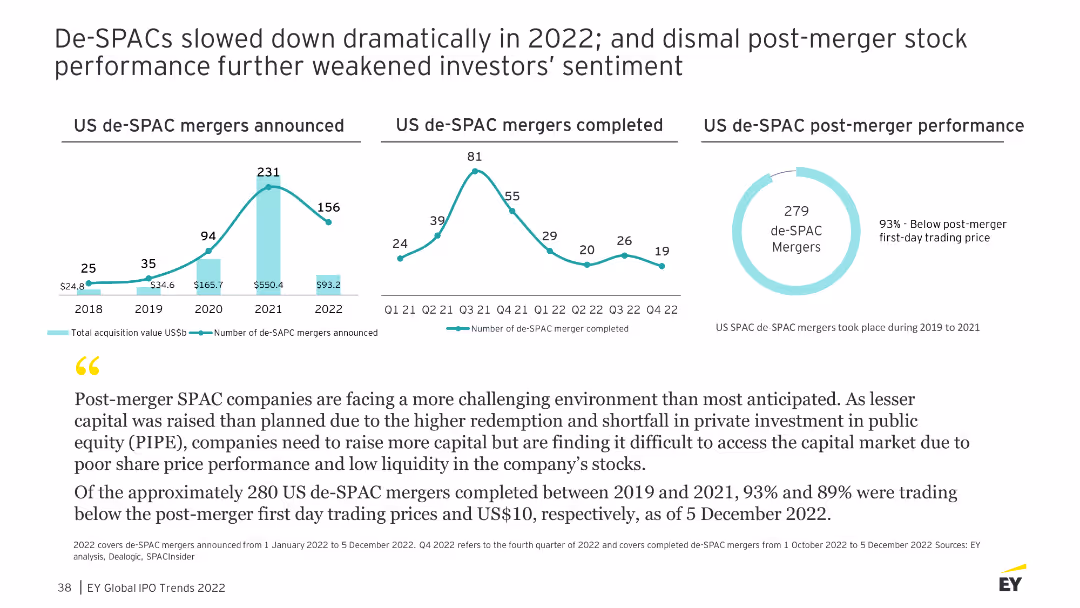
The slide shows multiple line charts illustrating the number of de-SPAC mergers announced and completed, as well as their post-merger performance from 2018 to 2022.
Market Analysis and Trends
Financial Services
Analyzes the decline in de-SPAC activity and the poor post-merger performance, highlighting challenges in the SPAC market.
de-SPAC, mergers, performance, market analysis
false
De SPACs slowed down dramatically in 2022; and dismal post merger stock performance further weakened investors’ sentimentHow can you prepare to seize the right moment?
Multiple Chart
EY
View slide
Horizontal bar chart with ranked countries, % values, and change indicators. Global and country averages shown. Flags highlight US and Canada positions.
Market Analysis and Trends
Financial Services
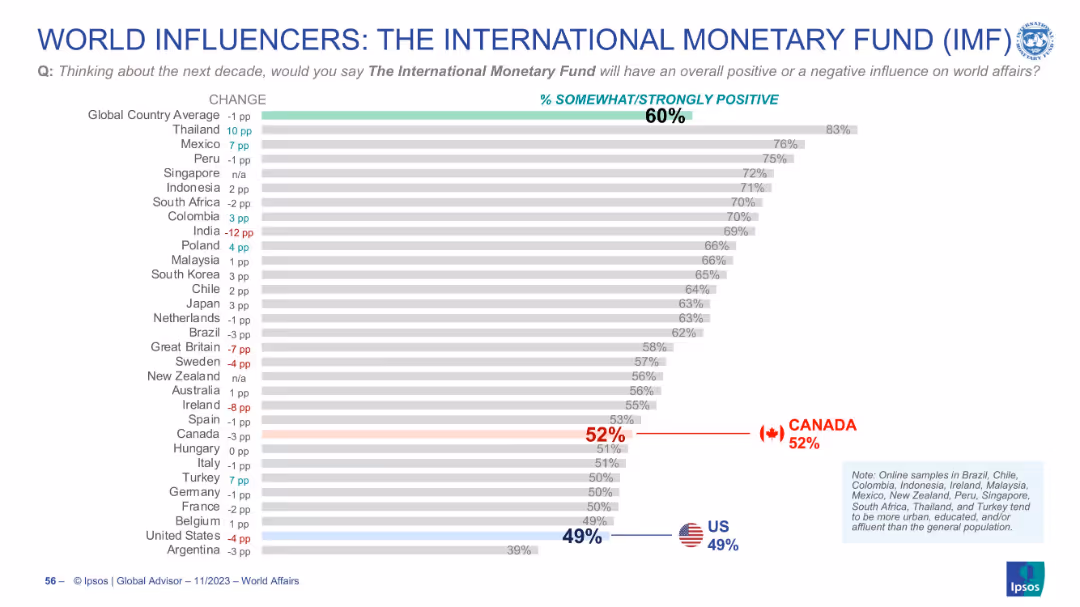
This slide presents global perceptions of the IMF’s influence over the next decade. The majority (60%) view the IMF positively, with strong support in Thailand and Mexico. US and Canadian views are lower than the global average.
IMF, global opinion, perception, influence, trends, country comparison, approval rating, international affairs
false
WORLD INFLUENCERS: THE INTERNATIONAL MONETARY FUND (IMF)WORLD AFFAIRS 2023
Single Chart
IPSOS
View slide
The slide features a bar chart showing real GDP growth rates from 2000 to 2029 for different regions, and a stacked bar chart showing contribution to global GDP growth by region.
Market Analysis and Trends
Financial Services
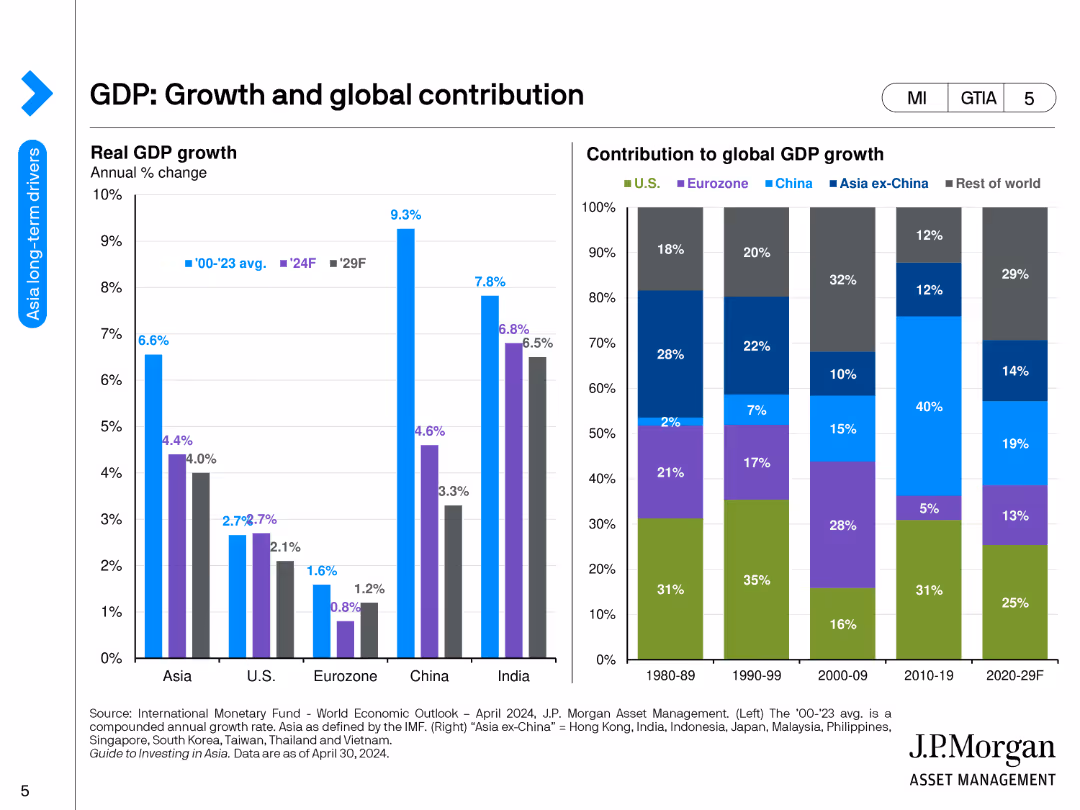
This slide analyzes global GDP growth rates and contributions from various regions, providing insights into economic performance and forecasts. It highlights the significant role of Asia in global growth.
GDP Growth, Global Contribution, Economic Performance, Regions, Forecast
false
GDP: Growth and global contributionGuide to Investing in Asia
Multiple Chart
JP Morgan
View slide
The slide includes bar and column charts depicting financial results and revenue details, complemented by comprehensive financial data and changes over the quarter. Textual highlights emphasize performance metrics.
Financial Performance
Financial Services
Discusses the Q2 2023 financial results of Deutsche Bank's Private Bank, showing significant revenue growth driven by net interest income and other key financial metrics.
Private banking, financial results, revenue growth, net interest income, financial analysis, Deutsche Bank, Q2 2023
false
Private Bank In € m, unless stated otherwiseQ2 2023 results
Multiple Chart
Deutsche Bank
View slide
The left side of the slide features a column chart showcasing the balance sheet mix with a positive trend arrow and percentage distribution across categories. On the right, a pie chart delineates the 'Sources of Funding' with a legend explaining the elements within the pie chart.
Financial Performance
Financial Services
This slide provides a visual breakdown of a company's balance sheet and funding sources, indicating a substantial liquidity and a growing balance sheet, useful for financial analysis or investor presentations.
balance sheet, funding sources, liquidity, pie chart, bar chart, financial analysis, trend, asset mix, financial growth, capital management
false
Balance Sheet 11 Balance Sheet Mix ($bn)Fixed Income Investor Presentation
Multiple Chart
Goldman Sachs
View slide
Horizontal bar chart ranking countries by share of quantum patents (2000–2021), with key insights listed on the right.
Competitive Landscape
Artificial Intelligence
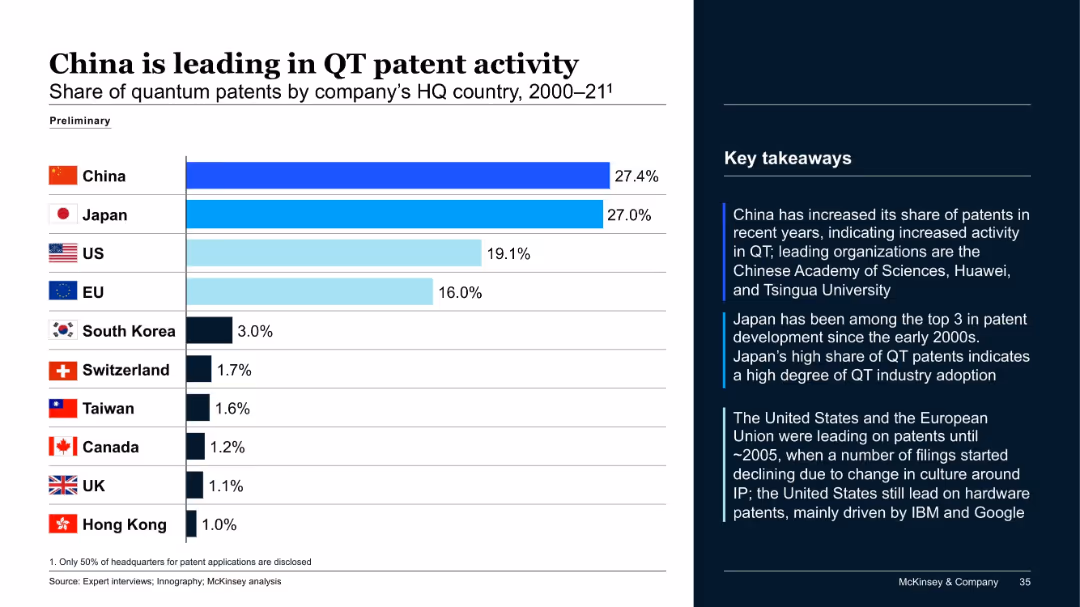
China leads with 27.4% of quantum technology (QT) patents, closely followed by Japan. The US and EU trail at 19.1% and 16%, respectively. The commentary highlights China's rapid growth, Japan's consistent top-3 presence, and a decline in US/EU filings since ~2005 due to changing IP cultures.
QT patents, China, Japan, US, EU, intellectual property, competitive analysis
false
China is leading in QT patent activityThe Quantum Technology Monitor September 2021
Mixed Chart
McKinsey
View slide
This slide features a column chart showing the growth of the Italian vitamins and dietary supplements market from 2018 to 2023, with a projected CAGR of 4.3%. Text boxes below the chart provide additional context and factors driving this growth.
Market Analysis and Trends
Healthcare & Pharmaceuticals
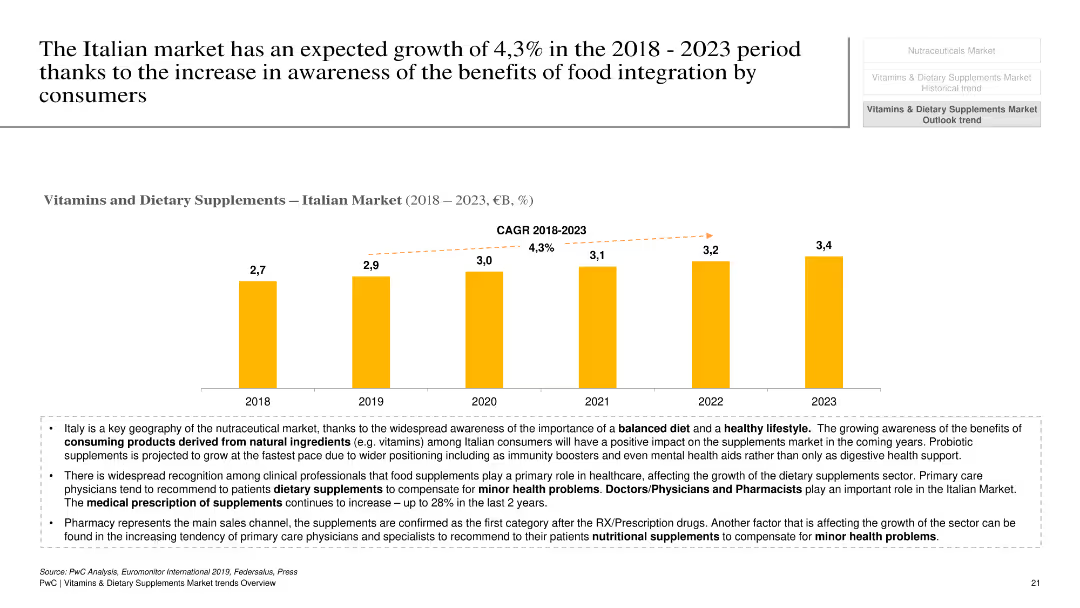
The slide presents the growth forecast for the Italian market for vitamins and dietary supplements, highlighting the projected CAGR and key factors contributing to this growth. It emphasizes the impact of increased consumer awareness and the role of healthcare professionals in recommending supplements.
Italian market, vitamins, dietary supplements, growth forecast, consumer awareness
false
The Italian market has an expected growth of 4,3% in the 2018 -2023 period thanks to the increase in awareness of the benefits of food integration by consumersVitamins & Dietary Supplements Market trends - Overview
Mixed Chart
PwC/Strategy&
View slide
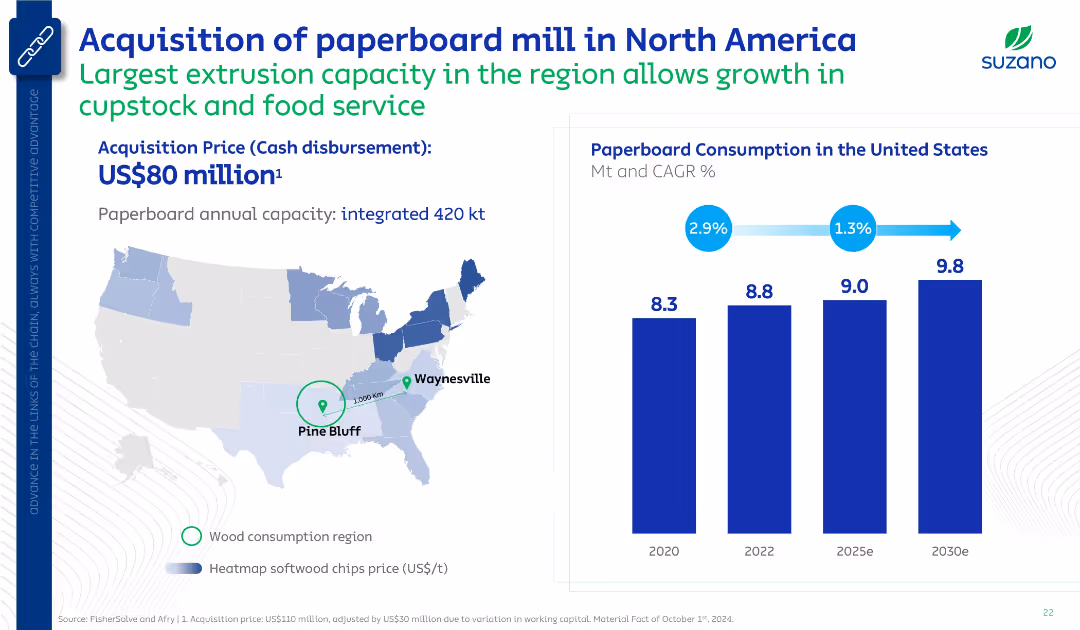
Mixed layout with map and bar chart. Shows location and details of new mill plus projected paperboard consumption in the U.S. Uses corporate blue branding and minimal text for clarity.
Mergers and Acquisitions
Industrial & Manufacturing
Announces acquisition of a paperboard mill with high extrusion capacity to target food service markets. Supports growth in U.S. paperboard demand with estimated increase from 8.3 Mt (2020) to 9.8 Mt (2030e).
acquisition, paperboard, Suzano, North America, capacity, Pine Bluff
false
Acquisition of paperboard mill in North AmericaGoldman Sachs Brazil Commodities Days
Multiple Chart
Goldman Sachs
View slide
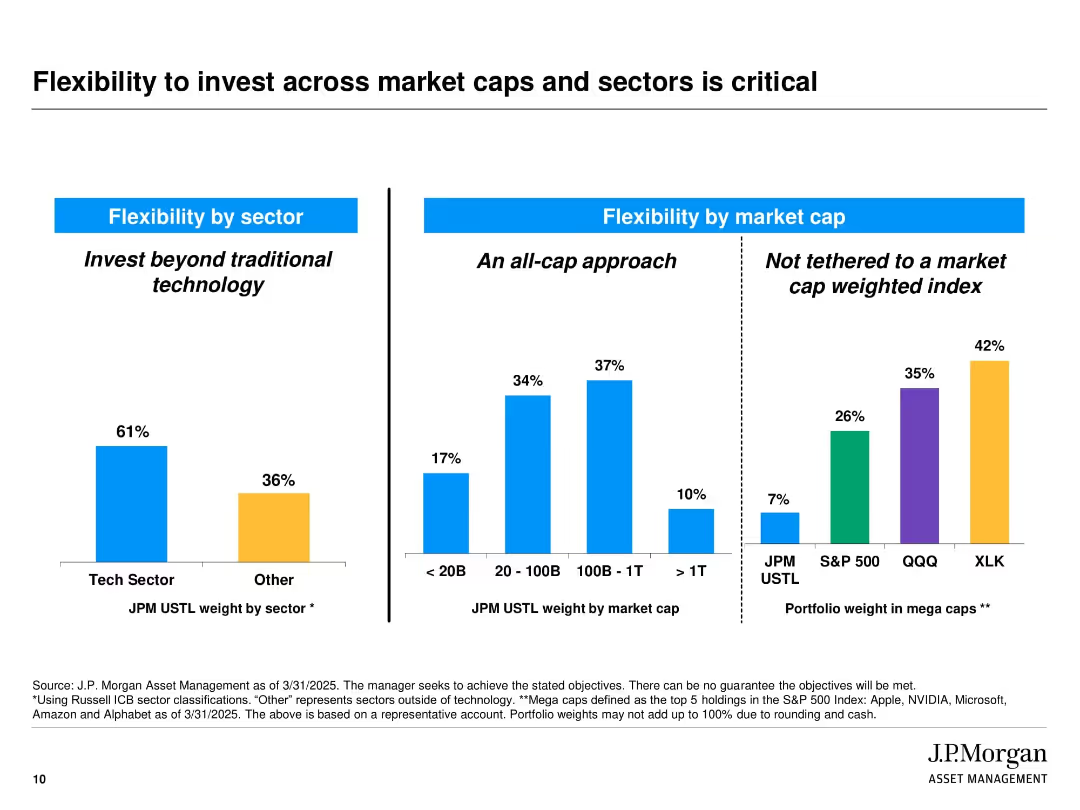
Slide is split into three vertical bar chart sections with labeled headings and blue dividers. Colors differentiate sectors and index groups (blue, orange, purple, green). Includes labels and percentages above each bar. Source notes and disclaimers appear at the bottom.
Strategic Planning
Financial Services
The slide illustrates J.P. Morgan’s diversified investment approach by showcasing flexibility in sector and market cap allocations. It emphasizes not being limited to traditional tech sectors or market-cap-weighted indices. The three sections show allocation by sector (tech vs. others), by market cap, and comparison of mega cap weightings across indices.
diversification, market cap, tech sector, investment strategy, J.P. Morgan, flexibility, portfolio allocation, index comparison, mega caps, strategic planning
false
Flexibility to invest across market caps and sectors is criticalJ.P. Morgan US Technology Leaders Strategy
Multiple Chart
JP Morgan
View slide
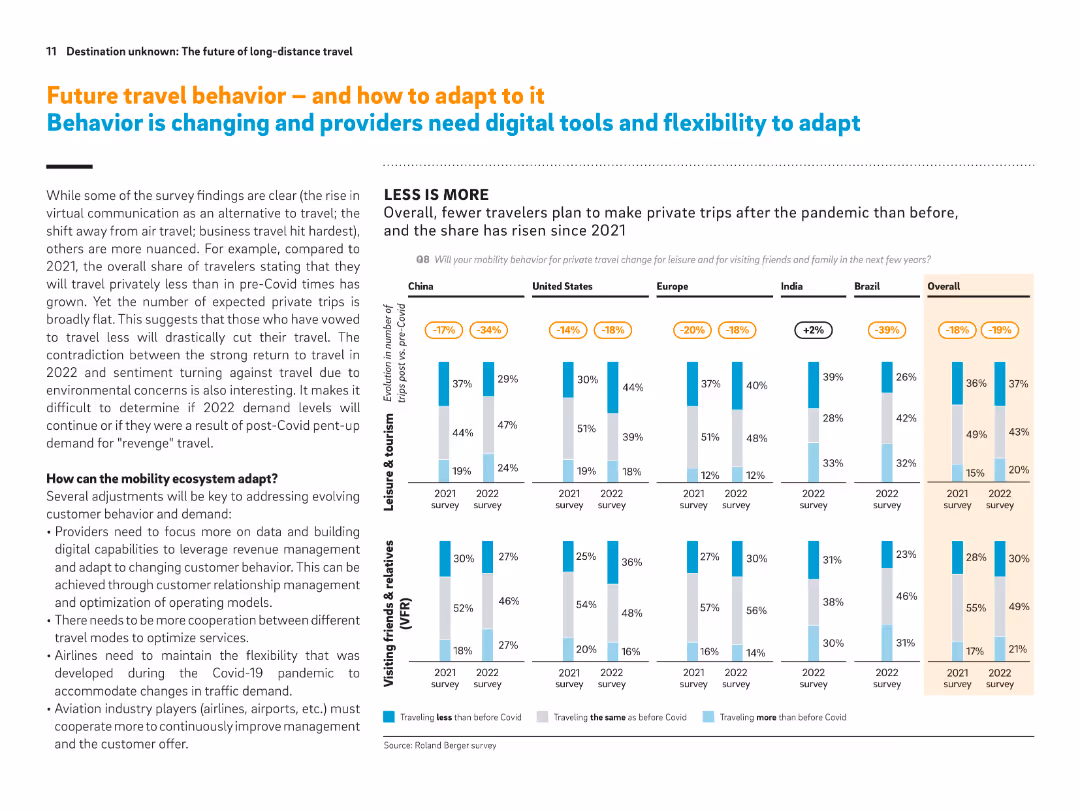
Two-column layout with text on the left and a vertical bar chart comparison on the right, showing survey results from multiple countries. Headline in orange and blue.
Market Analysis and Trends
Transportation & Logistics
This slide explores changes in private travel behavior post-COVID, emphasizing reduced travel intentions despite the strong recovery in 2022. It presents comparative survey data across countries and provides insights on how mobility providers should adapt using digital tools and ecosystem cooperation.
travel behavior, post-COVID, digital tools, survey data, market adaptation, mobility, private trips, international comparison, ecosystem
false
Future travel behavior – and how to adapt to it Behavior is changing and providers need digital tools and flexibility to adaptDestination unknown: The future of long-distance travel
Multiple Chart
Roland Berger
View slide
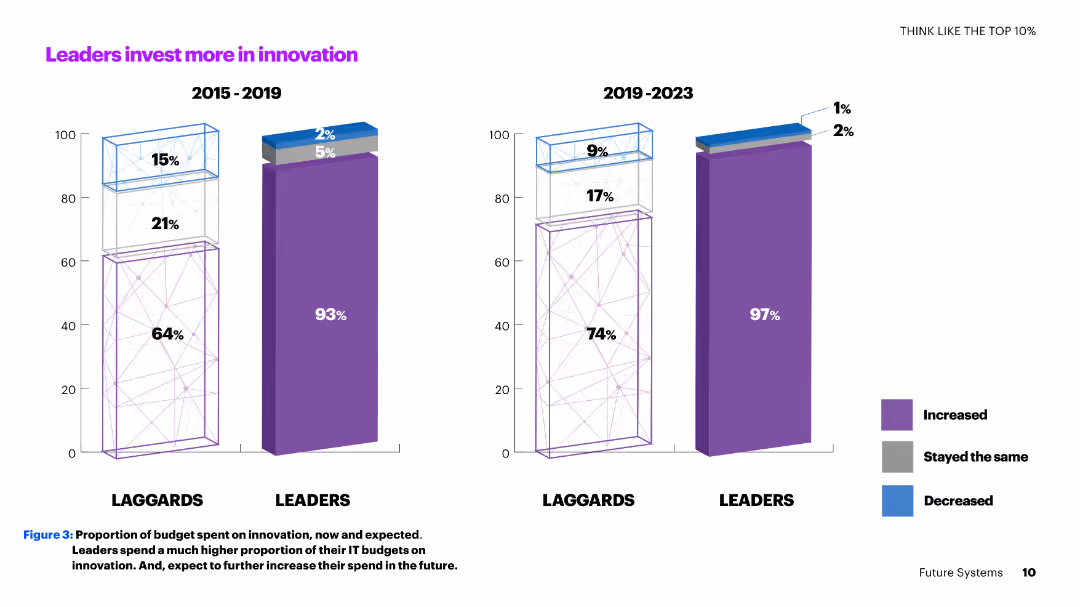
A two-column slide with vertical bar charts comparing the innovation investment percentages of leaders and laggards from 2015-2019 and 2019-2023.
Investment Analysis
Technology & Software
The slide shows how leaders consistently invest more in innovation compared to laggards, with a significant portion of their IT budgets allocated to innovation now and in the future.
innovation, investment, leaders, laggards, IT budgets, comparison, future, percentages, trends, analysis
false
Leaders invest more in innovationFULL VALUE. FULL STOP How to scale innovation and achieve full value with Future Systems
Multiple Chart
Accenture
View slide
A column chart showing year-over-year percentage change in headline CPI from 2022 to 2025F for global and various regions including the US, Euro area, UK, Japan, China, India, LatAm, ASEAN, MENA, and SSA.
Market Analysis and Trends
Financial Services
The slide forecasts continued disinflation across most economies in 2024, assuming soft demand growth and steady supply conditions.
disinflation, CPI, economic forecast, 2024, demand growth, supply conditions
false
Disinflationary momentum should continue across most economies in 2024 assuming soft demand growth and rebounding to steady supply conditionsGlobal economic outlook: finding balance in 2024
Single Chart
EY
View slide
The slide includes pie charts representing industry distribution, job levels, and organizational sizes among research participants in Ukraine. The design is clean with well-labeled sections for clarity.
Market Analysis and Trends
Professional Services
This slide provides demographic and market analysis data of research participants in Ukraine, breaking down their distribution across various industries, job levels, and organizational sizes. It offers insights into the sample's composition, useful for contextualizing the study’s findings within specific sectors and job roles.
Research, Demographics, Ukraine, Industry, Job Levels
false
Research participants in UkraineDeloitte 2023 Global Human Capital Trends: New fundamentals for a boundaryless world
Multiple Chart
Deloitte
View slide
This slide features a column chart showing technology sector PE/VC investments over years, with a line chart indicating the number of deals. It includes two stacked column charts breaking down investments by deal segments in terms of value and number of deals.
Market Analysis and Trends
Technology & Software
The slide highlights PE/VC investment trends in the technology sector, showing investment values and the number of deals over several years. It breaks down investments by deal segments, providing a comprehensive view of the sector's investment landscape.
PE/VC, technology sector, investment trends, deal segments, number of deals
false
Spotlight: Technology sector PE/VC investment trend Total technology sector PE/VC investmentsWhy do uncertain times need a certainty of purpose? April 2023
Multiple Chart
EY
View slide
Three line charts displaying Australia's y/y real GDP, unemployment rate, and y/y percentage change in CPI from 2005-25F. Moderate complexity, suitable for presenting detailed economic data and trends.
Market Analysis and Trends
Financial Services
This slide analyzes the Australian economy, discussing the impacts of persistent inflation, rising interest rates, and strong labor market conditions on economic growth. It provides projections for GDP, unemployment, and CPI.
Australia, GDP, unemployment, CPI, economy
false
The Australian economy is weighed down by persistent inflation and rising interest rates, but robust labor market conditions continue to support consumer spendingGlobal economic outlook Macroeconomic outlook and impact on businesses
Multiple Chart
EY
View slide
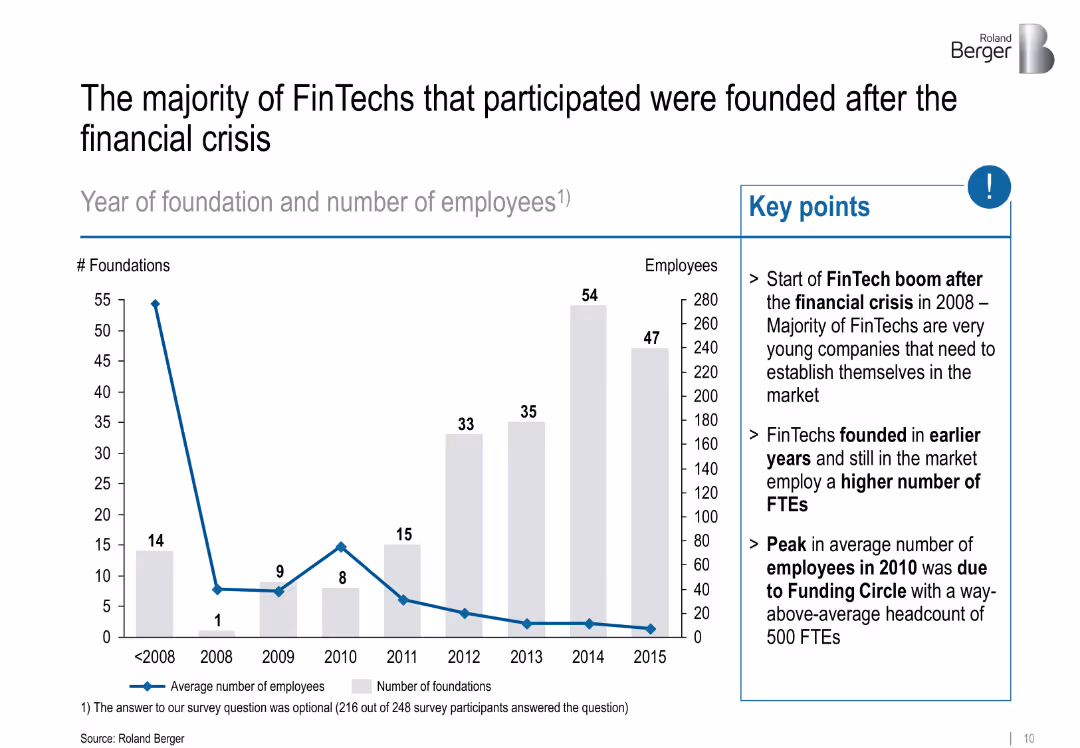
Left: bar chart showing foundations/year; Right: key insights in bullet form; uses grey and blue for emphasis
Industry Overview
Financial Services
Tracks the foundation years of FinTech companies, revealing a boom post-2008 financial crisis. Notes that older firms have more employees and highlights a peak due to a major player.
FinTech origins, post-crisis, startup growth, employment, Funding Circle
false
The majority of FinTechs that participated were founded after the financial crisisFinTechs in Europe – Challenger and Partner
Mixed Chart
Roland Berger
View slide
Includes two line graphs illustrating pre-tax income projections over a timeline, with legends and annotations.
Investment Analysis
Financial Services
Discusses future income estimates related to growth initiatives, aiming for a positive return on investment, suitable for investor relations or financial planning.
Growth Initiatives, Income Projections, Investment, ROI, Financial Planning, Trends, Analysis
false
Growth Initiatives to Generate Positive ReturnsGoldman Sachs Investor Day
Single Chart
Goldman Sachs
View slide
The slide features a detailed literature review layout with a mix of text blocks and table showing percentage increases in GDP relative to broadband speed. It uses purple and green colors for the charts.
Market Analysis and Trends
Telecommunications
Reviews various studies to assess how increments in broadband speed can lead to GDP growth, with a comparative analysis featuring different models and their implications.
broadband, GDP, economic growth, literature review, productivity, data analysis, comparison, methodology, international studies, models
false
Literature review – broadband and economic growthThe economic and social impact of investment in the nbn network Methodology Report
Table
Accenture
View slide
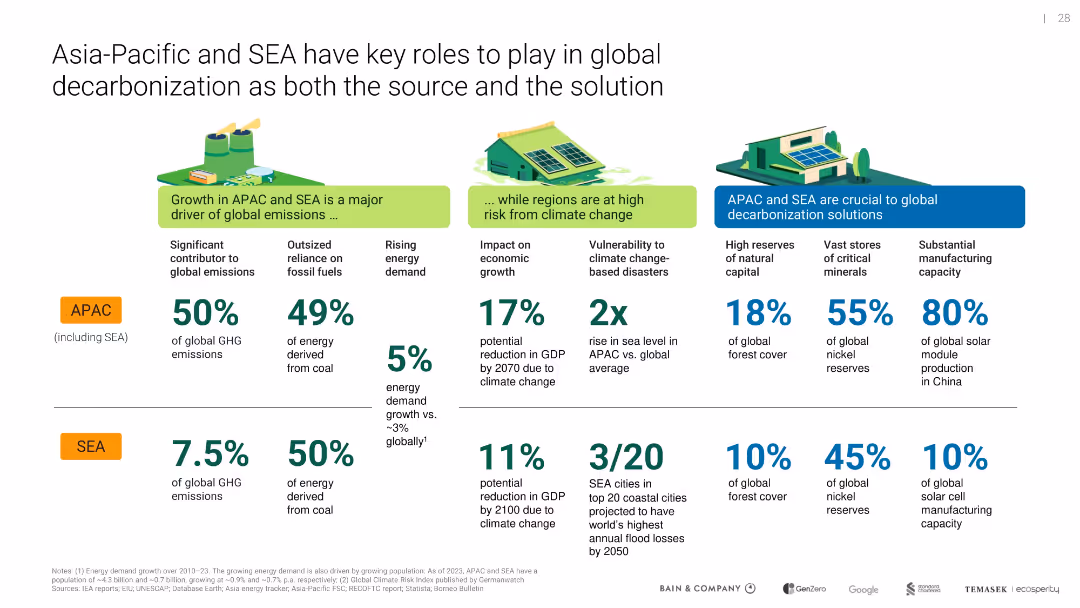
Horizontal comparison with three segments and APAC/SEA stats; infographic style with numerical emphasis and icons
Market Analysis and Trends
Environmental Services & Sustainability
Emphasizes the dual role of APAC and SEA as major GHG contributors and vital actors in decarbonization due to natural resources, critical minerals, and production capacity, reinforcing their pivotal role in the global climate agenda.
APAC, SEA, emissions, forest cover, decarbonization, minerals, solar
false
Asia-Pacific and SEA have key roles to play in global decarbonization as both the source and the solutionSoutheast Asia's Green Economy
Table
Bain
View slide
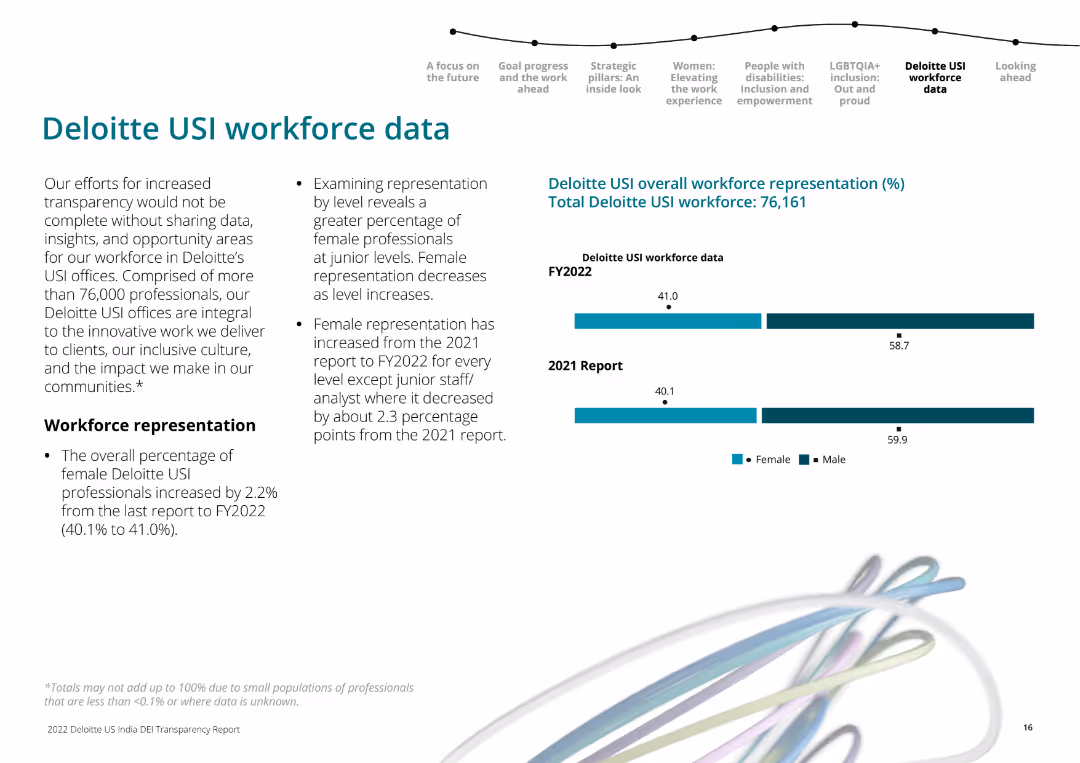
The slide includes textual information on the left about Deloitte USI workforce representation. On the right, there are horizontal bar charts comparing female and male workforce representation in 2021 and 2022.
Human Resources and Talent Management
Professional Services
Presents Deloitte USI’s workforce representation data, emphasizing the increase in female representation across most levels from 2021 to 2022.
workforce data, gender representation, Deloitte USI, 2022, 2021
false
Deloitte USI workforce data2022 Deloitte US India Diversity, Equity, and Inclusion (DEI) Transparency Report
Mixed Chart
Deloitte
View slide
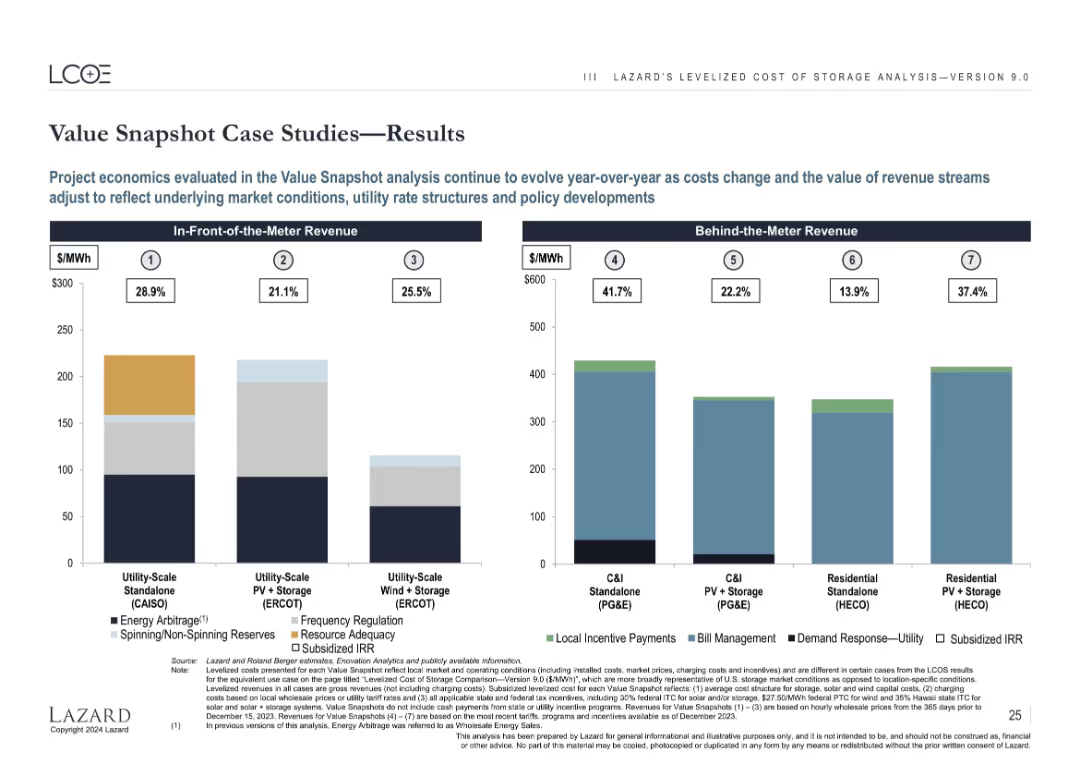
Split bar charts showing revenue breakdowns by use case, with value percentages and revenue sources.
Investment Analysis
Energy & Utilities
Visualizes revenue composition from each of the 7 case studies listed earlier. In-front-of-the-meter and behind-the-meter projects are separated, with revenue split across categories like energy arbitrage, subsidies, and demand response, including IRR estimates.
project economics, revenue, arbitrage, incentives, IRR, behind-the-meter, in-front
false
Value Snapshot Case Studies—ResultsLazard LCOE+
Multiple Chart
Roland Berger
View slide
The slide contains two column charts. The left chart shows the top countries for universities with QT research programs, and the right chart shows the number of universities offering QT master’s degrees per country.
Human Resources and Talent Management
Education & Training
This slide provides data on the growth of quantum technology education, indicating a significant increase in the number of universities offering QT master's degrees. It highlights the leading countries in QT research and education.
Universities, QT, Master's Degrees, Research, Education
false
The number of universities offering QT master’s degrees has increased to 50, a 74 percent increase since 2021.Quantum Technology Monitor
Multiple Chart
McKinsey
View slide
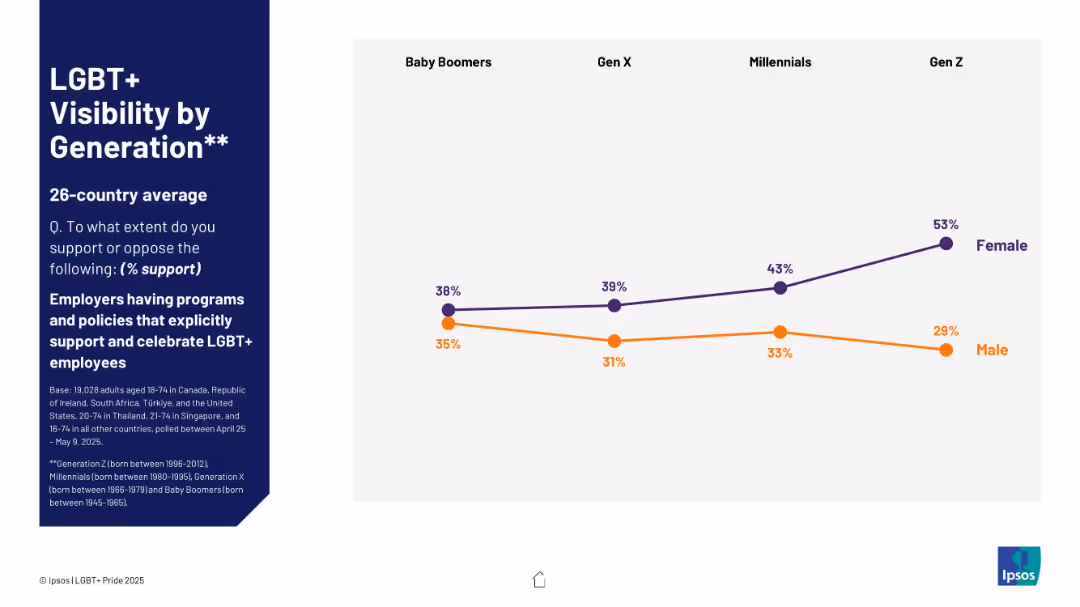
Dual-line chart with female/male generational support; left panel with dark blue background and context.
Market Analysis and Trends
Government & Public Sector
Generational support for LGBT+ employee policies shows increasing support among women across generations, especially Gen Z. Male support remains relatively flat or declining.
generation, LGBT+, workplace, employee support, gender trends, equality
false
LGBT+ Visibility by GenerationIPSOS LGBT+ PRIDE REPORT 2025
Mixed Chart
IPSOS
View slide
Line graph and table detailing distributor stock performance and M&A activity, color-coded by industry segment.
Investment Analysis
Financial Services
Shows distributor stock performance against the S&P 500 and the number of acquisitions by segment since 2000.
Stock Performance, M&A, Distribution, Acquisition, Benchmark, Industry
false
Distribution industry dynamicsEY-Parthenon Perspectives: Investing in distribution
Single Chart
EY
View slide
The slide features stacked column charts depicting the distribution of retail categories in e-commerce GMV. It utilizes contrasting colors to differentiate categories and includes descriptive text.
Market Analysis and Trends
Technology & Software
The slide compares the online shopping trends for groceries over time and the expected continuity of these habits. It provides insights into changing consumer behavior and market opportunities.
e-Commerce, groceries, online shopping, consumer behavior, market trends
false
Shoppers are buying more groceries online - and they’re not going backe-Conomy SEA 2020 At full velocity: Resilient and racing ahead
Mixed Chart
Bain
View slide
Contains text in two columns with a treemap on the right showing stakeholder groups impacting sustainability. Uses a white background with blue highlights and clear typography.
Strategic Planning
Professional Services
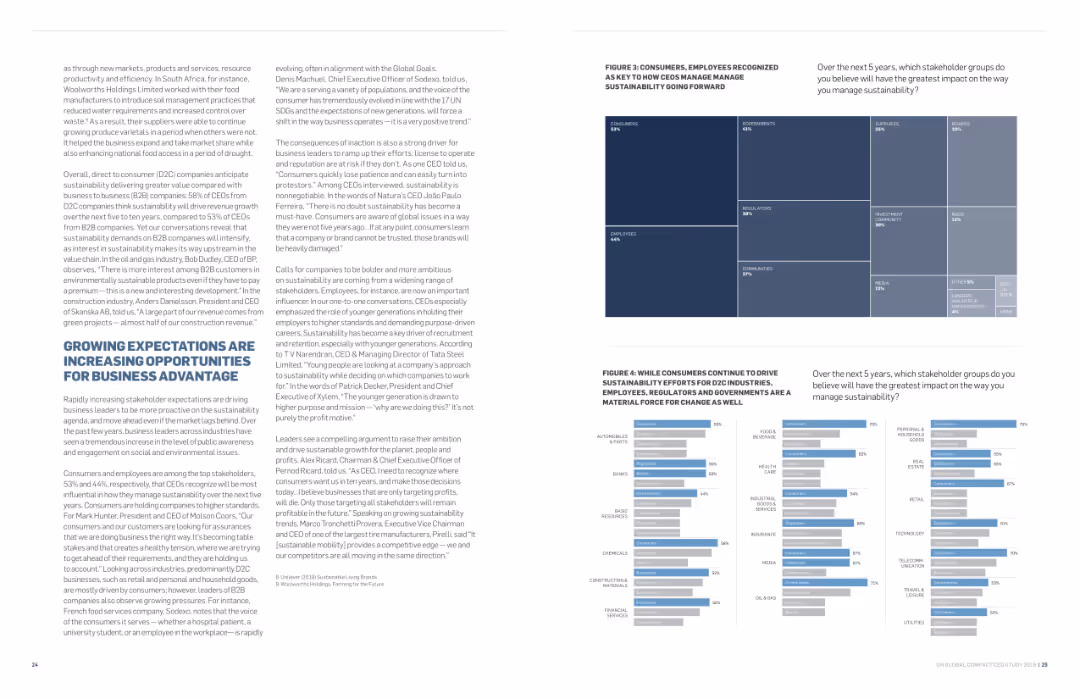
Explores how growing expectations for sustainability are creating business opportunities. The treemap highlights key stakeholder groups like consumers and employees, emphasizing their impact on driving sustainability efforts forward.
sustainability, opportunities, business advantage, expectations, stakeholders
false
FIGURE 3: CONSUMERS, EMPLOYEES RECOGNIZED AS KEY TO HOW CEOS MANAGE MANAGE SUSTAINABILITY GOING FORWARDTHE DECADE TO DELIVER A CALL TO BUSINESS ACTION
Multiple Chart
Accenture
View slide
Slide displays bar graphs detailing the representation of women in national parliaments over time, complemented by clear textual annotations and visual elements emphasizing changes and trends.
Market Analysis and Trends
Government & Public Sector
Discusses the trends and disparities in women's political participation globally, highlighting both progress and areas needing improvement, aimed at fostering discussions on gender equality in governance.
gender equality, politics, global, data, trends, women, parliament, comparison, progress, equity
false
Achieving gender equality or parity in political life is also far off Developing countries now show a higher participation dynamicRoland Berger Trend Compendium 2030: Megatrend 1 People & Society
Multiple Chart
Roland Berger
View slide
This slide contains bar charts and graphical representation of reasons for digital service usage, with a clear and simple color scheme.
Market Analysis and Trends
Technology & Software
Investigates Vietnam's increase in digital consumers and their preferences for continued use of digital services.
Digital Consumers, Vietnam, Growth, Services, Preferences, Continuation, Analysis
false
Vietnam Exponential growth in digital consumers (who intend to continue using digital services)e-Conomy SEA 2021 Roaring 20s: The SEA Digital Decade
Multiple Chart
Bain
View slide
Bar charts and a pie chart showing the distribution of survey participants by industry, revenue, and roles. Different colors and sections indicate various categories.
Market Analysis and Trends
Professional Services
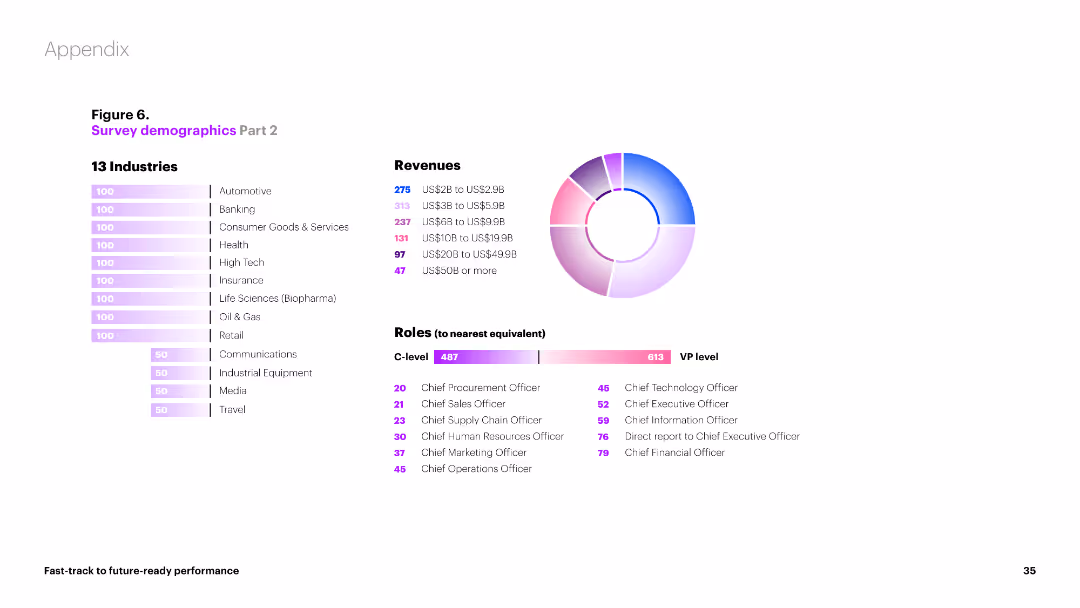
This slide provides a breakdown of survey participants by industry, revenue brackets, and roles. It includes visual data on the number of participants from different sectors and their respective revenues.
demographics, industry, revenue, roles, participants
false
Figure 6. Survey demographics Part 2FAST-TRACK TO FUTURE-READY PERFORMANCE
Multiple Chart
Accenture
View slide
The slide contains multiple column charts showing exit drivers, strategies, and multiples for funds divesting F&L assets. Key findings are presented.
Mergers and Acquisitions
Financial Services
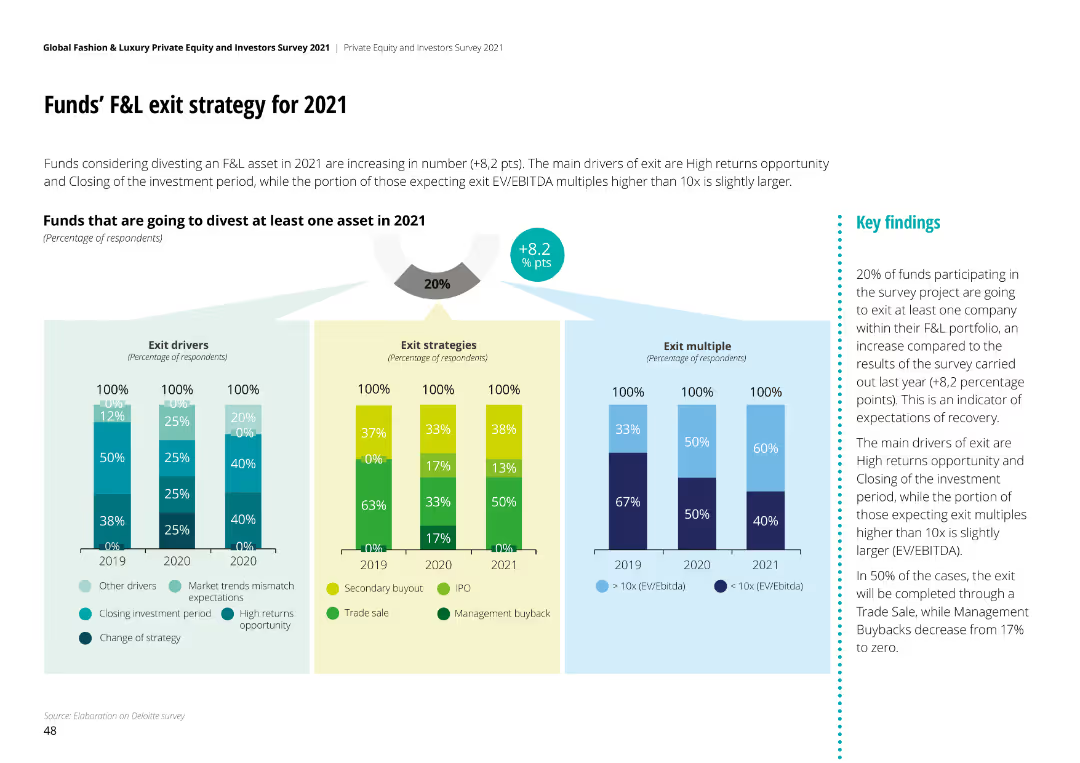
The slide provides insights into exit strategies for funds in F&L for 2021, covering drivers, strategies, and expected multiples.
exit strategy, F&L, funds, divestment, analysis
false
Funds’ F&L exit strategy for 2021Global Fashion & Luxury Private Equity and Investors Survey 2021
Multiple Chart
Deloitte
View slide
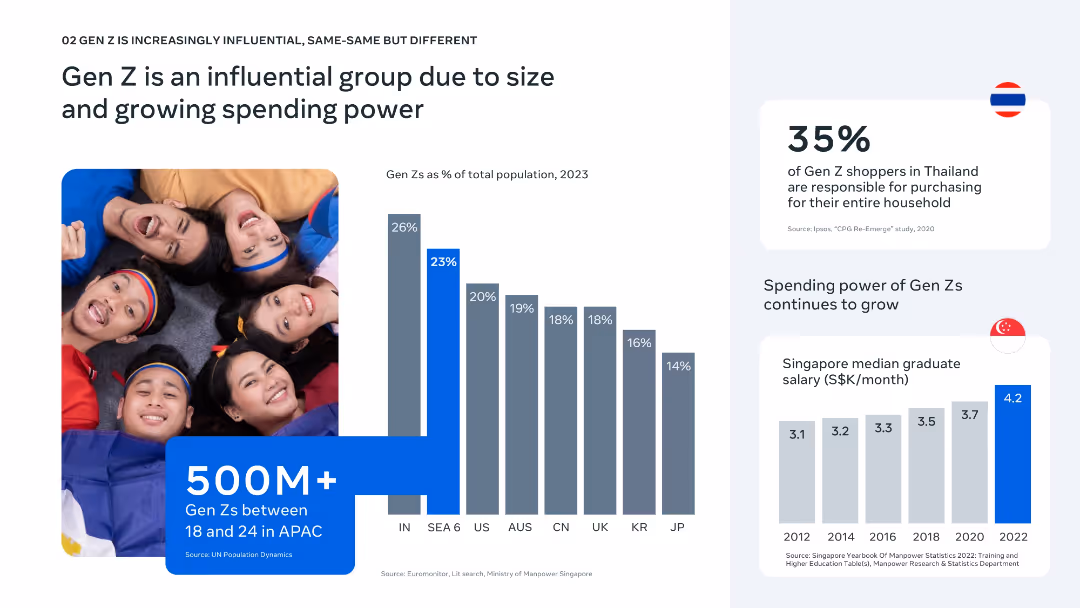
Side-by-side layout with image left, bar charts and stat blocks right; bright, youthful aesthetic.
Customer and Market Segmentation
Consumer Goods
Gen Z represents a significant share of the population in SEA and plays a key purchasing role. The slide includes data on population percentage, purchasing influence, and growing median salaries in Singapore as an example of increasing power.
Gen Z, population, spending power, household influence, APAC, income growth, graduate salary, youth market, Southeast Asia, purchasing behavior
false
Gen Z is an influential group due to size and growing spending powerBold moves: Leading Southeast Asia's next wave of consumer growth
Multiple Chart
Bain
View slide
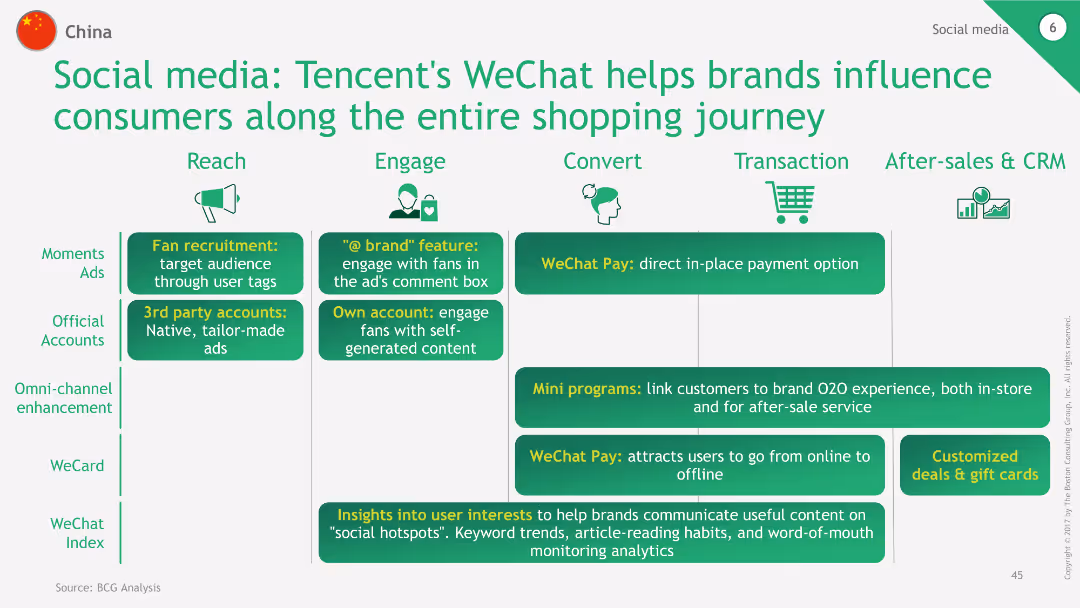
The slide features a process flow diagram illustrating how Tencent's WeChat influences the entire shopping journey from Reach, Engage, Convert, Transaction, to After-sales & CRM. Each stage lists specific WeChat features like Moments Ads, Fan recruitment, WeChat Pay, and Mini programs.
Technology and Digital Transformation
Consumer Goods
This slide outlines Tencent's WeChat capabilities across different stages of the shopping journey, from initial reach and engagement to conversion and after-sales services, showcasing the platform's comprehensive influence on consumer behavior.
WeChat, Tencent, shopping journey, social media, engagement
false
Social media: Tencent's WeChat helps brands influence consumers along the entire shopping journey2018 True-Luxury Global Consumer Insight
Table
BCG
View slide
A concise visual slide outlining various AI use cases, relevant technologies, functions, and industries, paired with benefits highlighted in a box.
Technology and Digital Transformation
Technology & Software
Providing a brief overview of practical AI use cases in different industries and their respective benefits, emphasizing the transformative power of AI.
AI Use Cases, Business Transformation, ML, NLP, Computer Vision, Strategic Planning
false
What are some use cases for applied AIMcKinsey Technology Trends Outlook 2022 Applied AI
Header Vertical
McKinsey
View slide
Shows a line graph with a future state projection and a list of key strategic points, indicating stages of funding optimization.
Operational Efficiency
Financial Services
Discusses strategies for funding optimization for better returns, presented to stakeholders for financial and operational strategy reviews.
Funding Optimization, Strategy, Returns, Financial Planning, Operational Efficiency
false
Funding Optimization to Drive Improved ResultsGoldman Sachs Investor Day
Mixed Chart
Goldman Sachs
View slide
A descriptive list with icons. Blue and white color scheme, with a clear layout.
Technology and Digital Transformation
Healthcare & Pharmaceuticals
Discusses the influence of bioengineering across different industries.
Bioengineering, Industry Influence, Comparative Analysis
false
What industries are most affected by the trend?McKinsey Technology Trends Outlook 2022 Future of bioengineering
Header Vertical
McKinsey
1
...
Next
Load More
Hold On!
We are searching in our database
If nothing, comes up, please try different filters!
Create a FREE account to continue browsing
Receive Instant Access to 1,000+ slides from companies like McKinsey, Google, and Goldman Sachs
First Name
Last Name
Email
Password
I agree to all
Terms & Privacy Policy
Thank you! Your submission has been received!
Oops! Something went wrong while submitting the form.
Have an account?
Sign in
Column Chart
Heatmap
Chevron
Org Chart
Infographic
Callouts
Timeline
List
Graphic
Picture
Process Flow
Diagram
Paragraph
Map
Table
Framework
Subtitle
Takeaway Box
Icon
Other Chart
Radar Chart
Waterfall Chart
Mekko Chart
Pie Chart
Scatter Plot
Line Chart
Bar chart
Bullet points