My Account
My Slides
Search by Category
Templates
View All Templates
Download Template Slides
Leave Feedback
Login
Logout
Get Started
Browse all Slides
Browse all Slides
Create a FREE Account
Instant access to 1,000+ real slides from top companies like McKinsey, BCG, Goldman Sachs, Google and many more!
First Name
Last Name
Email
Password
I agree to all
Terms & Privacy Policy
Thank you! Your submission has been received!
Oops! Something went wrong while submitting the form.
Have an account?
Sign in
Instant access to the internet's best slides
Get access to 40+ advanced filters and more
Advanced Search and Filters
Access to
10,000+ slides
Access to Category Pages
Save/Bookmark Slides
PowerPoint Template Library (New)
Choose your plan
MONTHLY
$12/month
Billed every month, cancel anytime.
YEARLY
$9/month
Billed $108 annually, cancel anytime.
Checkout for $12/month
Checkout for $108/yr
Secured by Stripe | AES-256 bit encryption
Spark Your Next Big Idea with New Presentation Templates
VIEW ALL Templates
Welcome,
Welcome
Upgrade to SlideStart
Pro
Instant access to 15,000+ slides
Show Featured Only
Checkbox 8
Companies
Mckinsey
Bain
BCG
EY
Deloitte
Accenture
PwC/Strategy&
JP Morgan
Goldman Sachs
Morgan Stanley
Citigroup
Deutsche Bank
Barclays
LEK
Kearney
Oliver Wyman
Booz Allen Hamilton
Gartner
IPSOS
Nielsen
Slide type
Header Horizontal
Framework
Vertical Flow
Single Chart
Single Chart
Text Only
Mixed Chart
Header Vertical
Graphic
Pillar
Multiple Chart
Agenda
Title
Table
Linear Flow
Upgrade to SlideStart
Pro
Instant access to 40+ advanced filters
Industry
Upgrade to SlideStart
Pro
Instant access to 40+ advanced filters
Technology
Healthcare
Financial Services
Consumer Goods
Energy & Utilities
Manufacturing
Retail
E-commerce
Logistics
Telecommunications
Real Estate
Professional Services
Education
Media
Entertainment
Hospitatlity
Tourism
Agriculture
Food Production
Government & Public Sector
Environmental
Sustainability
Use Case
Upgrade to SlideStart
Pro
Instant access to 40+ advanced filters
Sales and Business Development
Mergers and Acquisitions
Corporate Finance and Valuation
Performance Metrics and KPIs
Client Case Studies
Competitive Landscape
Product and Service Analysis
Customer and Market Segmentation
Organizational Structure
Human Resources and Talent Management
Industry Overview
Regulatory and Compliance
Risk Assessment and Management
Agriculture & Food Production
Hospitality and Tourism
Government
Environmental
Sustainability
Clear all
Thank you! Your submission has been received!
Oops! Something went wrong while submitting the form.
Show Featured Only
Checkbox 8
Companies
Mckinsey
Bain
BCG
EY
Deloitte
Accenture
PwC/Strategy&
JP Morgan
Goldman Sachs
Morgan Stanley
Citigroup
Deutsche Bank
Barclays
LEK
Kearney
Oliver Wyman
Booz Allen Hamilton
Gartner
IPSOS
Nielsen
Slide type
Text Only
Linear Flow
Vertical Flow
Single Chart
Header Horizontal
Mixed Chart
Header Vertical
Pillar
Multiple Chart
Graphic
Agenda
Title
Table
Framework
Industry
Technology
Healthcare
Financial Services
Consumer Goods
Energy & Utilities
Manufacturing
Retail
E-commerce
Logistics
Telecommunications
Real Estate
Professional Services
Education
Media
Entertainment
Hospitatlity
Tourism
Agriculture
Food Production
Government & Public Sector
Environmental
Sustainability
Use Case
Sales and Business Development
Mergers and Acquisitions
Corporate Finance and Valuation
Performance Metrics and KPIs
Client Case Studies
Competitive Landscape
Product and Service Analysis
Customer and Market Segmentation
Organizational Structure
Human Resources and Talent Management
Industry Overview
Regulatory and Compliance
Risk Assessment and Management
Agriculture & Food Production
Hospitality and Tourism
Government
Environmental
Sustainability
Clear all
Thank you! Your submission has been received!
Oops! Something went wrong while submitting the form.
Tag
View slide
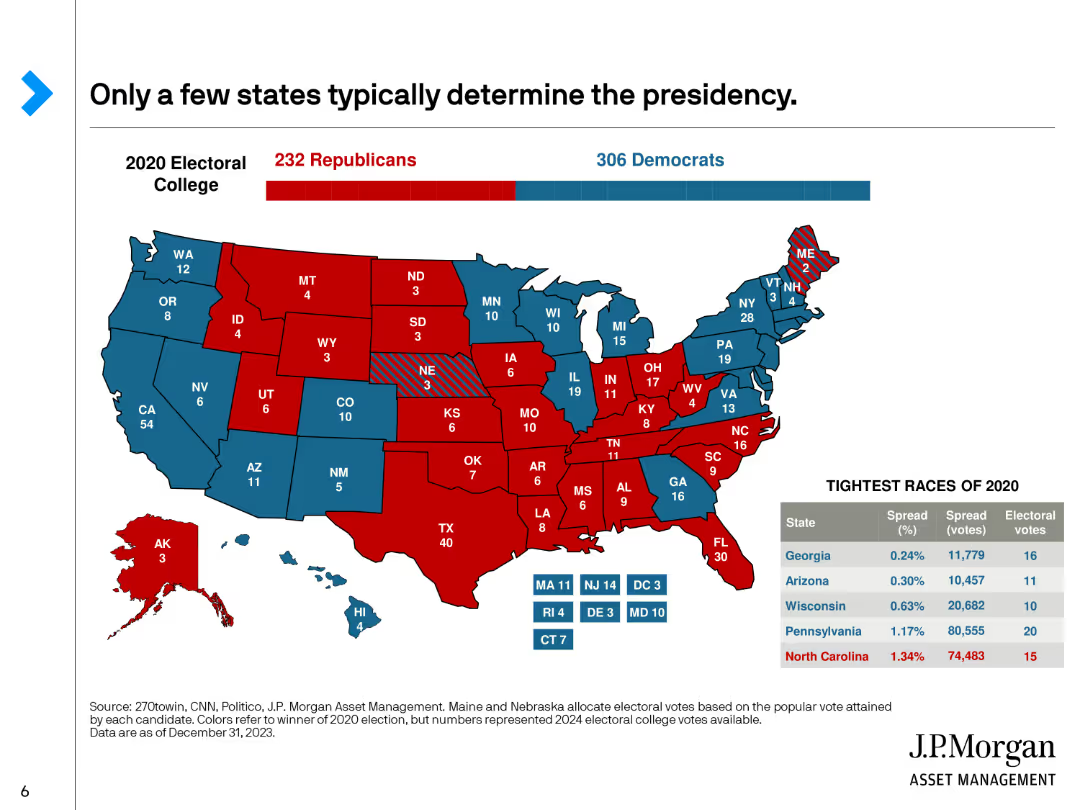
A U.S. map showing the 2020 Electoral College results by state with red and blue colors, along with a table listing the tightest races in key states.
Market Analysis and Trends
Government & Public Sector
Highlights the importance of swing states in determining the U.S. presidency, showing the electoral votes and margins in critical states from the 2020 election.
Swing States, Electoral College, Presidency, 2020, Key States
false
Only a few states typically determine the presidency.2024 Election
Graphic
JP Morgan
View slide
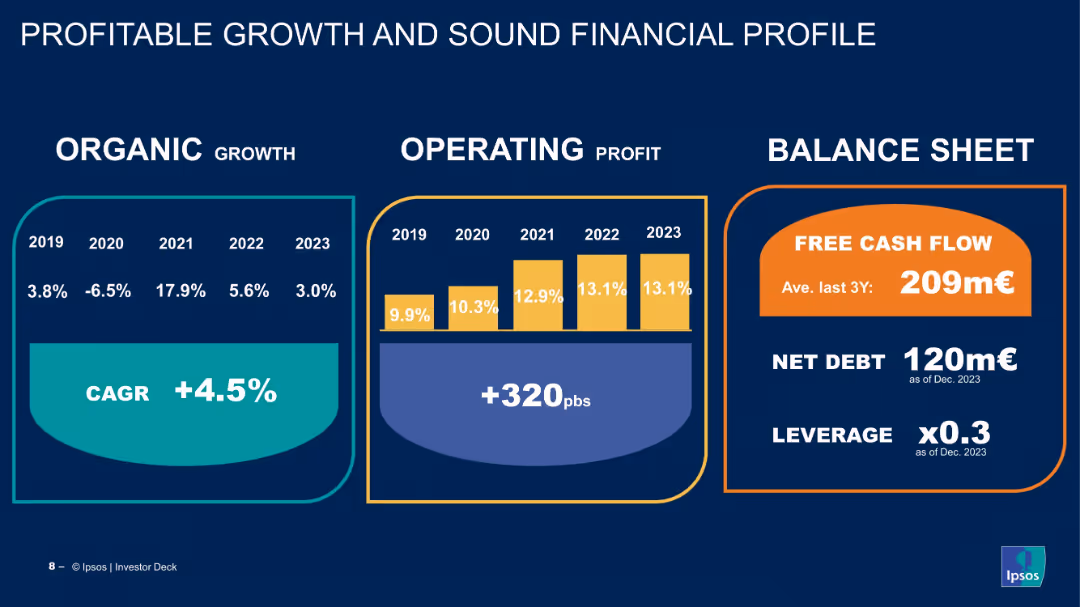
Three-panel infographic showing organic growth, operating profit, and balance sheet strength.
Financial Performance
Financial Services
The slide presents financial metrics from 2019–2023, demonstrating consistent operating margin growth and healthy cash flow, debt, and leverage indicators, reinforcing Ipsos’ financial strength.
financials, CAGR, profit margin, free cash flow, leverage, organic growth, Ipsos, performance metrics, investor information
false
PROFITABLE GROWTH AND SOUND FINANCIAL PROFILEINTRODUCTION TO IPSOS
Mixed Chart
IPSOS
View slide
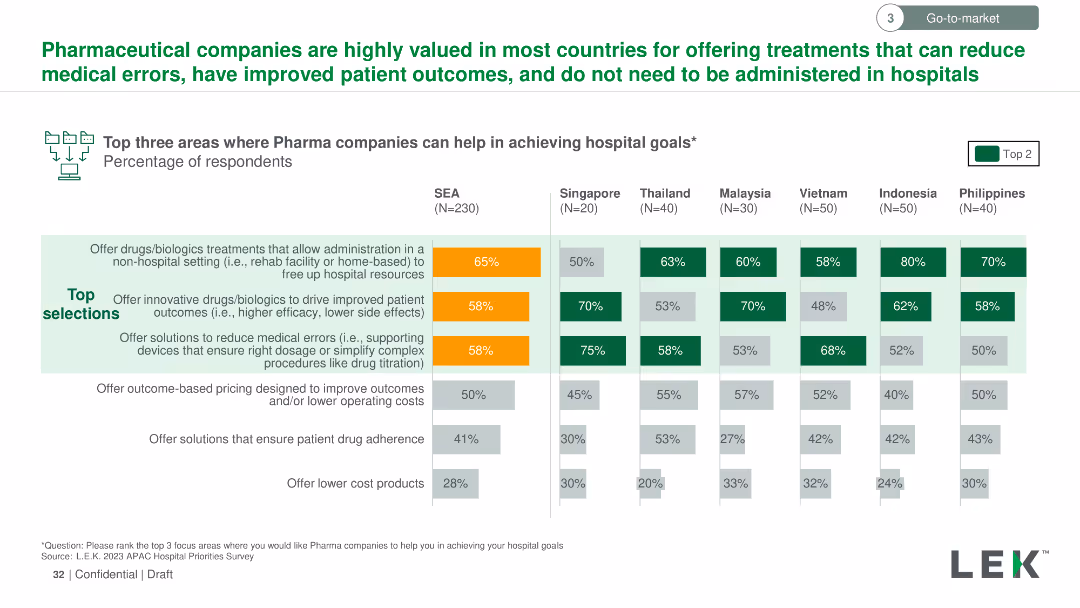
The slide uses a column chart to show the percentage of respondents selecting top areas where pharmaceutical companies can help achieve hospital goals across multiple countries. Key areas highlighted with orange and green colors.
Strategic Planning
Healthcare & Pharmaceuticals
The slide illustrates the top three areas where pharmaceutical companies can aid hospitals, focusing on non-hospital drug administration, innovative drug solutions, and medical error reduction. Data is broken down by country in Southeast Asia.
Pharmaceutical, hospitals, goals, respondents, percentage, non-hospital, innovative, error reduction
false
Pharmaceutical companies are highly valued in most countries for offering treatments that can reduce medical errors, have improved patient outcomes, and do not need to be administered in hospitals2023 SEA Hospital Insights Survey Findings Summary materials
Multiple Chart
LEK
View slide
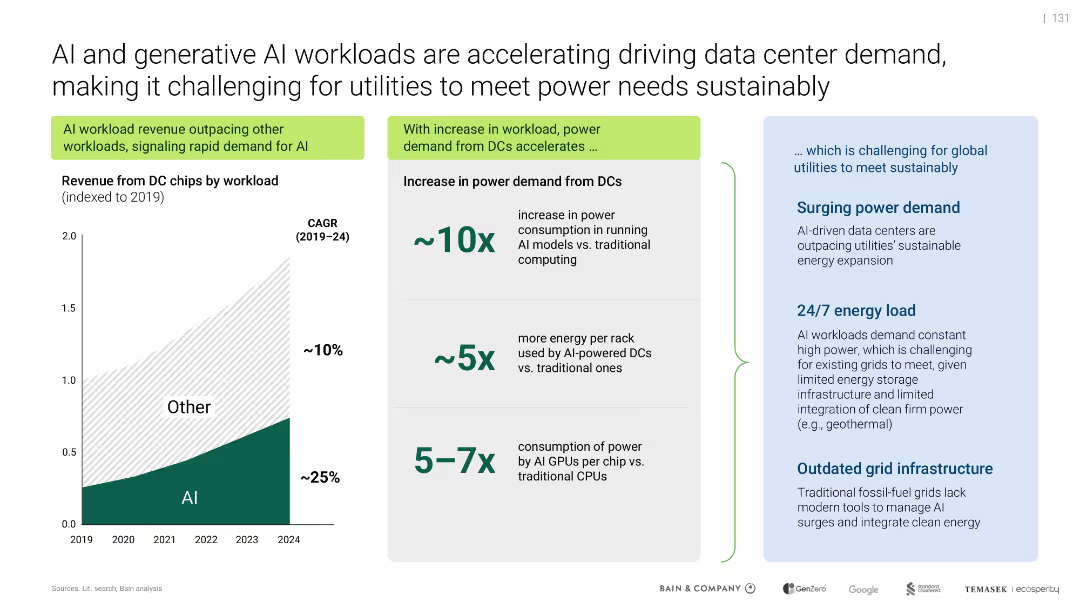
Split layout: left-side line chart on AI chip revenue; right-side infographic of power consumption increases; blue highlight box outlines utility challenges.
Operational Efficiency
Artificial Intelligence
Shows exponential growth in AI workloads, causing power demand to surge (10x more than traditional). Highlights strain on global utilities and grid systems due to constant AI processing and outdated infrastructure.
AI workload, power demand, utilities, grid, GPUs, sustainability
false
AI and generative AI workloads are accelerating driving data center demand, making it challenging for utilities to meet power needs sustainablySoutheast Asia's Green Economy
Mixed Chart
Bain
View slide
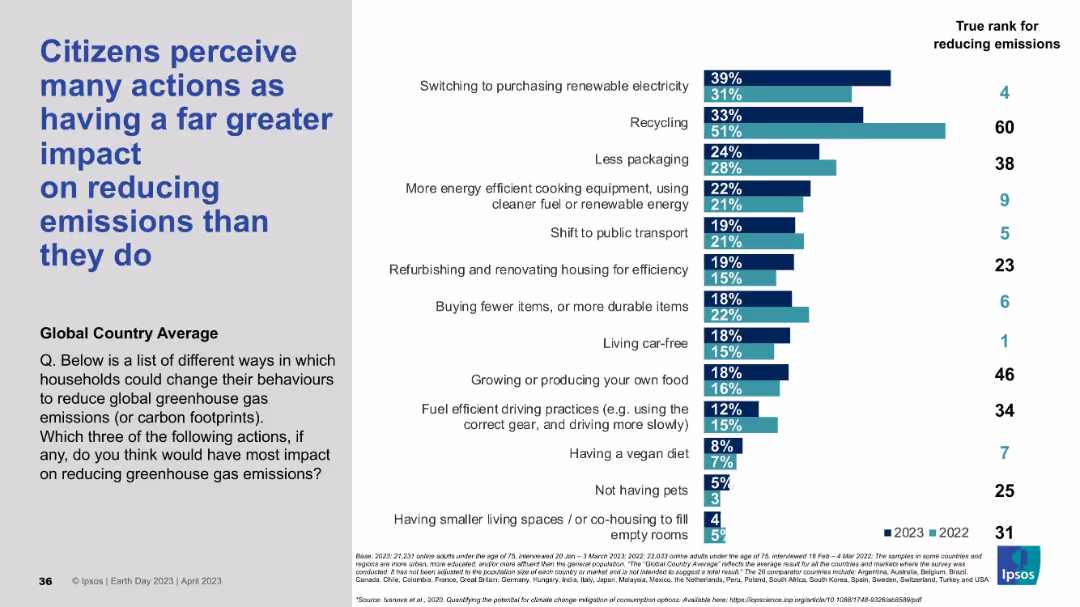
Title left-aligned; right side shows a bar chart comparing perceived vs actual impact ranks of various climate-related actions.
Market Analysis and Trends
Environmental Services & Sustainability
This slide reveals the mismatch between public perception and actual effectiveness of household actions on reducing emissions. Actions like recycling are overrated, while more impactful behaviors like living car-free are underrated. Data is shown across two years with actual ranks.
emissions, public perception, recycling, climate action, emission reduction, behavioral change, global survey, Ipsos, misperception
false
Citizens perceive many actions as having a far greater impact...EARTH DAY 2023
Mixed Chart
IPSOS
View slide
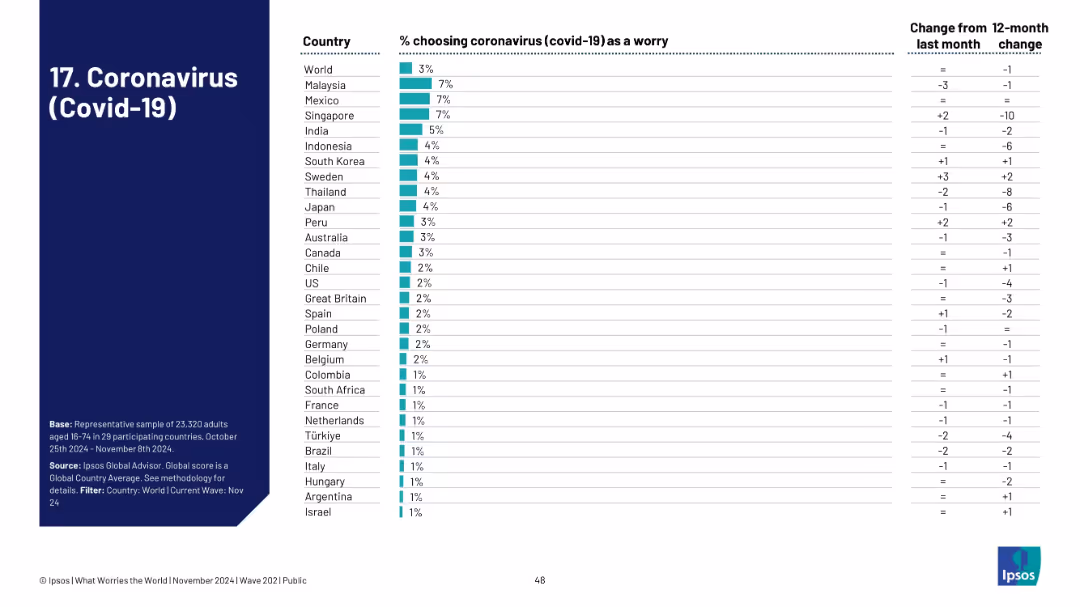
Bar chart format, showing low concern levels for Covid-19 globally; tracks change over time.
Regulatory and Compliance
Healthcare & Pharmaceuticals
Displays a significant drop in public concern over Covid-19, with most countries under 5%. The world average is 3%, signaling a diminished pandemic focus as the world adapts to post-pandemic normalcy.
Covid-19, pandemic, healthcare concern, public health, survey, Ipsos, recovery, disease awareness, compliance, perception
false
17. Coronavirus (Covid-19)What Worries the World
Single Chart
IPSOS
View slide
The slide displays a combination of icons and column charts in green shades, illustrating the types of shortages (hospital beds, supplies, medical staff) and the utilization of ICU beds in the U.S. during different COVID-19 waves. The design is clear, with direct comparisons between the first and current waves.
Strategic Planning
Healthcare & Pharmaceuticals
Discusses the pressure on hospital systems due to surging COVID-19 cases, showing data on ICU utilization and the types of resource shortages. It serves as an analysis tool to understand the strain on healthcare infrastructure during different pandemic waves.
COVID-19, hospitals, ICU, healthcare, shortages, cases, pressure
false
Hospital systems under immense pressure as cases surgeCOVID-19 BCG Perspectives State of the World
Mixed Chart
BCG
View slide
Similar to slide 11, with the addition of 'Opportunities' in a third column; uses a simple and clean layout.
Strategic Planning
Financial Services
Strategic insights into future business development, focusing on opportunities stemming from secular changes.
Business Development, Opportunities, Strategy, Future
false
Evolving Our Business for the FutureGoldman Sachs Investor Day
Linear Flow
Goldman Sachs
View slide
This slide features a title, a column chart about average attendances in FCoA and FCC from 2012-2017. A side note emphasizes a 45% higher attendance in FCoA. Icons representing legal elements are present. Red and black colors dominate, with annotations for clarity.
Regulatory and Compliance
Government & Public Sector
The slide compares court attendances between FCoA and FCC over five years, highlighting the significantly higher attendance required by litigants in the FCoA, with cost implications and details on case management practices.
FCoA, FCC, court attendances, final order finalisation, litigation costs, pre-trial management
false
Family law finalisationsReview of efficiency of the operation of the federal courts
Mixed Chart
PwC/Strategy&
View slide
Scatter plot correlating the S&P 500 share of oil and gas with Brent oil prices over time, differentiated between 2000-2015 and 2016-June 2019.
Market Analysis and Trends
Financial Services
This slide presents the declining trend of oil and gas industries' share in the S&P 500 index relative to oil prices, suggesting shifts in energy sector valuations influenced by market and price factors.
oil, gas, S&P 500, market trends, Brent oil
false
Oil & Gas share of S&P 500 is shringing…Climate Change: BCG’s Perspectives and Offerings
Single Chart
BCG
View slide
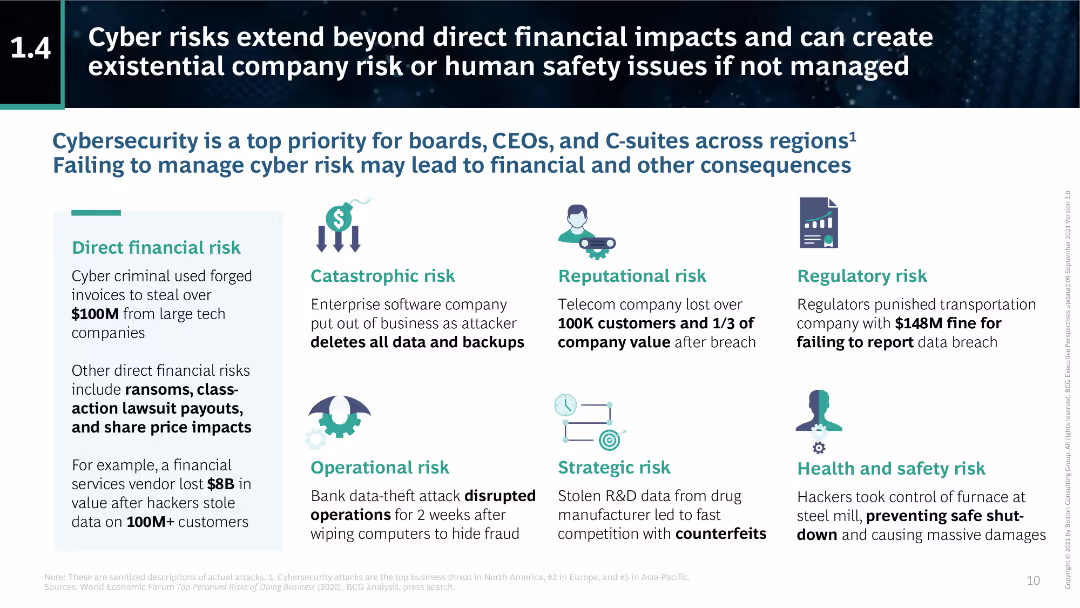
The slide includes various icons and text blocks detailing different types of cyber risks, such as direct financial risk, catastrophic risk, and reputational risk.
Risk Assessment and Management
Technology & Software
This slide discusses the broader implications of cyber risks, extending beyond direct financial impacts to include catastrophic, reputational, regulatory, and health and safety risks. It underscores the importance of comprehensive cybersecurity measures.
cyber risks, financial impact, catastrophic risk, reputational risk, regulatory risk, health and safety, cybersecurity, BCG
false
Cyber risks extend beyond direct financial impacts and can create existential company risk or human safety issues if not managedThe CEO’s Guide to Cybersecurity
Header Vertical
BCG
View slide
A split-layout design showcasing how organizations perceive their technology investments' impact on transformation programs. A bar graph titled "Reinventors capitalize on their investments in the digital core" depicts responses to technology's enabling role in transformations, with associated commentary.
Investment Analysis
Technology & Software
Positioned to evaluate the effectiveness of digital investments in corporate transformation initiatives, this slide aids in assessing the role of technology in operational strategy, signaling to leaders the high value placed on digital foundations in current business environments.
digital investment, transformation, technology, enabler, strategy, operational efficiency
false
Reinventors capitalize on their investments in the digital coreTotal Enterprise Reinvention
Single Chart
Accenture
View slide
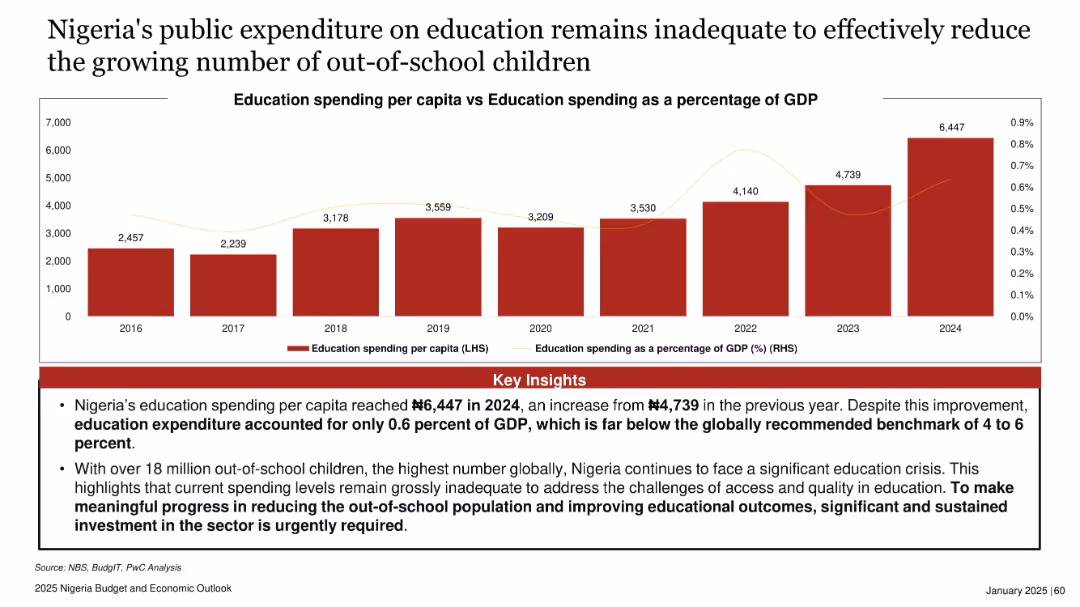
Bar chart showing education spending per capita (2016–2024) and line showing percentage of GDP. Red theme with emphasis on key insights.
Regulatory and Compliance
Education & Training
The slide criticizes Nigeria’s education funding, showing low per capita spending and GDP share. Despite increases, the current levels are far below global benchmarks. With 18 million out-of-school children, major investment is urgently needed.
education, spending, GDP, Nigeria, out-of-school children, budget, policy, 2024 data
false
Nigeria's public expenditure on education remains inadequate to effectively reduce the growing number of out-of-school children2025 Nigeria Budget and Economic Outlook
Mixed Chart
PwC/Strategy&
View slide
Bar chart displaying the age distribution of startup founders in the U.S., distinguishing between all startups and high-growth startups. Text boxes provide key statistics on founders' ages.
Market Analysis and Trends
Professional Services
Challenges the common belief that most successful startup founders are young, showing that founders are typically older. Useful in discussions about entrepreneurship and age demographics.
startups, entrepreneurship, age, myths, data
false
The “young entrepreneur” is a mythBrazil Digital Report
Single Chart
McKinsey
View slide
Features a collection of bar and tables that display financial results and revenue streams, accompanied by dense numerical data and textual summaries of key fiscal details for Deutsche Bank's Investment Bank.
Financial Performance
Financial Services
This slide reviews the Q2 2023 financial outcomes for Deutsche Bank's Investment Bank, focusing on revenue streams and major fiscal indicators like adjusted costs and profit before tax.
Investment banking, financial results, revenue analysis, fiscal indicators, Deutsche Bank, Q2 2023
false
Investment Bank In € m, unless stated otherwiseQ2 2023 results
Mixed Chart
Deutsche Bank
View slide
Comprising column charts, a table, and metrics presented in a well-organized manner, this slide compares net interest income and loans across different sectors.
Operational Efficiency
Financial Services
Examines the net interest income by segment, detailing loan categories and providing metrics on the allocation and growth of loans. It serves to analyze financial health and operational efficiency within the company's loan management strategy.
Net Interest, Loans, Financial Health, Operational Efficiency, Metrics
false
Net Interest Income and Loans Net Interest Income by Segment ($ in millions)Full Year and Fourth Quarter 2020 Earnings Results Presentation
Multiple Chart
Goldman Sachs
View slide
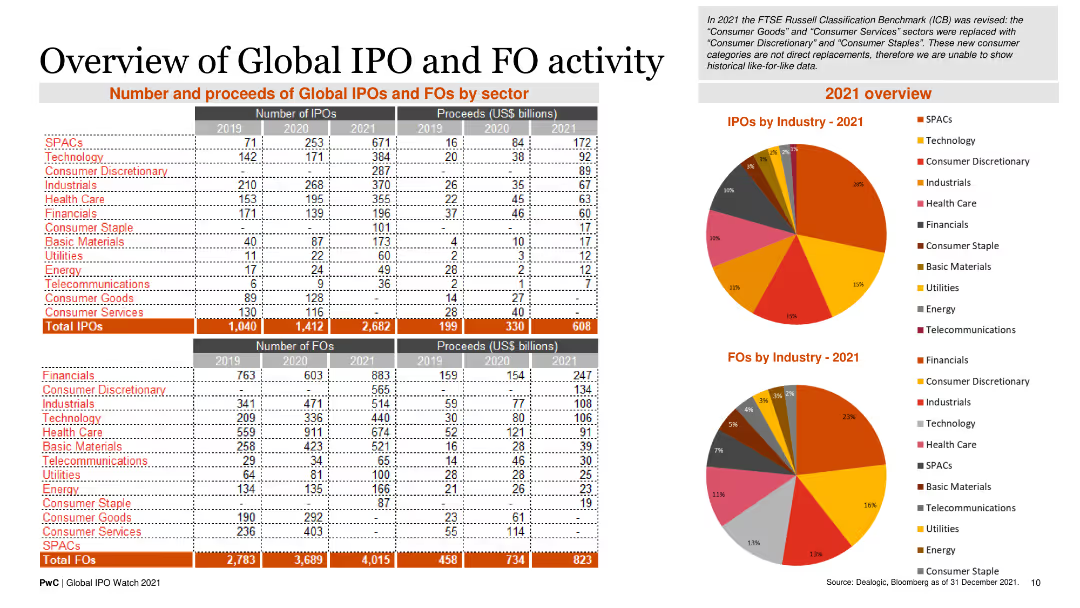
The slide comprises tables and pie charts showing the number and proceeds of global IPOs and FOs by sector for the years 2019, 2020, and 2021, along with sector breakdowns.
Market Analysis and Trends
Financial Services
It provides a comprehensive overview of IPO and FO activities by sector, including total numbers and proceeds, along with sector-specific insights.
IPOs, FOs, sector analysis, global trends, financial data
false
Overview of Global IPO and FO activityGlobal IPO Watch 2021 A PwC Global IPO Centre publication
Multiple Chart
PwC/Strategy&
View slide
Slide features a bar chart illustrating the main challenges organizations face in their transition to ESG-focused operations. Challenges such as lack of expertise and policy incentives are shown, with bars horizontally displayed.
Risk Assessment and Management
Environmental Services & Sustainability
Highlights the significant barriers to adopting ESG practices within organizations, including gaps in expertise and insufficient governmental support. This insight is crucial for understanding the hurdles that companies must overcome to fully integrate ESG principles into their business strategies.
ESG, challenges, transition, barriers, 2023
false
Lack of expertise, policy incentives and funding are major hurdles in the path to ESG transitionAFF 2023 HKTDC and PwC’s Joint Pulse Survey
Single Chart
PwC/Strategy&
View slide
The slide features a complex graph plotting activities by enjoyment and time, with a dotted trend line indicating an increase in work-related activities during COVID-19.
Market Analysis and Trends
Technology & Software
It explores the significant increase in time spent on work-related services over the nbn network due to the pandemic, with a focus on LinkedIn, emails, and web browsing.
COVID-19, nbn network, work activities, time increase, remote work, online engagement, LinkedIn, emails
false
During COVID-19, time spent using work related services over the nbnTM network increased by up to 175%Accenture Consumer Value Report 2021
Multiple Chart
Accenture
View slide
Horizontal timeline with four phases of business transformation, each phase marked with milestones and client asset goals.
Strategic Planning
Financial Services
Outlines Morgan Stanley's business transformation journey over time, detailing key phases and growth in client assets.
Morgan Stanley, business transformation, timeline, client assets, strategy
false
We Have Steadily Transformed the Business Over TimeAchieving 30% Margins Through Growth
Linear Flow
Morgan Stanley
View slide
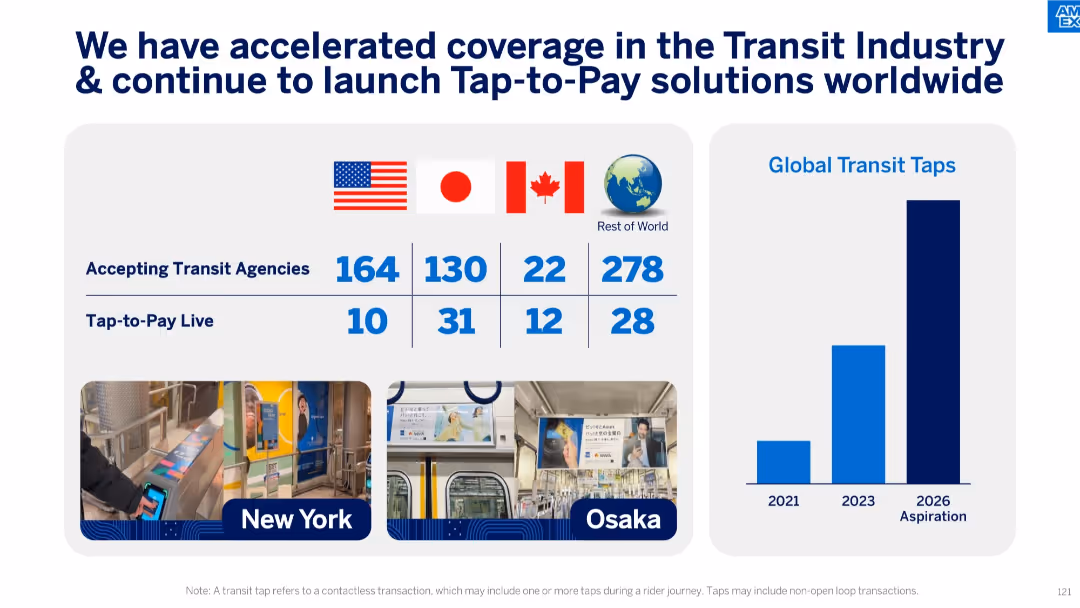
Grid and bar chart layout with flag indicators and tap-to-pay adoption stats, plus transport images.
Technology and Digital Transformation
Transportation & Logistics
Focused on the adoption of tap-to-pay transit solutions globally, the slide lists agencies across countries and growth in transit taps. It highlights major cities like New York and Osaka, underlining ongoing innovation in payment tech.
tap-to-pay, transit, agencies, contactless payments, Amex, transportation, digital payment, global adoption
false
We have accelerated coverage in the Transit Industry & continue to launch Tap-to-Pay solutions worldwideAmerican Express Investor Day 2024
Mixed Chart
McKinsey
View slide
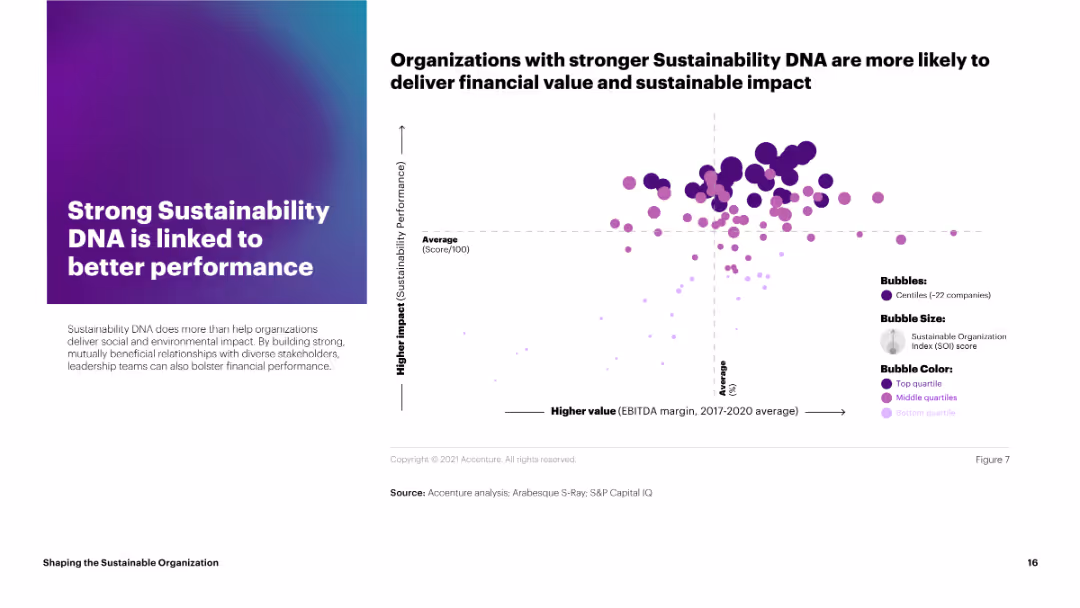
This slide features a bubble chart linking sustainability performance scores to EBITDA margins for various companies. The bubbles are color-coded by quartile and vary in size.
Strategic Planning
Environmental Services & Sustainability
The slide demonstrates that organizations with stronger sustainability DNA tend to achieve better financial performance, linking higher sustainability scores to improved EBITDA margins.
sustainability, performance, EBITDA, bubble chart, quartiles
false
Organizations with stronger Sustainability DNA are more likely to deliver financial value and sustainable impactShaping the Sustainable Organization
Mixed Chart
Accenture
View slide
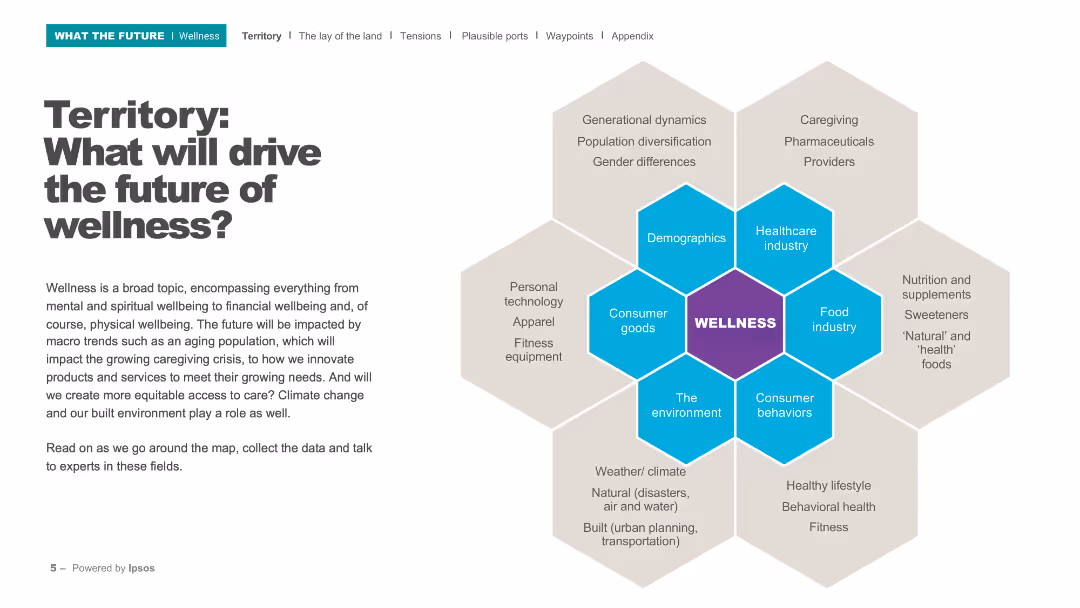
This slide contains a hexagonal diagram with 'Wellness' at the center, surrounded by key drivers such as demographics, healthcare industry, consumer goods, and the environment.
Strategic Planning
Healthcare & Pharmaceuticals
The slide outlines the various factors that will shape the future of wellness, including demographic shifts, technological advancements, and environmental factors. It sets the stage for a discussion on wellness trends.
Wellness, future trends, demographics, healthcare, environment
false
Territory: What will drive the future of wellness?WHAT THE FUTURE: WELLNESS
Diagram
IPSOS
View slide
Features a map of the UK with key points listed about market growth, emphasizing the UK's strengths such as regulatory environment and London as a financial centre.
Market Analysis and Trends
Financial Services
The slide argues for the strategic timing of expanding financial operations in the UK, emphasizing national economic resilience, strong regulatory frameworks, and London’s role as a global financial hub, supporting a strategic business decision for market expansion.
UK Market, Growth, Strategy, Financial Hub
false
Now is the right time to grow in our UK home marketFY 2023 Results Announcement
Graphic
Barclays
View slide
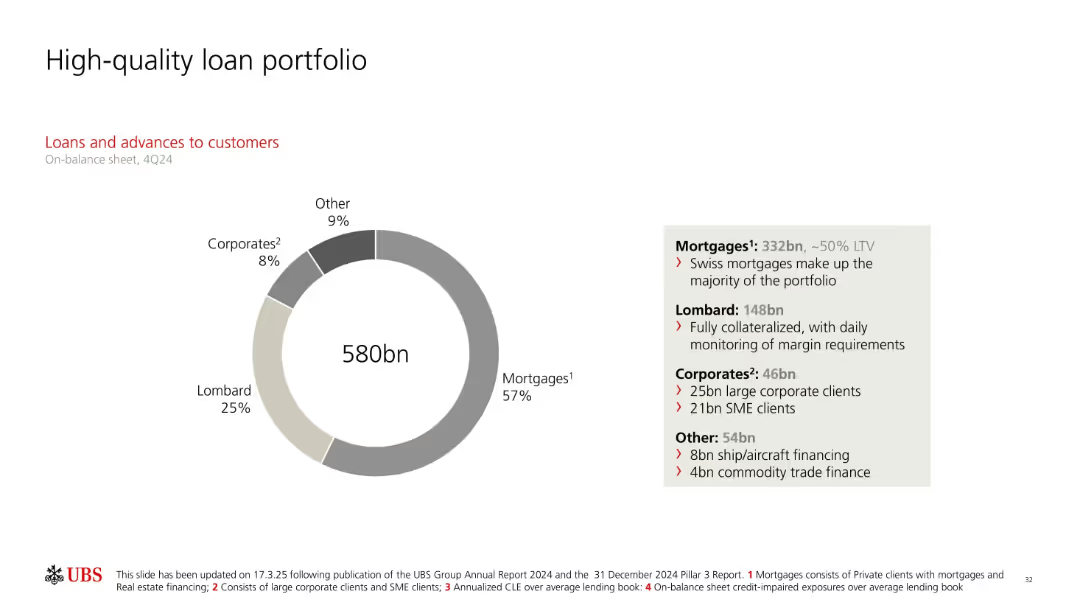
Donut chart showing loans and advances to customers (580bn) segmented by mortgage, Lombard, corporates, and others. Text box explains loan quality, collateralization, and exposure types.
Product and Service Analysis
Financial Services
Shows UBS’s 4Q24 customer loan portfolio composition, emphasizing the dominance of mortgages and Lombard loans. Details on collateral coverage, corporate loan segmentation, and other smaller loan types like aircraft and trade finance are included to support asset quality narrative.
loans, mortgages, Lombard, corporates, UBS, LTV, secured lending
false
High-quality loan portfolioFull-year and fourth quarter 2024 Fixed Income investor presentation
Mixed Chart
UBS
View slide
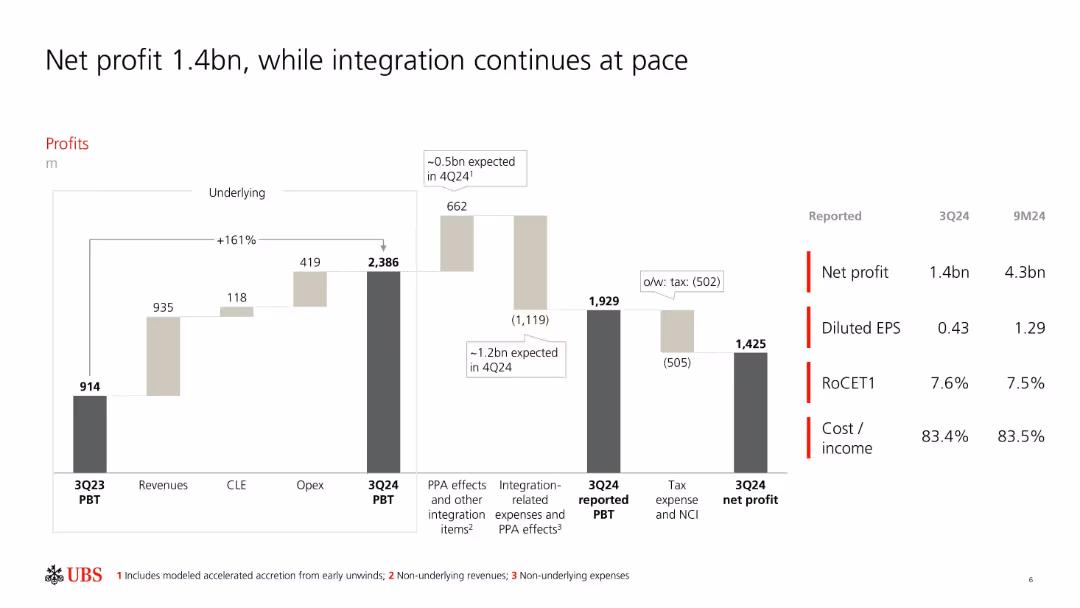
Waterfall bar chart with segment-wise contribution to PBT and net profit; metrics listed on the right.
Financial Performance
Financial Services
Shows a detailed breakdown of UBS's Q3 2024 profit progression including revenues, costs, integration expenses, and tax effects. It also lists reported metrics like EPS, RoCET1, and cost/income ratio to communicate financial health.
net profit, EPS, integration, PBT, cost/income, RoCET1, UBS, Q3 2024
false
Net profit 1.4bn, while integration continues at paceThird quarter 2024 Fixed Income investor presentation
Single Chart
UBS
View slide
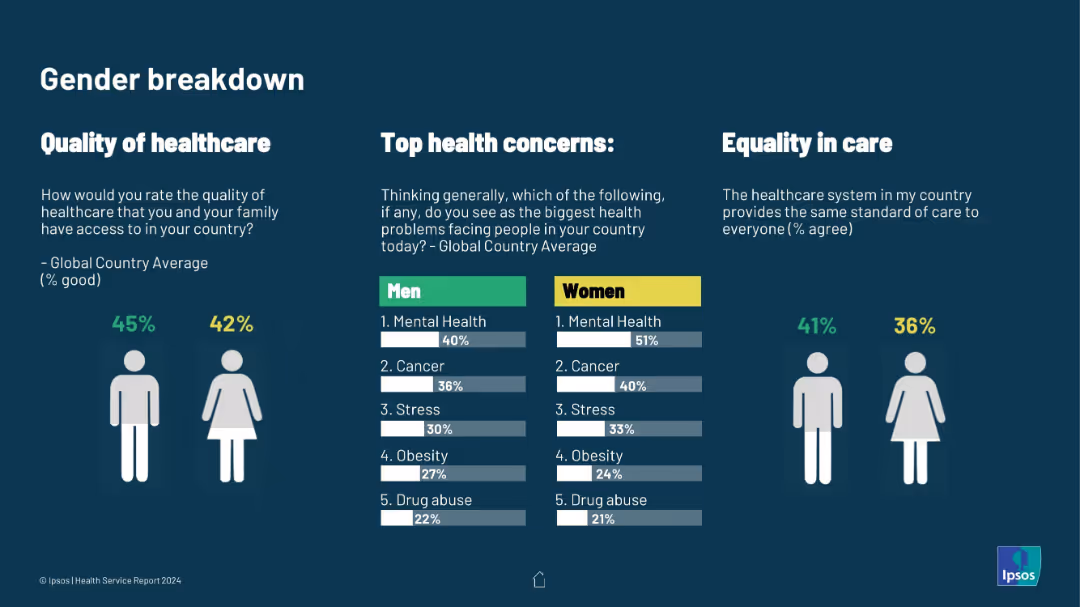
Clean infographic with male/female icons and horizontal bar charts. Covers quality perception, top health concerns, and care equality
Customer and Market Segmentation
Healthcare & Pharmaceuticals
Gender-specific breakdown of healthcare perception and concerns. Women more frequently cite mental health as a top concern; equality in care is also shown to be lower for women.
gender differences, healthcare quality, mental health, health priorities, care equity, Ipsos health data, public perception
false
Gender breakdownIPSOS HEALTH SERVICE REPORT 2024
Multiple Chart
IPSOS
View slide
Multiple boxes and arrows illustrating liquidity coverage ratio, net stable funding ratio, regulatory minimums, stress testing, governance, and contingency planning.
Risk Assessment and Management
Financial Services
Explains UBS's risk management framework, including regulatory requirements, liquidity and funding strategies, and stress testing.
Risk Management, Liquidity, Funding, UBS, Governance
false
UBS Liquidity & Funding (Risk Management) FrameworkThird quarter 2023 Fixed Income investor presentation
Framework
UBS
View slide
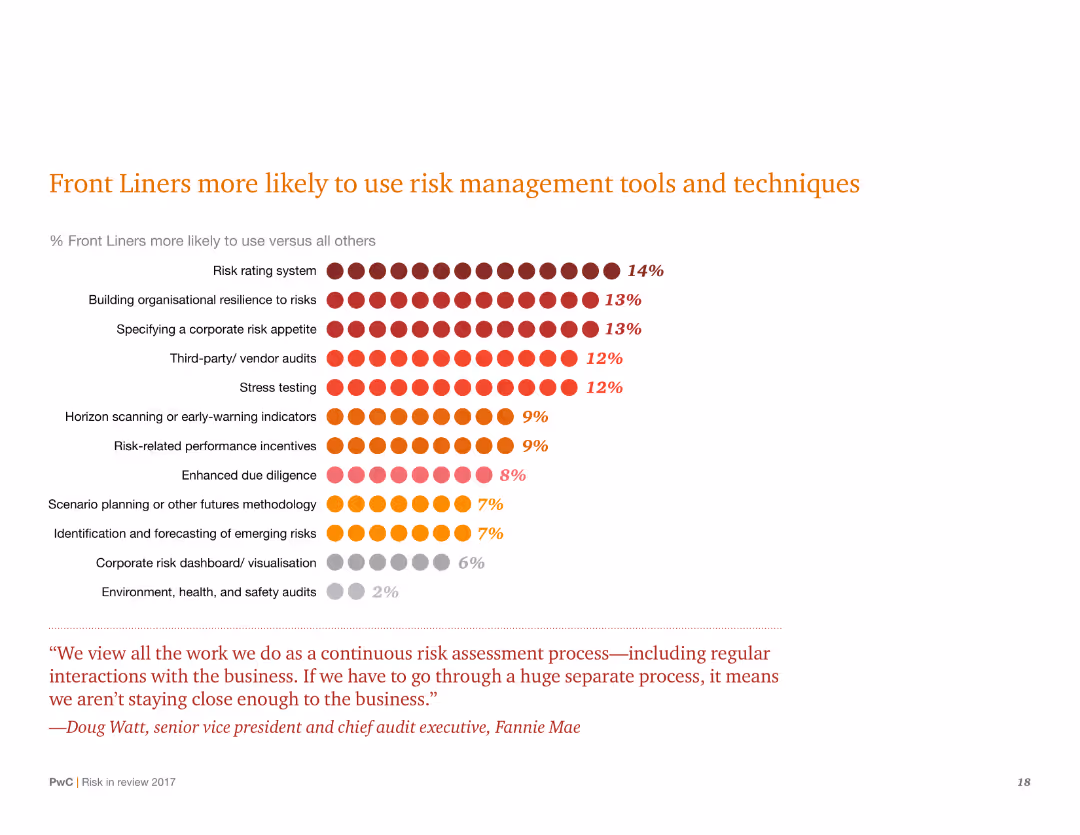
A chart slide with a dot matrix representing the percentage of Front Liners using various risk management tools. There is also a quote at the bottom.
Risk Assessment and Management
Financial Services
Highlights the percentage of Front Liners using different risk management tools. Emphasizes building organizational resilience and risk rating systems among other techniques.
Risk management, Front Liners, resilience, tools, techniques, percentages, chart, risk rating, organizational
false
Front Liners more likely to use risk management tools and techniquesRisk in review Managing risk from the front line
Mixed Chart
PwC/Strategy&
View slide
The slide presents layered blocks in gradient colors representing strategic interventions across different types of shoppers to drive growth in digital transactions.
Strategic Planning
Retail & E-commerce
This slide outlines strategic actions for digital transaction growth, targeting non-buyers, occasional, and frequent shoppers with tailored approaches such as simplification, attractive propositions, and loyalty incentives.
Digital transactions, growth strategies, e-commerce
false
Key interventions for driving growth in digital transactionsDigital consumer spending in India: A $100 Bn opportunity
Pillar
BCG
View slide
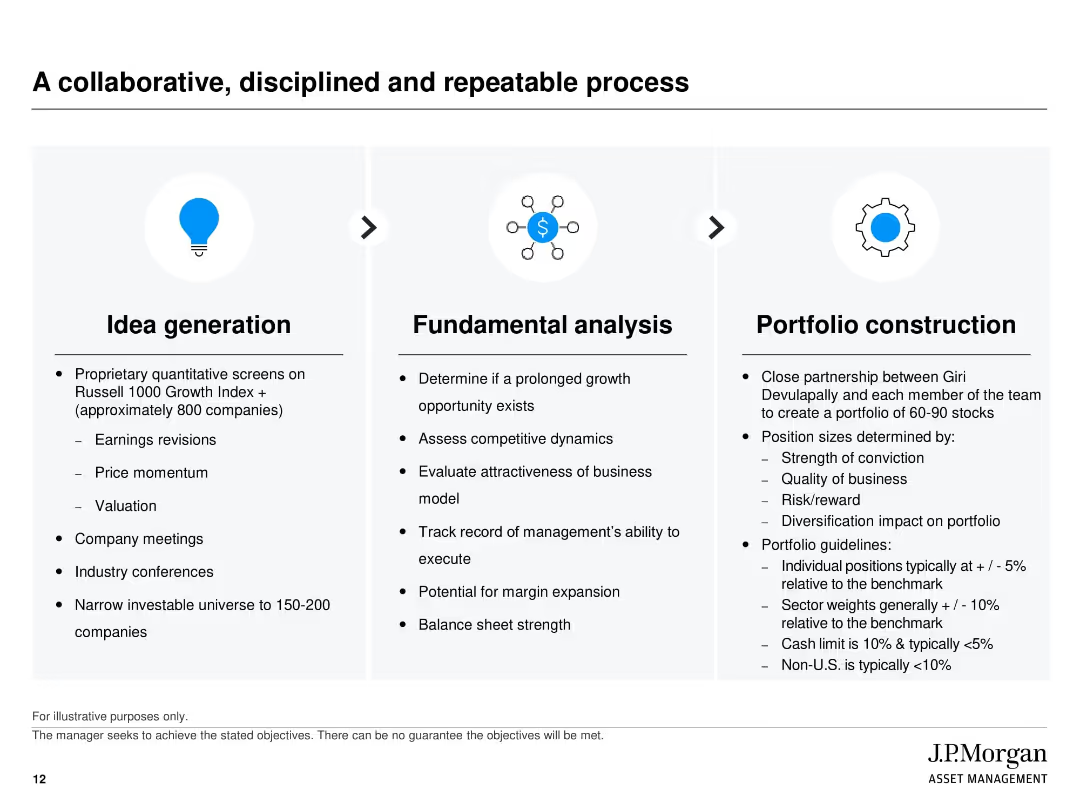
Three-column horizontal flow (Idea generation → Fundamental analysis → Portfolio construction); icons and bullet points for each stage
Technology and Digital Transformation
Financial Services
This slide outlines the investment process used by J.P. Morgan’s Large Cap Growth Strategy team, covering idea generation, analysis, and portfolio construction. It emphasizes discipline, data-driven screening, risk evaluation, and position sizing techniques.
Investment process, portfolio management, stock screening, idea generation, risk management, valuation, fundamentals
false
A collaborative, disciplined and repeatable processJ.P. Morgan Large Cap Growth Strategy Separately Managed Account
Linear Flow
JP Morgan
View slide
The slide features vertical bar charts comparing survey responses by age groups on their concerns about technology and internet reliance.
Market Analysis and Trends
Technology & Software
The slide presents data showing that younger people are more likely to express concerns about technology and their dependency on the internet.
Technology concerns, age groups, internet reliance, public opinion, survey
false
Disquiet about technology is somewhat more prevalent among younger peopleA NEW WORLD DISORDER?
Multiple Chart
IPSOS
View slide
Slide features image-focused layout discussing the importance of personalization in consumer interactions, with a timeline of increasing trend relevance.
Product and Service Analysis
Retail & E-commerce
Analyzes how personalization in digital spaces is shaping consumer experiences, appealing strongly to Gen X and Millennials.
personalization, consumer experiences, Gen X, Millennials, digital
false
Functional Nextatlas Insight In a world of limitless options, people crave personalized experiences that speak to their unique individualityDigital Revolution Awards
Multiple Chart
Bain
View slide
The slide features a column chart comparing U/HNW wealth pool growth between APAC and the rest of the world. Additional metrics show the significant share of client wallet held by top firms in the region, with supporting bullet points on key trends.
Market Analysis and Trends
Financial Services
The slide projects substantial wealth growth in Asia, with top firms capturing a large share of client wallets. It highlights the trends driving this growth, including the rise of first and second-generation entrepreneurs and the increasing management of wealth pools by top players.
Asia, wealth growth, client wallet, top players, market trends
false
Asia wealth projected to grow, with outsized share to top playersCredit Suisse Investor Day 2019 Growth in Wealth Management
Multiple Chart
Credit Suisse
View slide
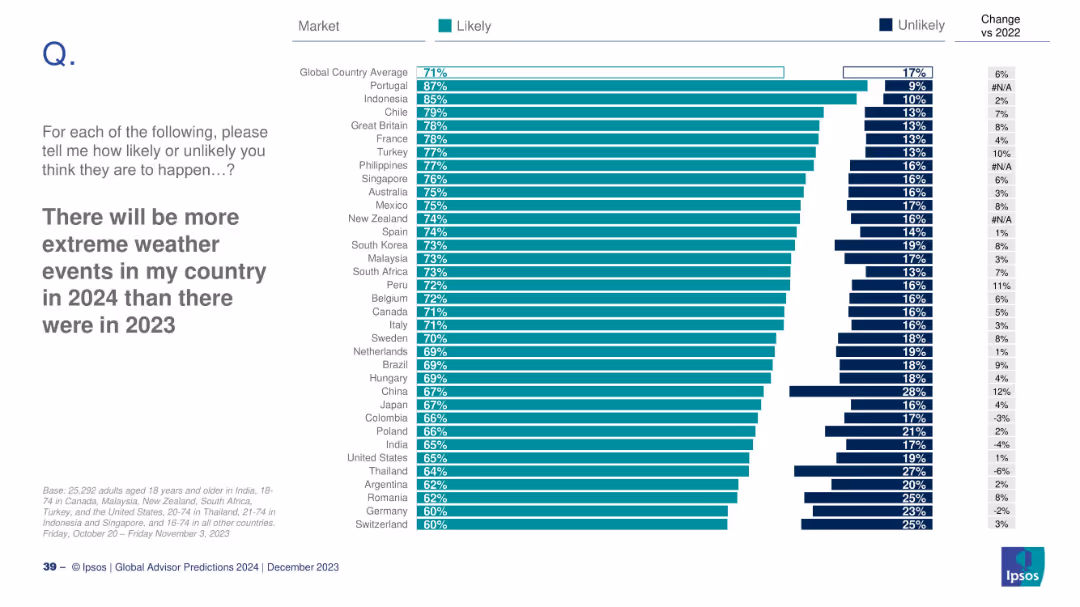
Country-level bar chart for likelihood of extreme weather; includes change from 2022.
Risk Assessment and Management
Environmental Services & Sustainability
This slide analyzes how likely people believe extreme weather events will increase in 2024 compared to 2023. Portugal and Indonesia top the list with strongest agreement. Changes from 2022 perceptions are also indicated.
extreme weather, climate change, environmental risk, Ipsos, survey, country opinion
false
There will be more extreme weather events in my country in 2024 than there were in 2023GLOBAL ADVISOR 2024 PREDICTIONS
Mixed Chart
IPSOS
View slide
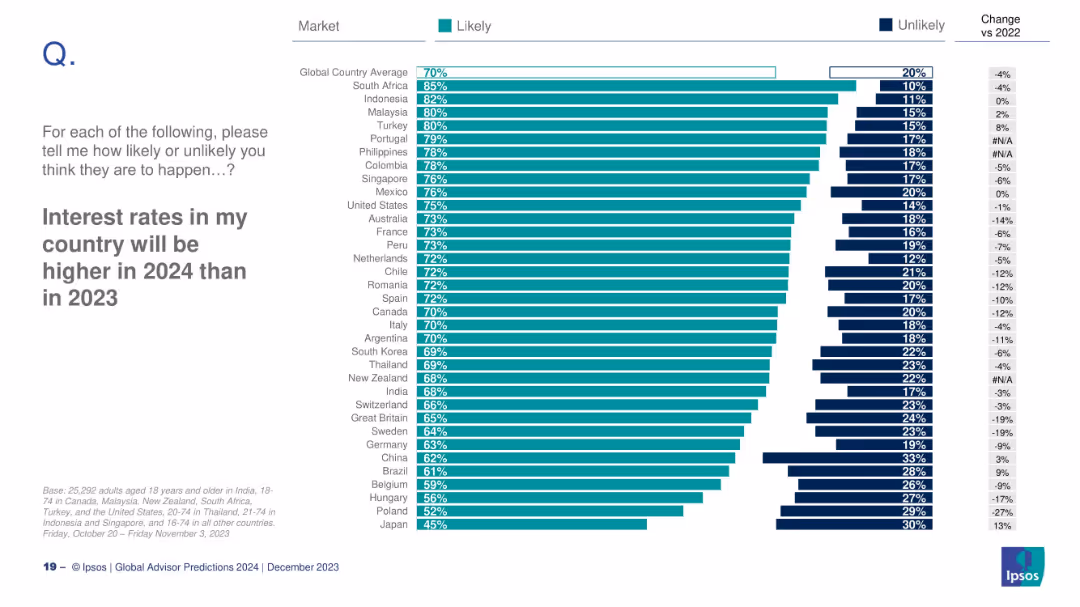
Horizontal bar chart ranking countries by likely/unlikely expectations of rising interest rates
Market Analysis and Trends
Financial Services
A visual representation of global sentiment toward expected interest rate increases in 2024. The slide breaks down likely vs. unlikely perceptions by country and includes year-over-year change from 2022.
interest rates, economic forecast, monetary policy, countries, trend
false
Interest rates in my country will be higher in 2024 than in 2023GLOBAL ADVISOR 2024 PREDICTIONS
Mixed Chart
IPSOS
View slide
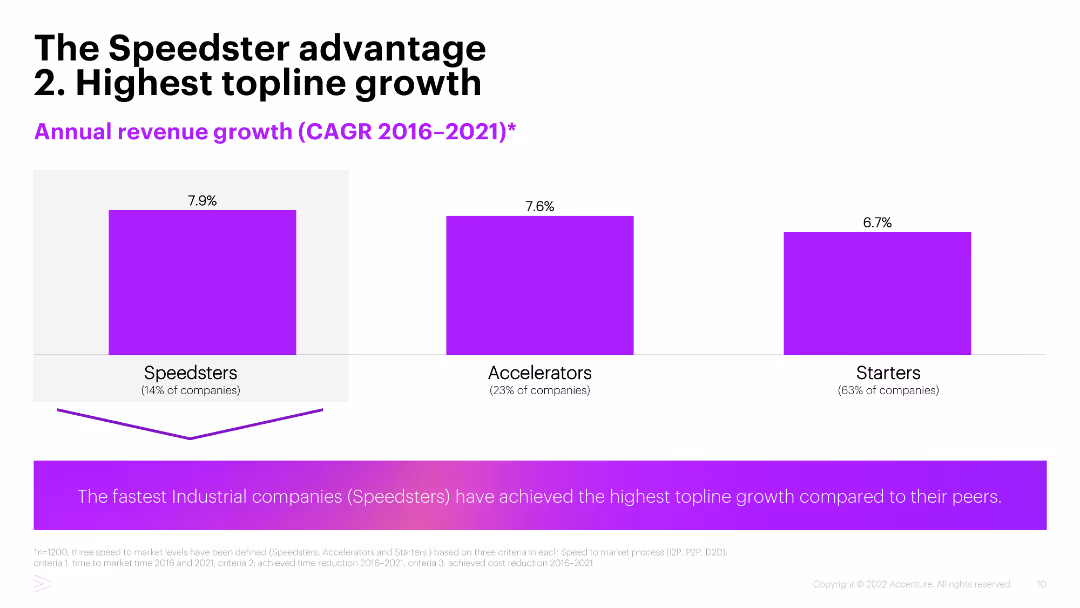
Three column charts showing annual revenue growth (CAGR 2016-2021) for Speedsters, Accelerators, and Starters, with Speedsters achieving the highest growth.
Financial Performance
Industrial & Manufacturing
The slide highlights the annual revenue growth achieved by industrial companies categorized as Speedsters, Accelerators, and Starters, with Speedsters leading in topline growth.
Revenue growth, CAGR, Speedsters, Industrial companies, Financial performance
false
The Speedster advantage 2. Highest topline growthIndustrial Speedsters How advanced technologies can turbocharge your speed to market
Mixed Chart
Accenture
View slide
Concentric circular diagram with three nested levels; left-aligned text explains each layer’s function
Organizational Structure and Change
Professional Services
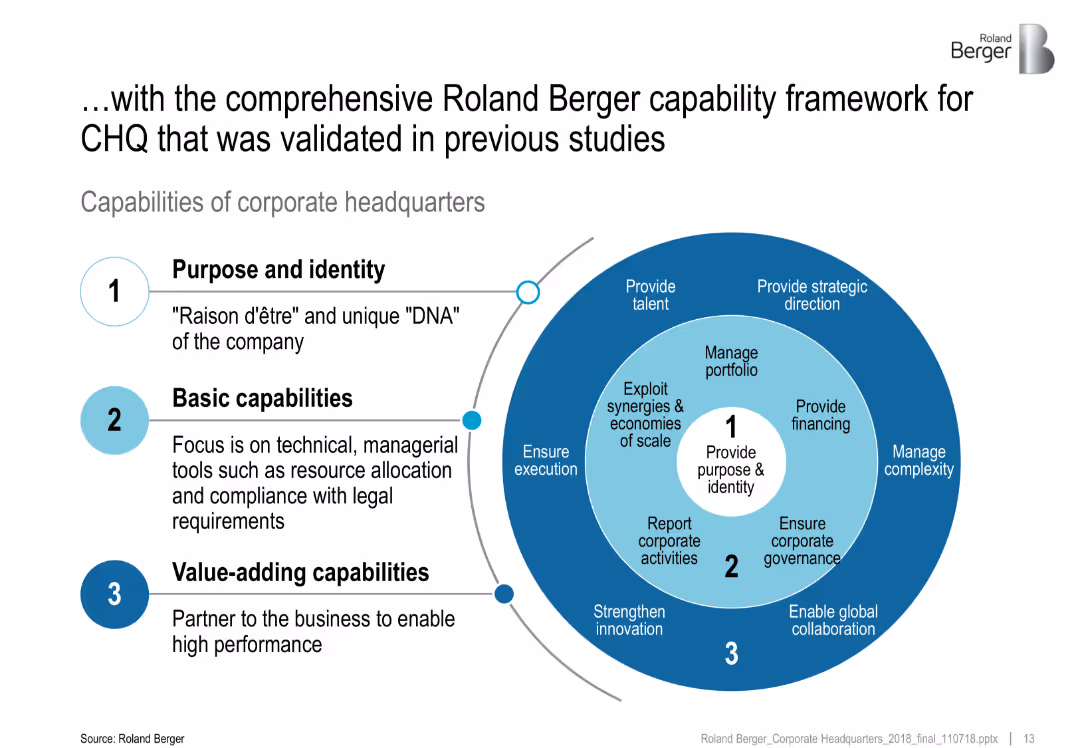
This slide presents Roland Berger's validated capability framework for corporate headquarters (CHQ), categorized into three levels: Purpose and Identity, Basic Capabilities, and Value-Adding Capabilities. Each level is defined by its role and examples of core functions.
corporate headquarters, framework, value-adding, capabilities, execution, structure
false
…with the comprehensive Roland Berger capability framework for CHQ that was validated in previous studiesCorporate Headquarters Study 2018
Framework
Roland Berger
View slide
Vertical bar comparison by gender, generation, income, and education. Contrasts agreement with "success depends on own effort" vs. "depends on external factors." Uses a similar color scheme and format to Slide 19768.
Market Analysis and Trends
Government & Public Sector
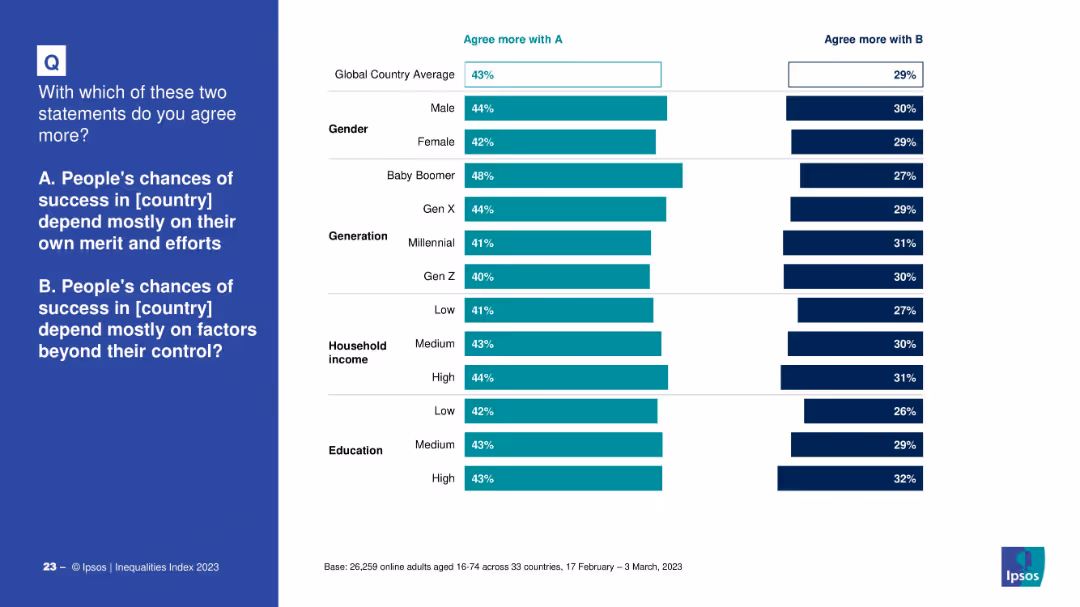
This slide breaks down belief in meritocracy across demographic lines. Older generations and higher-income/educated individuals are more likely to believe success is based on effort, while younger generations and lower-income groups are more divided.
generational gap, success, meritocracy, demographics, education, income, Ipsos, social mobility
false
With which of these two statements do you agree more?IPSOS EQUALITIES INDEX 2023
Mixed Chart
IPSOS
View slide
The slide presents a line chart showing FX outflows over time, highlighting different components such as WDAS/RDAS utilisation and other official payments.
Market Analysis and Trends
Financial Services
The slide details the significant role of WDAS/RDAS utilisation and FX interventions in Nigeria’s FX outflows, with comprehensive data analysis.
FX outflows, WDAS/RDAS, FX intervention, Nigeria, financial trends
false
WDAS/RDAS utilisation and FX intervention accounted for 70% of FX outflows between 2004 and 2021Nigeria (Bi-monthly) Economic Outlook
Mixed Chart
PwC/Strategy&
View slide
A multi-bar column chart shows the percentage of mortgages in forbearance by type, with a time series comparison from 2020 to 2023.
Risk Assessment and Management
Financial Services
Assesses mortgage-backed securities (MBS) risk by highlighting the sharp reduction in forbearance rates since the pandemic, valuable for financial risk managers.
MBS, forbearance, mortgages, pandemic, risk, reduction, securities, financial, management
false
MBS: Forbearance Down Sharply From Pandemic LevelsCredit Market Monitor
Single Chart
Morgan Stanley
View slide
This slide contains a column chart showing reasons for not buying crypto investment funds in 2022 and 2023, with percentages and demographic variations.
Risk Assessment and Management
Financial Services
The slide details why respondents avoid crypto investment funds, citing reasons such as high risk, volatility, lack of government guarantees, and insufficient market knowledge.
Crypto funds, non-purchase, reasons, risk, 2023, 2022, government guarantees, volatility, knowledge
false
Reason(s) For Not Purchasing Any Crypto Investment FundsCRYPTO ASSET SURVEY 2023
Multiple Chart
IPSOS
View slide
Multi-panel slide with various graphs on debt, workforce, FDI, consumer confidence, and GDP growth drivers; consistent purple highlight.
Market Analysis and Trends
Financial Services
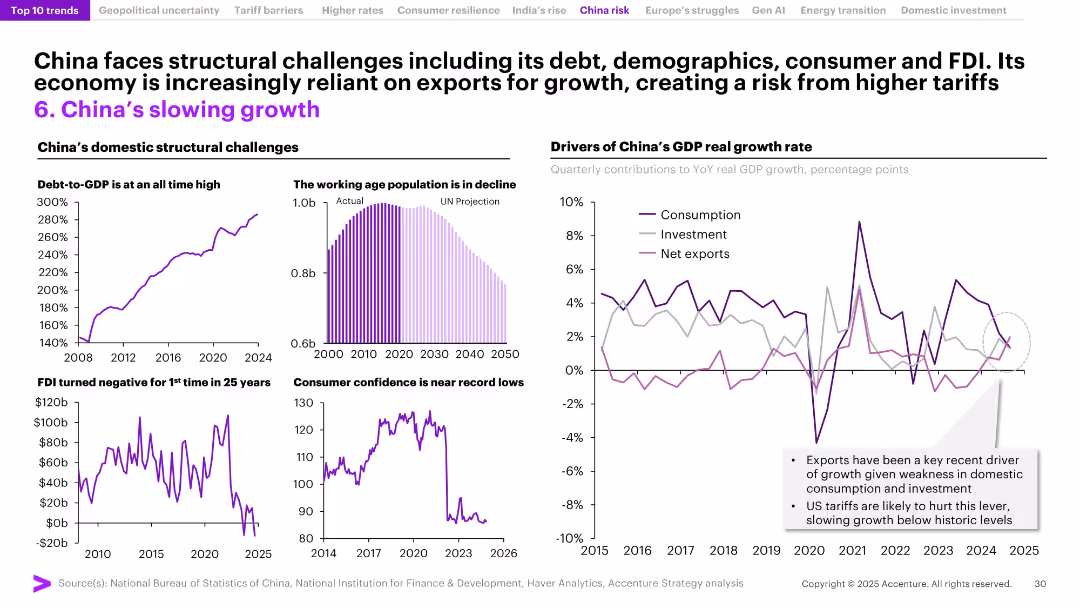
The slide presents China's economic slowdown due to mounting debt, shrinking working-age population, declining FDI, and weakening consumer confidence. Exports have been a key growth lever, but rising tariffs and global shifts may further constrain growth. The analysis reflects deep-rooted structural vulnerabilities.
China economy, debt, demographics, FDI decline, exports, consumer confidence, GDP growth, tariffs, structural slowdown, macroeconomics
false
China faces structural challenges including its debt, demographics, consumer and FDI. Its economy is increasingly reliant on exports for growth, creating a risk from higher tariffsJanuary Macro Brief
Multiple Chart
Accenture
View slide
Line chart depicting the yield of AAA Muni bonds as a percentage of UST 10-year yields, indicating the near-zero carry pickup for high-quality Munis.
Investment Analysis
Financial Services
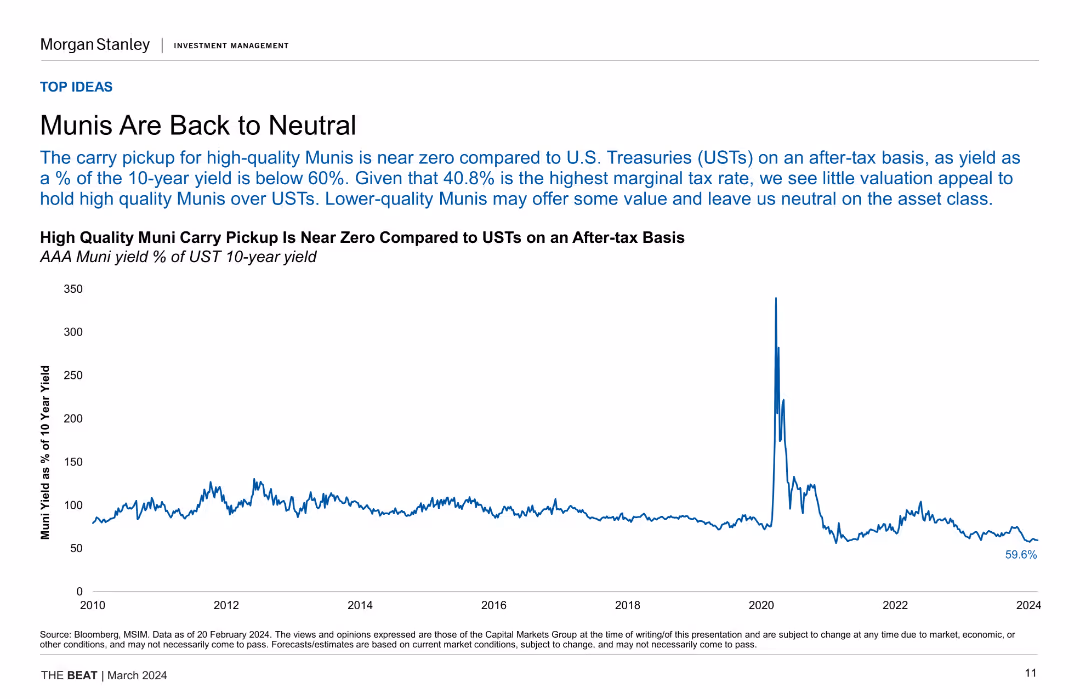
This slide analyzes the yield comparison between high-quality Munis and USTs, suggesting limited valuation appeal for Munis on an after-tax basis and a neutral stance.
Munis, UST, Yields, Investment, Valuation, After-tax, Financial Analysis
false
Munis Are Back to NeutralThe BEAT March 2024
Single Chart
Morgan Stanley
View slide
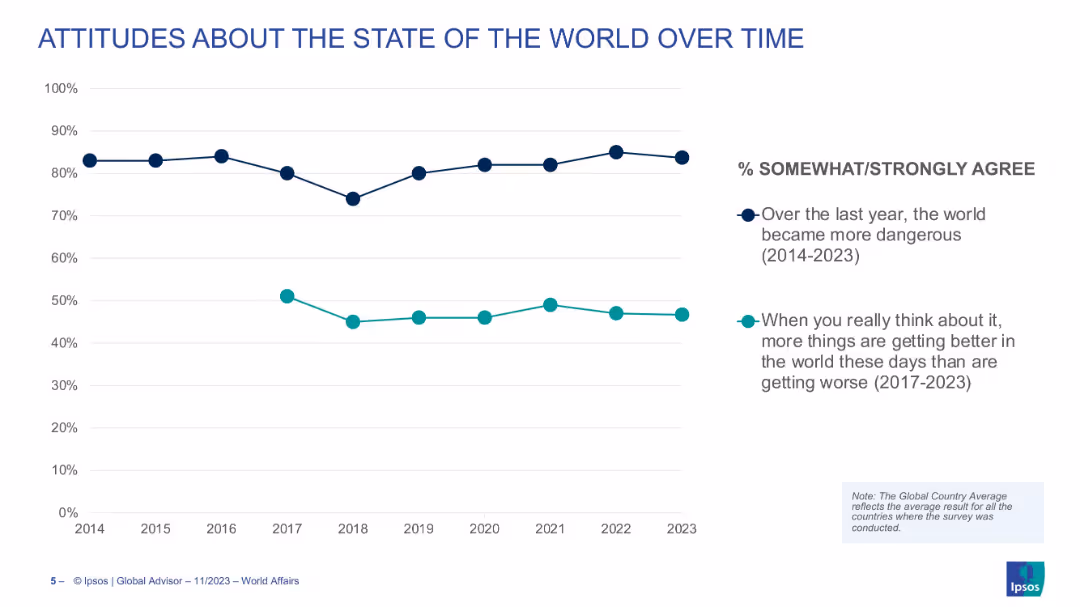
Line graph showing two trendlines over time (2014–2023): one for belief the world is more dangerous, and another for belief that more things are getting better.
Market Analysis and Trends
Media & Entertainment
The slide tracks global attitudes toward danger and optimism over nearly a decade, showing consistent concern about safety and a more fluctuating view on global progress.
world views, optimism, danger, global trends, perceptions, time-series, sentiment
false
Attitudes About the State of the World Over TimeWORLD AFFAIRS 2023
Single Chart
IPSOS
View slide
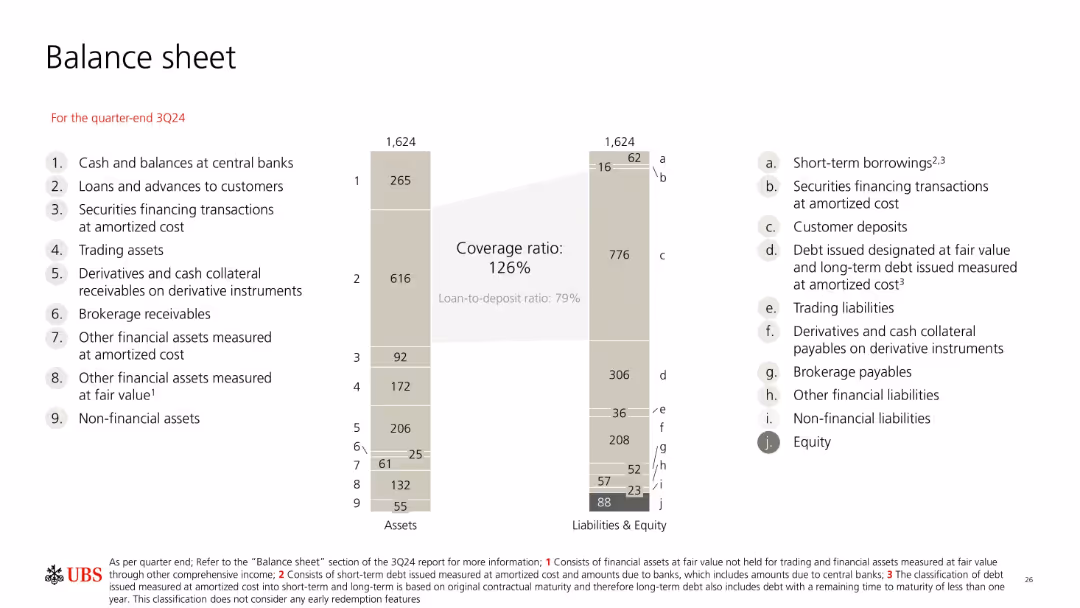
Balance sheet diagram with vertical bars comparing assets and liabilities; clean, grey-themed layout with side annotations.
Corporate Finance and Valuation
Financial Services
The balance sheet for UBS at 3Q24 outlines assets and liabilities totaling 1,624bn CHF. Key ratios include a 126% coverage ratio and 79% loan-to-deposit ratio. Visual groupings help identify major components like customer deposits and loans to customers.
balance sheet, UBS, assets, liabilities, coverage ratio, deposits, equity, financials, 3Q24
false
Balance sheetThird quarter 2024 Fixed Income investor presentation
Mixed Chart
UBS
View slide
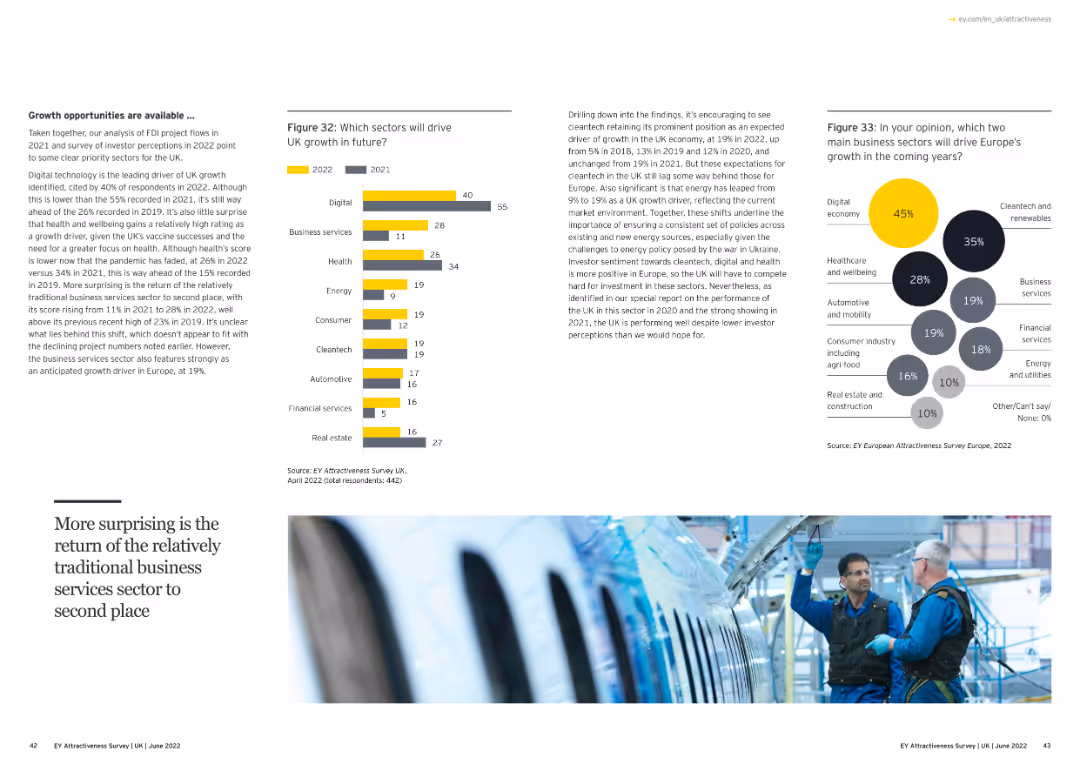
Contains text, a bar chart, and a bubble chart. The bar chart shows expected growth sectors in the UK, while the bubble chart highlights growth sectors in Europe.
Strategic Planning
Financial Services
The slide discusses growth opportunities and sectors driving growth in the UK and Europe, based on survey data.
growth sectors, UK, Europe, survey, column chart, bubble chart
false
Growth opportunities are available …Adapting to a changed world EY Attractiveness Survey
Multiple Chart
EY
View slide
Slide with comparative data in bar graph format, emphasizing regional differences in executive confidence and outlook for 2023, using green, red, and gray color scheme.
Market Analysis and Trends
Professional Services
Compares the optimism and confidence among C-suite leaders globally, highlighting regional variations and strategic concerns for 2023.
C-suite, optimism, strategy, 2023, global
false
C suite leaders go into 2023 generally optimistic, but less confident about their company's ability to outperformThe CEO Outlook Caution, Optimism, and Navigating the Road Ahead
Multiple Chart
BCG
View slide
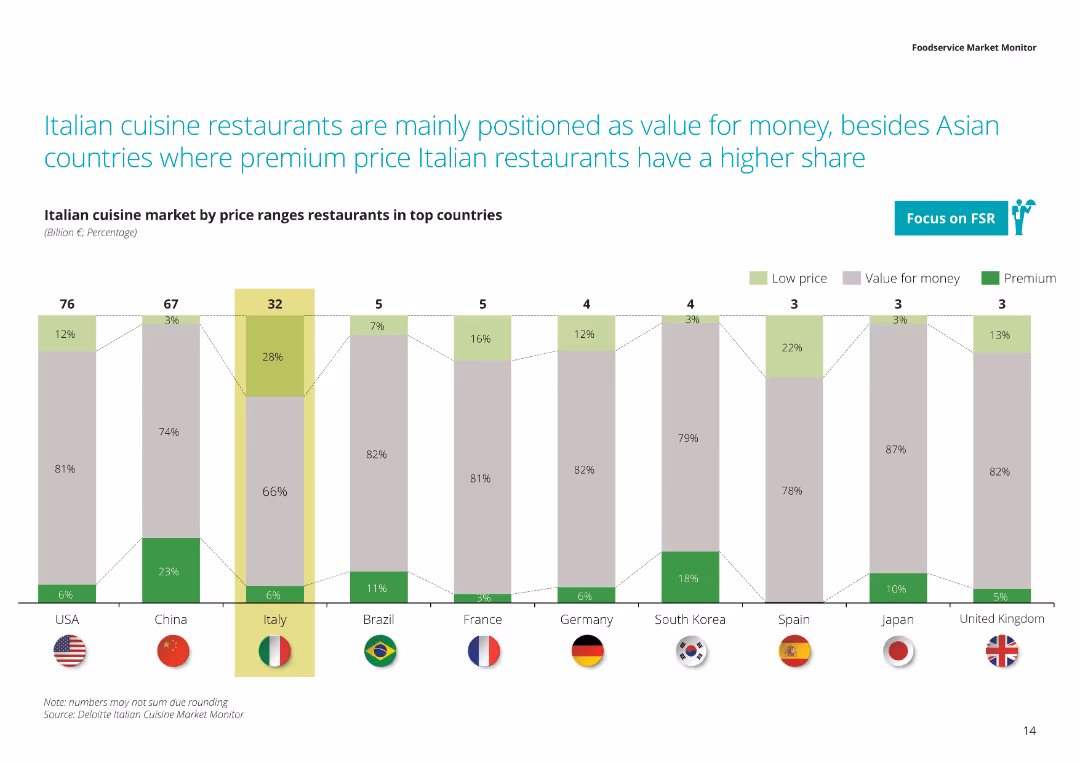
This slide includes a column chart illustrating the market share of Italian cuisine restaurants in top countries by price range (low, value for money, premium).
Market Analysis and Trends
Hospitality & Tourism
This slide analyzes the price positioning of Italian cuisine restaurants globally, highlighting that they are mainly seen as value for money compared to other regions where premium pricing is more common.
Italian cuisine, price positioning, value for money, premium, global analysis
false
Italian cuisine restaurants are mainly positioned as value for money, besides Asian countries where premium price Italian restaurants have a higher shareFoodservice Market Monitor
Single Chart
Deloitte
View slide
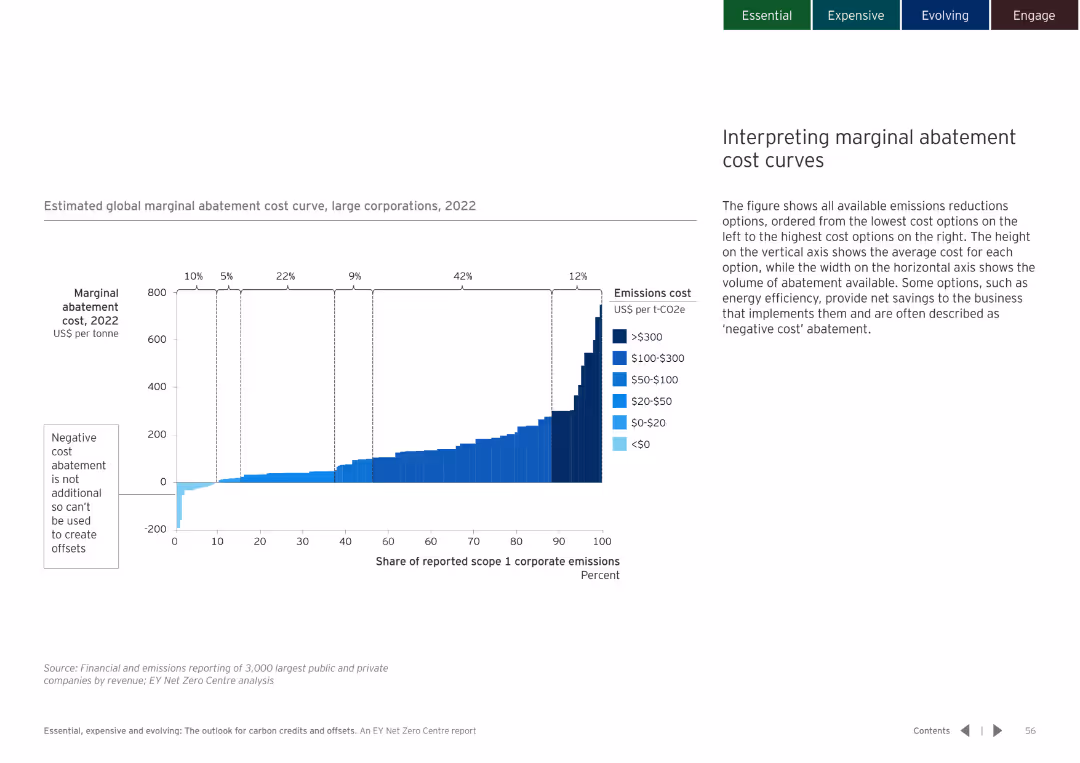
White background with a bar chart showing the marginal abatement cost curve. Clear labeling and color coding for different cost ranges.
Financial Performance
Environmental Services & Sustainability
Explains the interpretation of marginal abatement cost curves and the implications for emissions reduction strategies.
abatement cost curves, emissions reduction, cost interpretation
false
Estimated global marginal abatement cost curve, large corporations, 2022Essential, expensive and evolving: The outlook for carbon credits and offsets
Mixed Chart
EY
View slide
The slide includes text, a Venn diagram, and a column chart. It is moderately dense, with well-being components and survey statistics.
Human Resources and Talent Management
Government & Public Sector
Explores the application of well-being strategies in public services, focusing on physical, financial, and mental well-being components and their importance post-COVID-19.
well-being, COVID-19, public sector, physical, financial, mental, survey, strategy, employee
false
How does Well-Being Apply to Government & Public Services?2020 Deloitte Human Capital Trends: Government & Public Services Insights
Mixed Chart
Deloitte
View slide
Scatter plot showing the 'Ability to Technically Automate' against 'Hourly Wage' with highlighted positions like 'File clerks' and 'Chief executives', indicating a wide range across wage levels.
Financial Performance
Industrial & Manufacturing
Discusses the correlation between the technical potential for automation and wage levels, highlighting how both high and low-wage jobs can be significantly automated.
Wages, Automation, Job Security, Income Levels, Analysis
false
Automation potential spans from high to low wage occupationsA FUTURE THAT WORKS: AI, AUTOMATION, EMPLOYMENT, AND PRODUCTIVITY
Single Chart
McKinsey
View slide
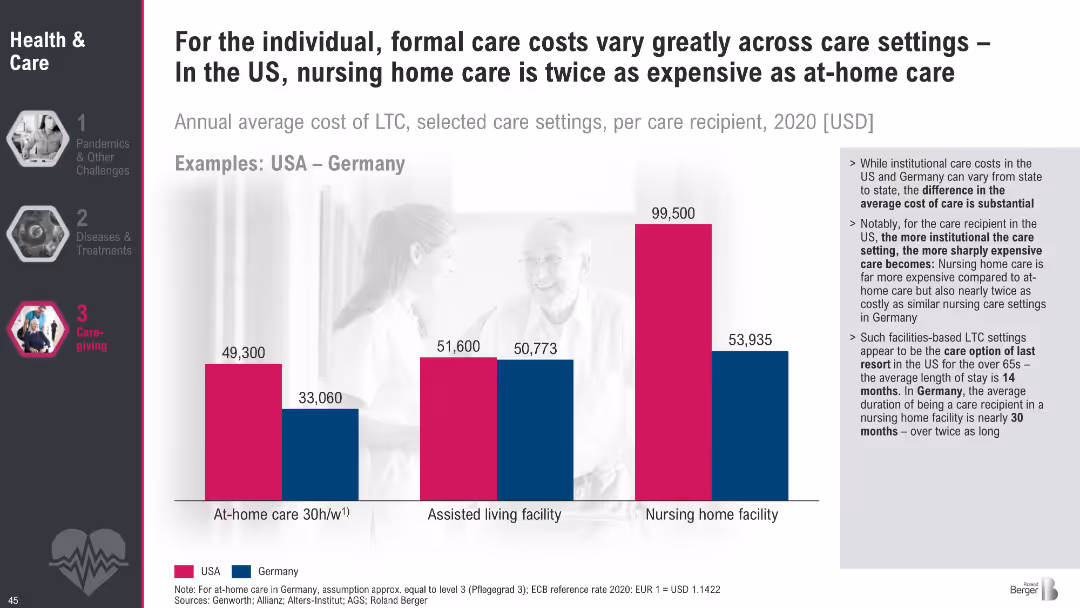
Bar chart comparing LTC costs for at-home, assisted living, and nursing homes between USA and Germany; text outlines implications of institutional vs. home care.
Pricing Strategies
Healthcare & Pharmaceuticals
The slide compares LTC costs in different settings and highlights stark cost differences between the US and Germany. It emphasizes that more institutionalized care leads to higher expenses, particularly in the US, with policy implications for affordability and planning.
LTC cost, nursing homes, assisted living, at-home care, USA vs. Germany, eldercare expenses, care settings
false
For the individual, formal care costs vary greatly across care settings In the US, nursing home care is twice as expensive as at home careMegatrend 2 Health & Care
Mixed Chart
Roland Berger
View slide
Line graph overlaid on a column chart detailing the increase in broadband speeds from 2011 to 2022, with annotations explaining the growth.
Market Analysis and Trends
Telecommunications
Details the increase in broadband speeds across Australia since 2011, highlighting the impact of nbn on internet quality and speed.
broadband, Australia, nbn, speeds, growth, internet, quality, infrastructure
false
Broadband speeds have increased 3-fold over the course of the nbn network roll out and today are 6-times faster than in 2011The economic and social impact of investment in the nbn network Methodology Report
Mixed Chart
Accenture
View slide
Lists financial metrics and performance highlights for different regions.
Financial Performance
Financial Services
Summarizes regional performance in wealth management, noting high client engagement and income growth.
regional performance, client engagement, income growth, wealth management, financial metrics
false
Global Wealth Management Strong performance with double-digit PBT and advisor productivity growth across regionsFirst quarter 2020 results
Multiple Chart
UBS
View slide
The slide features a column chart showing the year-on-year growth in capital importation by sector for Q3 2023. It contrasts significant growth in manufacturing with declines in banking, financing, ICT, and trading sectors.
Market Analysis and Trends
Financial Services
This slide presents the year-on-year changes in capital flows to various sectors, highlighting the substantial increase in manufacturing and declines in banking, financing, ICT, and trade. It provides insights into sectoral performance and investment trends.
capital flows, manufacturing, banking, financing, ICT, trade
false
Capital flows to Manufacturing grew Y o Y by 185% while Banking, Financing , ICT and Trade shrunk...Nigeria Economic Outlook
Mixed Chart
PwC/Strategy&
View slide
The slide features three overlapping circles (Venn diagram) with text blocks aligned vertically on the right. The text is clear and organized, with three main categories highlighted in bold: Enable People, Set New Targets, and Build Capabilities.
Organizational Structure and Change
Professional Services
Focuses on the necessity of putting people at the center of organizational transformations, specifically building new capabilities, setting new targets, and accountability. It discusses leadership commitment and engaging stakeholders.
Transformation, Leadership, Stakeholders, Accountability, Capabilities
false
People are at the heart of the transformation and resources needto be invested to drive culture change, build new capabilities and set new targetsNordic Circular Economy Playbook 2.0
Framework
Accenture
View slide
This slide combines a summary of loan portfolio characteristics with a line chart depicting net charge-off performance trends, focusing on commercial real estate. It's structured for easy interpretation of data and text.
Risk Assessment and Management
Financial Services
Discusses risk management strategies and performance within JPMorgan's commercial real estate lending, emphasizing stability and quality in lending practices.
risk management, CRE, loan security, real estate, market analysis, non-bank competition, investment quality
false
Maintaining strong risk discipline – CRECommercial Banking 2019
Mixed Chart
JP Morgan
View slide
The slide contains two column charts showing capital development and ratios at different stages, with notes on funding cost saves and capital ratio requirements.
Financial Performance
Financial Services
This slide discusses the group's strong capital position and outlines the expected development of capital ratios from 2023 to 2026, emphasizing funding cost savings.
capital position, ratios, funding cost, development, 2026
false
Strong capital position at Group and pro forma combined parent bank levelFourth quarter 2023 Results and investor update
Multiple Chart
UBS
View slide
Depicts various market segments with potential growth opportunities using purple boxes and white text. Design is straightforward and focused on future strategies.
Strategic Planning
Technology & Software
Outlines the substantial growth opportunities in different segments, including revenue cycle software and identity management. Useful for strategic planning sessions or investor relations meetings.
growth strategy, market opportunities, technology, strategic planning
false
Substantial opportunity to drive future growthBarclays Global Credit Bureau Forum
Pillar
Barclays
1
...
Load More
Hold On!
We are searching in our database
If nothing, comes up, please try different filters!
Create a FREE account to continue browsing
Receive Instant Access to 1,000+ slides from companies like McKinsey, Google, and Goldman Sachs
First Name
Last Name
Email
Password
I agree to all
Terms & Privacy Policy
Thank you! Your submission has been received!
Oops! Something went wrong while submitting the form.
Have an account?
Sign in
Column Chart
Heatmap
Chevron
Org Chart
Infographic
Callouts
Timeline
List
Graphic
Picture
Process Flow
Diagram
Paragraph
Map
Table
Framework
Subtitle
Takeaway Box
Icon
Other Chart
Radar Chart
Waterfall Chart
Mekko Chart
Pie Chart
Scatter Plot
Line Chart
Bar chart
Bullet points