My Account
My Slides
Search by Category
Templates
View All Templates
Download Template Slides
Leave Feedback
Login
Logout
Get Started
Browse all Slides
Browse all Slides
Create a FREE Account
Instant access to 1,000+ real slides from top companies like McKinsey, BCG, Goldman Sachs, Google and many more!
First Name
Last Name
Email
Password
I agree to all
Terms & Privacy Policy
Thank you! Your submission has been received!
Oops! Something went wrong while submitting the form.
Have an account?
Sign in
Instant access to the internet's best slides
Get access to 40+ advanced filters and more
Advanced Search and Filters
Access to
10,000+ slides
Access to Category Pages
Save/Bookmark Slides
PowerPoint Template Library (New)
Choose your plan
MONTHLY
$12/month
Billed every month, cancel anytime.
YEARLY
$9/month
Billed $108 annually, cancel anytime.
Checkout for $12/month
Checkout for $108/yr
Secured by Stripe | AES-256 bit encryption
Spark Your Next Big Idea with New Presentation Templates
VIEW ALL Templates
Welcome,
Welcome
Upgrade to SlideStart
Pro
Instant access to 15,000+ slides
Show Featured Only
Checkbox 8
Companies
Mckinsey
Bain
BCG
EY
Deloitte
Accenture
PwC/Strategy&
JP Morgan
Goldman Sachs
Morgan Stanley
Citigroup
Deutsche Bank
Barclays
LEK
Kearney
Oliver Wyman
Booz Allen Hamilton
Gartner
IPSOS
Nielsen
Slide type
Header Horizontal
Framework
Vertical Flow
Single Chart
Single Chart
Text Only
Mixed Chart
Header Vertical
Graphic
Pillar
Multiple Chart
Agenda
Title
Table
Linear Flow
Upgrade to SlideStart
Pro
Instant access to 40+ advanced filters
Industry
Upgrade to SlideStart
Pro
Instant access to 40+ advanced filters
Technology
Healthcare
Financial Services
Consumer Goods
Energy & Utilities
Manufacturing
Retail
E-commerce
Logistics
Telecommunications
Real Estate
Professional Services
Education
Media
Entertainment
Hospitatlity
Tourism
Agriculture
Food Production
Government & Public Sector
Environmental
Sustainability
Use Case
Upgrade to SlideStart
Pro
Instant access to 40+ advanced filters
Sales and Business Development
Mergers and Acquisitions
Corporate Finance and Valuation
Performance Metrics and KPIs
Client Case Studies
Competitive Landscape
Product and Service Analysis
Customer and Market Segmentation
Organizational Structure
Human Resources and Talent Management
Industry Overview
Regulatory and Compliance
Risk Assessment and Management
Agriculture & Food Production
Hospitality and Tourism
Government
Environmental
Sustainability
Clear all
Thank you! Your submission has been received!
Oops! Something went wrong while submitting the form.
Show Featured Only
Checkbox 8
Companies
Mckinsey
Bain
BCG
EY
Deloitte
Accenture
PwC/Strategy&
JP Morgan
Goldman Sachs
Morgan Stanley
Citigroup
Deutsche Bank
Barclays
LEK
Kearney
Oliver Wyman
Booz Allen Hamilton
Gartner
IPSOS
Nielsen
Slide type
Text Only
Linear Flow
Vertical Flow
Single Chart
Header Horizontal
Mixed Chart
Header Vertical
Pillar
Multiple Chart
Graphic
Agenda
Title
Table
Framework
Industry
Technology
Healthcare
Financial Services
Consumer Goods
Energy & Utilities
Manufacturing
Retail
E-commerce
Logistics
Telecommunications
Real Estate
Professional Services
Education
Media
Entertainment
Hospitatlity
Tourism
Agriculture
Food Production
Government & Public Sector
Environmental
Sustainability
Use Case
Sales and Business Development
Mergers and Acquisitions
Corporate Finance and Valuation
Performance Metrics and KPIs
Client Case Studies
Competitive Landscape
Product and Service Analysis
Customer and Market Segmentation
Organizational Structure
Human Resources and Talent Management
Industry Overview
Regulatory and Compliance
Risk Assessment and Management
Agriculture & Food Production
Hospitality and Tourism
Government
Environmental
Sustainability
Clear all
Thank you! Your submission has been received!
Oops! Something went wrong while submitting the form.
Tag
View slide
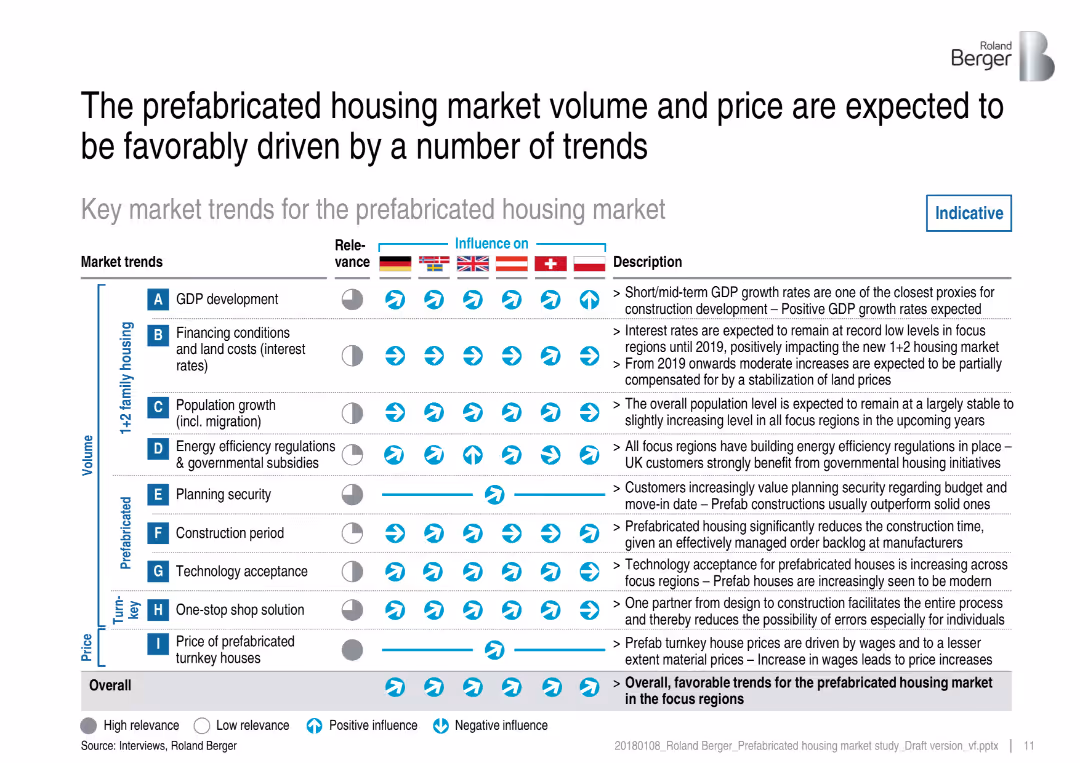
Matrix-style chart with rows of market trends and columns representing different countries, showing trend influences via arrow symbols.
Market Analysis and Trends
Real Estate & Construction
This slide identifies and categorizes key macro and microeconomic trends driving the prefabricated housing market. It includes GDP, land costs, energy regulations, and consumer behavior, mapping their influence across countries with visual indicators.
housing trends, market drivers, prefabrication, regulations, GDP, interest rates, energy efficiency, country comparison, Roland Berger
false
The prefabricated housing market volume and price are expected to be favorably driven by a number of trendsPrefabricated housing market in Central and Northern Europe – Overview of market trends and development
Table
Roland Berger
View slide
The slide features a line chart depicting the levelized cost of CO2 capture for various large-scale post-combustion projects at coal-fired power plants from 2004 to 2028.
Market Analysis and Trends
Energy & Utilities
The slide highlights how CCUS technology can expect cost reductions from learning and technology deployment, showing historical and projected costs for various facilities. The chart illustrates a downward trend in capture costs over time, with expected further reductions as technology improves.
CO2 capture, cost, post-combustion, trends
false
Levelized cost of CO2 capture for large-scale post-combustion at coal-fired power plantCarbon Capture Utilization and Storage
Single Chart
Kearney
View slide
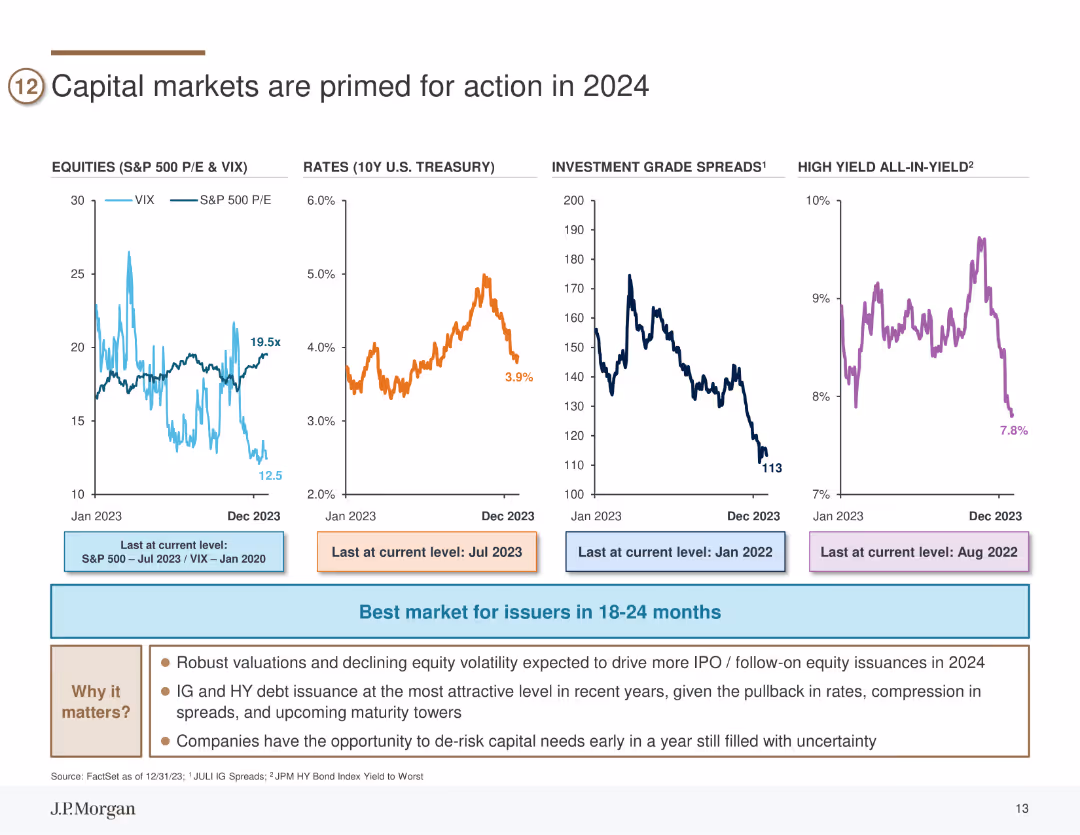
The slide includes four line charts depicting trends in equities (S&P 500 P/E & VIX), rates (10Y U.S. Treasury), investment grade spreads, and high yield all-in-yield from Jan 2023 to Dec 2023.
Market Analysis and Trends
Financial Services
This slide analyzes various capital market indicators suggesting that 2024 will be favorable for market activities such as IPOs and debt issuance.
capital markets, equities, treasury rates, investment grade, high yield
false
Capital markets are primed for action in 2024Corporate Compass Navigating the year ahead
Multiple Chart
JP Morgan
View slide
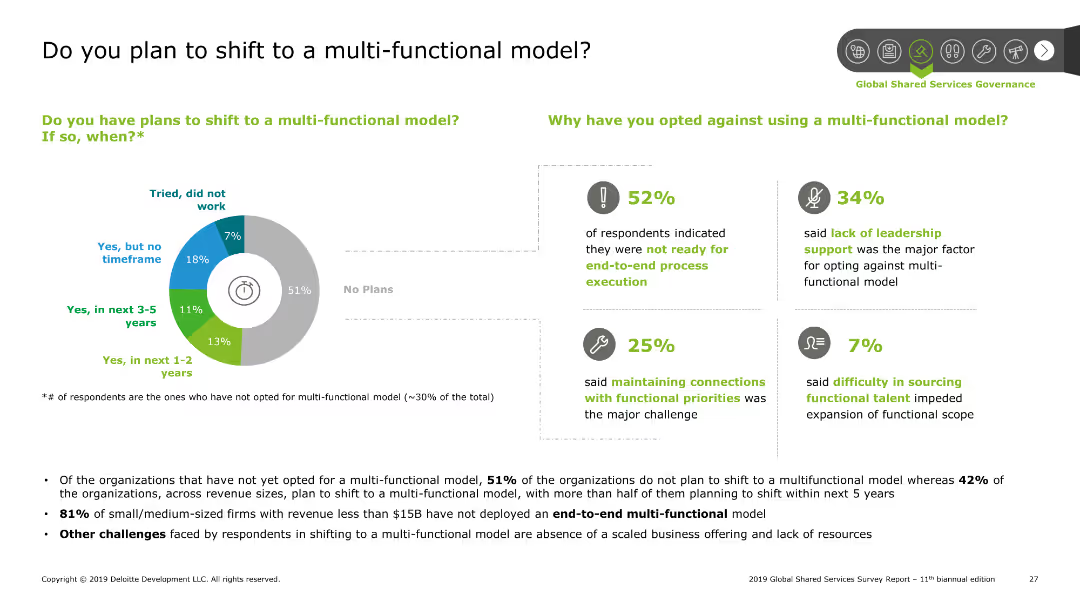
Pie chart showing the percentage of organizations planning to shift to a multi-functional model. Bar charts detailing reasons for not shifting. Summary points discuss findings and challenges faced by organizations.
Strategic Planning
Professional Services
The slide presents data on organizational plans to shift to a multi-functional model. A pie chart shows the percentage breakdown, while bar charts explain reasons for not shifting. Summary points highlight major challenges such as readiness for end-to-end execution and leadership support.
SSC, multi-functional model, planning, challenges, shift
false
Do you plan to shift to a multi functional model?2019 Global Shared Services Survey Report 11th biannual edition
Mixed Chart
Deloitte
View slide
Features bar charts comparing top origin and destination countries for international migrants.
Market Analysis and Trends
Government & Public Sector
Provides an overview of major migration corridors, focusing on India and the US.
migration, India, US, corridors, global
false
By origin, migrants from India lead in absolute numbers, the US remains overall top destination – Middle East countries host most in relative termsRoland Berger Trend Compendium 2030: Megatrend 1 People & Society
Multiple Chart
Roland Berger
View slide
Contains a line graph comparing generational spending, and a column chart showing the growth of new accounts. The visual elements are clearly labeled and contrasted by colors.
Market Analysis and Trends
Financial Services
Focuses on credit card spending across generations and acquisition growth. Useful in marketing strategy or generational market analysis discussions.
generational spending, market acquisition, credit cards, Millennials, Gen Z
false
Our value propositions continue to attract the next generation of card membersConsumer & Community Banking
Multiple Chart
JP Morgan
View slide
Contains a mixture of images and text, with highlighted numerical targets and progress indicators in bold fonts, set against a background image of solar panels, which implies a green investment focus.
Corporate Finance and Valuation
Financial Services
Highlights a financial firm’s goals and progress in sustainable and inclusive economic practices, ideal for investor relations or sustainability reporting.
Sustainable Development, Green Goals, Community, Racial Equity, Investment
false
We remain committed to advancing a sustainable and inclusive economyInverstors Day 2023
Mixed Chart
JP Morgan
View slide
The slide features bar charts showing different levers in R&D with corresponding activity levels and trends over time.
Sales and Business Development
Technology & Software
Highlights R&D levers focusing on network optimization, cross-functional cost optimization, and product development processes.
R&D, Network Optimization, Product Development, Trends
false
Network and cross functional optimization remain areas of focus in R&D10th Operations Efficiency Radar
Single Chart
Roland Berger
View slide
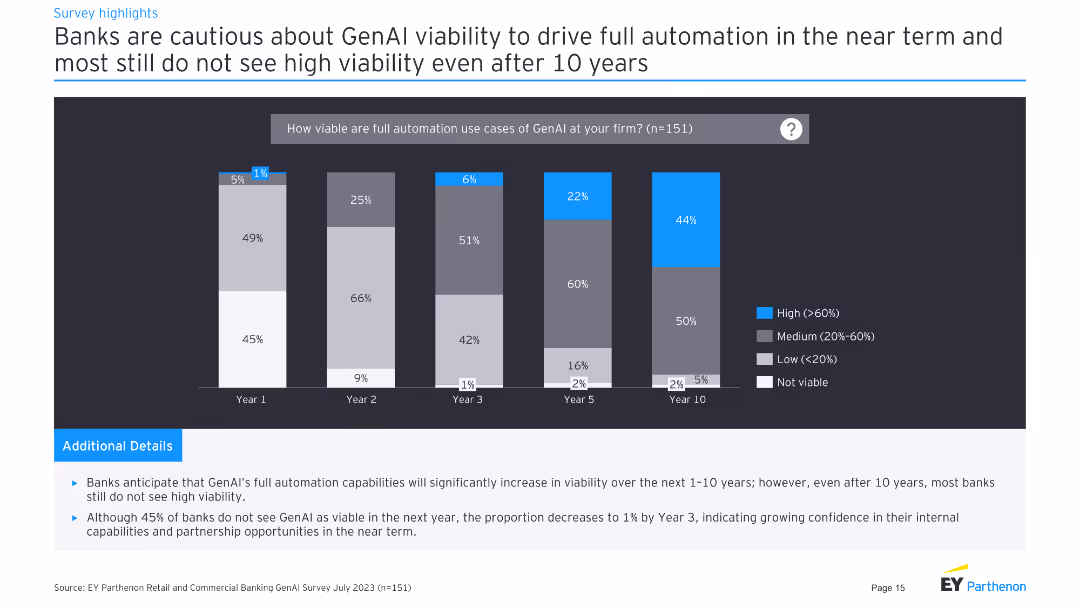
Column chart showing viability of GenAI for full automation over 10 years.
Risk Assessment and Management
Financial Services
Banks are cautious about GenAI viability for full automation, with low confidence even after 10 years.
GenAI, automation, viability, long-term, risk
false
Banks are cautious about GenAI viability to drive full automation in the near term and most still do not see high viability even after 10 yearsGenerative AI in retail and commercial banking
Mixed Chart
EY
View slide
Column chart displaying y/y percentage change in headline CPI from 2022 to 2025F across global regions, color-coded for each year.
Market Analysis and Trends
Financial Services
The slide projects disinflationary momentum across most economies, detailing expected CPI changes in regions like the US, Euro area, etc.
disinflation, CPI, economy, projection, global, region, column chart, forecast, supply conditions, demand growth
false
Assuming mildly softer final demand growth and continued favorable supply conditions, we expect disinflationary momentum to continue across most economiesMacroeconomic outlook and impact on businesses
Single Chart
EY
View slide
Contains multiple text boxes and images describing opportunities in sustainable farming, solar, built environment, and wind energy. Visuals include photos and simplified icons representing different sectors.
Strategic Planning
Energy & Utilities
The slide details various sectors within the renewable energy industry, supported by strong government policies and investment potential. It covers key opportunities and challenges across sustainable farming, solar energy, the built environment, and wind energy.
renewable energy, solar, wind, government support, investment
false
Attractive renewables sector driven by strong government support and large power potentialSoutheast Asia’s Green Economy 2022 Report
Header Horizontal
Bain
View slide
The slide features two column charts. The left chart displays Eurozone consumer confidence over time. The right chart shows accumulated excess savings as a percentage of 2019 GDP for the US, Eurozone, and UK. The charts are well-annotated with clear trends.
Market Analysis and Trends
Financial Services
This slide examines consumer confidence and savings behavior in the Eurozone, the US, and the UK, useful for consumer behavior analysis and economic forecasting.
eurozone, consumer confidence, savings, GDP, economic forecasting
false
Eurozone consumer confidenceGuide to the Markets UK | Q2 2024
Multiple Chart
JP Morgan
View slide
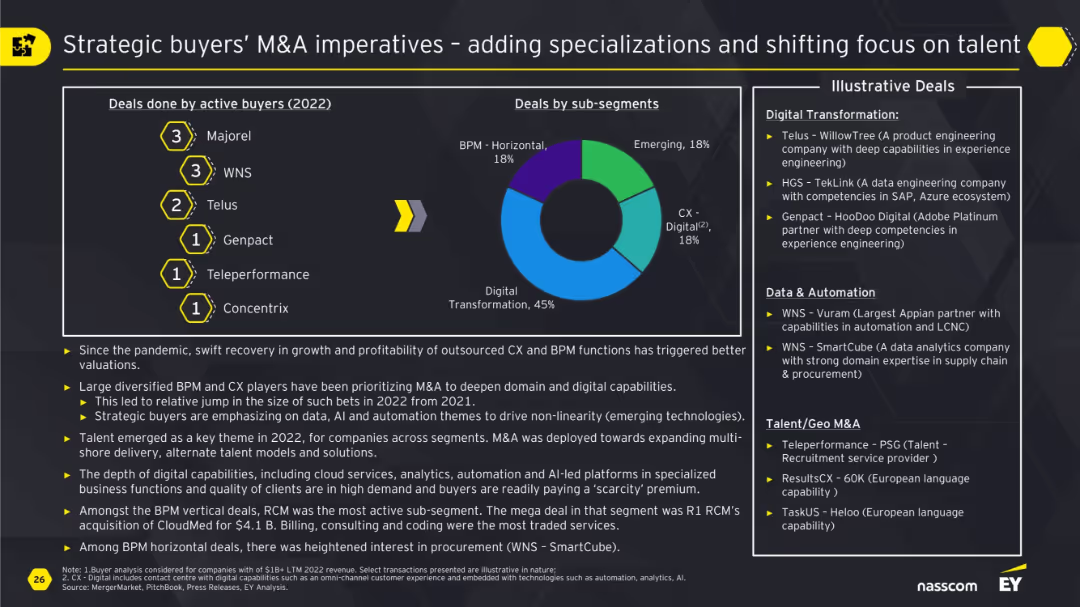
Left section lists top buyers with deal counts, center doughnut chart by sub-segment, and right box for illustrative deals.
Human Resources and Talent Management
Technology & Software
This slide presents the shift in M&A strategy among strategic buyers toward acquiring talent-rich and capability-deep firms, especially in digital transformation and analytics. Key buyers like WNS and Genpact are shown alongside deal examples, with a focus on talent acquisition and specialization.
strategic buyers, M&A, talent acquisition, digital, data, CX, analytics, automation
false
Strategic buyers’ M&A imperatives adding specializations and shifting focus on talentA Year of Paradoxes: M&A Trends and Outlook in the Technology Services Sector
Mixed Chart
EY
View slide
The slide includes two charts: one line chart showing the global energy mix over time and another bar chart showing global investments in energy transition technologies.
Strategic Planning
Energy & Utilities
The slide highlights the shift in energy consumption from fossil fuels to renewables and the increasing investments in energy transition technologies.
energy transition, global energy mix, investments, renewables, strategic planning
false
Global energy transition Global energy mix Share of primary energy consumptionGuide to the Markets Asia | 2Q 2024
Multiple Chart
JP Morgan
View slide
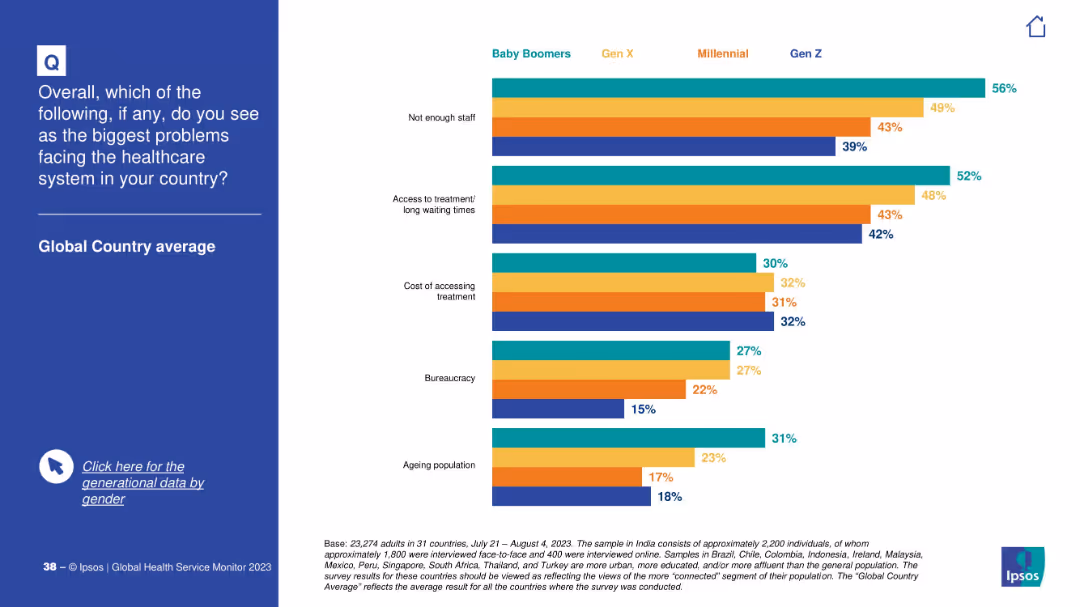
Simplified version of previous slide with consolidated generational data only, without gender breakdown.
Market Analysis and Trends
Healthcare & Pharmaceuticals
This slide presents generational comparisons for perceived major healthcare system problems, such as staffing shortages and long wait times. Baby Boomers are most concerned about staffing, while Gen Z notes cost and bureaucracy.
healthcare concerns, generational view, staff shortage, treatment access, cost, bureaucracy, perceptions, Ipsos
false
Healthcare challengesIPSOS GLOBAL HEALTH SERVICE MONITOR 2023
Mixed Chart
IPSOS
View slide
Slide features two column charts depicting revenue growth and market resiliency.
Market Analysis and Trends
Financial Services
Shows Equifax's revenue resilience and growth levers during economic fluctuations, emphasizing its strength in diverse market conditions.
Revenue, Resilience, Growth, Economy, Market
false
EFX more resilient and well positioned in a slower macro environmentBarclays Credit Bureau Day
Multiple Chart
Barclays
View slide
Similar to the previous, this Cartesian coordinate system chart displays shifts in various factors over 12 years. It uses red dots connected by dashed lines to denote changes, showing general improvements and deterioration.
Market Analysis and Trends
Professional Services
This slide provides a longitudinal study of France's business environment over 12 years, highlighting improvements in key assets and persistent challenges, particularly in social legislation.
longitudinal analysis, business environment, France, improvement, social legislation
false
Over the last 12 years, France has generally improved on its key assets and has deteriorated on its historical weaknesses, except for social legislationBAROMETER AmCham-Bain 2024
Single Chart
Bain
View slide
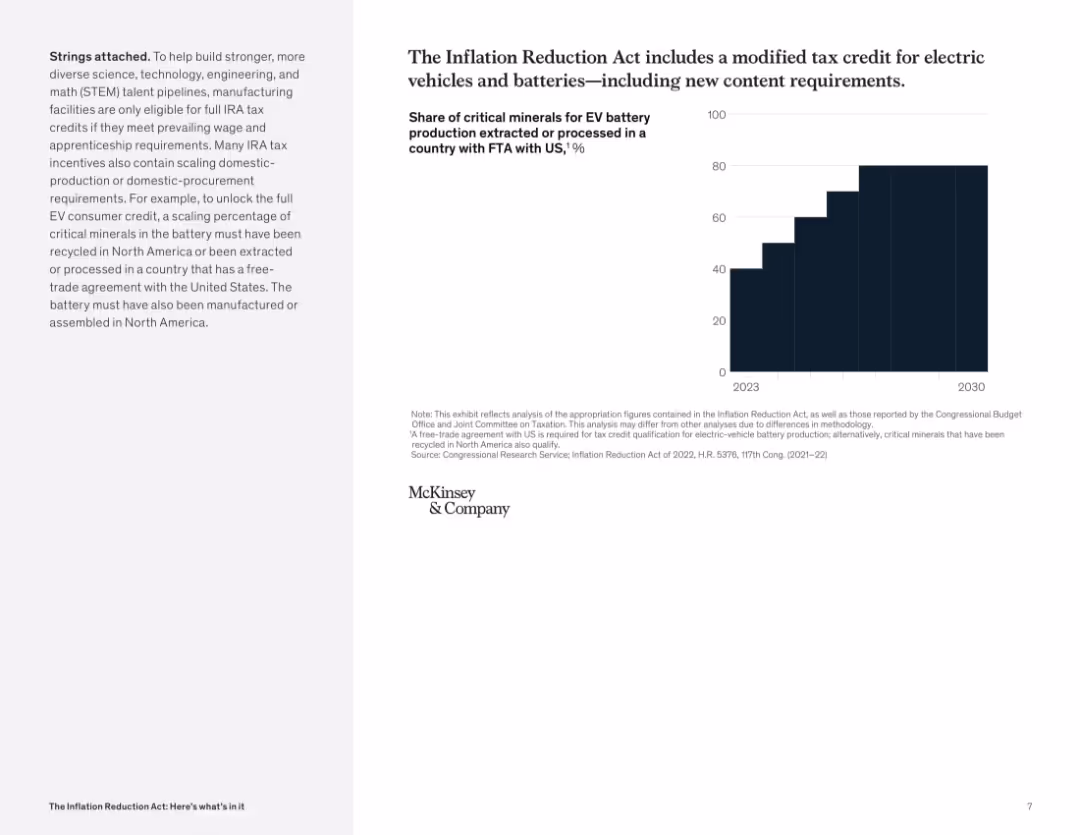
Bar chart showing percentage increase from 2023 to 2030; minimalist black bar on white background; left-side note on eligibility criteria.
Regulatory and Compliance
Industrial & Manufacturing
This slide explains new eligibility rules for EV battery tax credits under the IRA, requiring critical minerals to be sourced from specific countries. It emphasizes growing domestic content requirements over time.
electric vehicles, battery, tax credit, critical minerals, domestic production, FTA, North America
false
The Inflation Reduction Act includes a modified tax credit for electric vehicles and batteries—including new content requirementsThe Inflation Reduction Act: Here’s what’s in it
Mixed Chart
McKinsey
View slide
This slide shows two sets of column charts. The first chart displays 'Cost Saves Limiting Expense Growth' over time, and the second chart shows 'Merger Costs Fading'. There is a clear visual trend of decreasing costs highlighted by the arrow.
Operational Efficiency
Financial Services
Illustrates cost savings over time and the reduction of merger-related expenses. It effectively uses visual trends to demonstrate financial discipline and the benefits realized from the merger, such as reducing operational costs and achieving synergies.
Cost Savings, Merger, Expense Management, Financial Discipline, Synergies
false
Cost saves being realized and merger costs fadingGoldman Sachs US Financial Services Conference 2022
Multiple Chart
Goldman Sachs
View slide
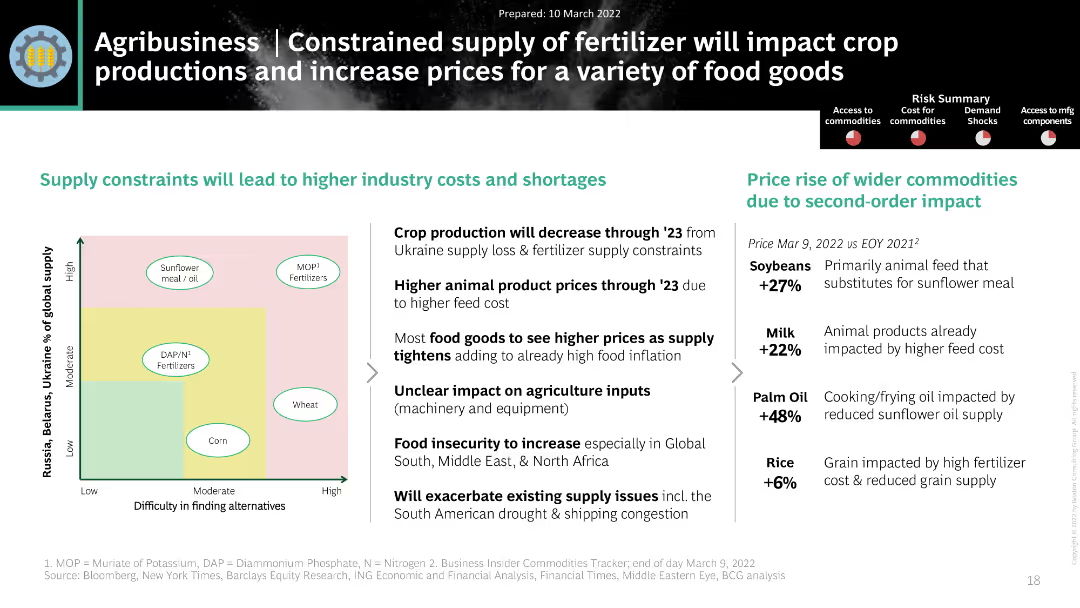
The slide includes a matrix chart and a column chart showing commodity price rises. The layout is moderately dense.
Market Analysis and Trends
Agriculture & Food Production
It discusses the constrained supply of fertilizers from Ukraine and its impact on crop production and prices of food goods.
Agribusiness, Fertilizers, Crop Production, Prices, Ukraine
false
Agribusiness | Constrained supply of fertilizer will impact crop productions and increase prices for a variety of food goodsWar in Ukraine: Initial view on Supply Chain Impact
Header Horizontal
BCG
View slide
Illustrates the segmentation of customer base into free and premium members, with a diagram showing current features and expansion potential.
Market Analysis and Trends
Financial Services
This slide provides an analysis of the premium membership model, showcasing the transition from a free user base to a more comprehensive premium service, highlighting the potential for substantial growth through added features and services.
premium membership, customer base, expansion, segmentation, services
false
Premium membership now draws from a growing free member base and expanding productBarclays Global Credit Bureau Forum
Mixed Chart
Barclays
View slide
Slide features column charts and statistical data on partnership growth, deal numbers, and discount rates within the debt collection market.
Risk Assessment and Management
Financial Services
Highlights the success of the "Limpa Nome" marketplace in Brazil, showcasing its effectiveness in debt negotiation and financial recovery for consumers.
debt negotiation, financial recovery, Brazil, marketplace, Limpa Nome
false
Limpa Nome is already the go-to solution for Brazilians to negotiate their debt and pay their billsBarclays Global Credit Bureau Forum
Multiple Chart
Barclays
View slide
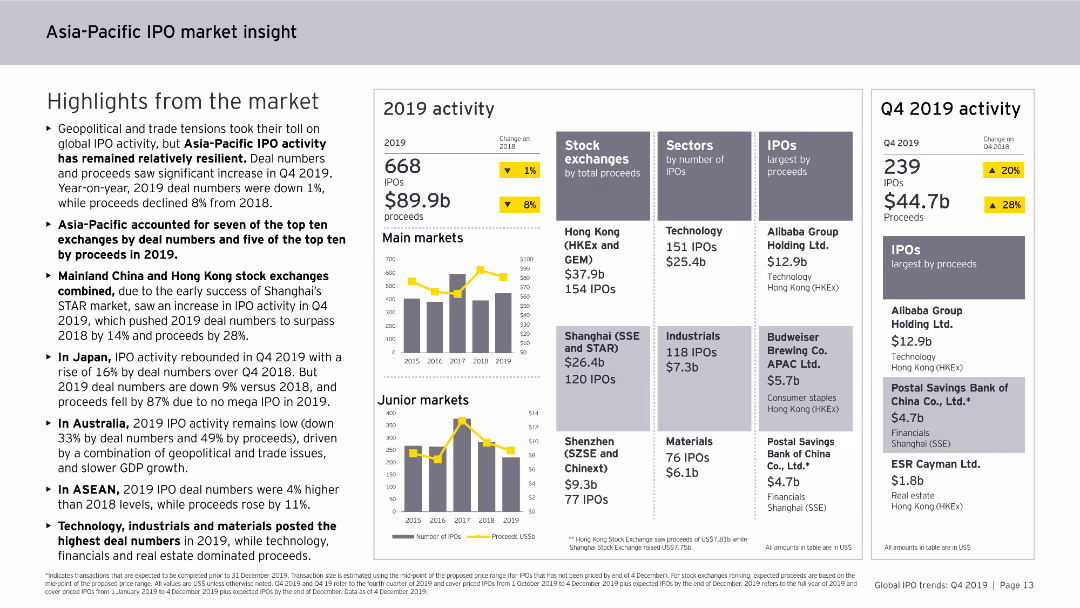
Features column charts, data tables, and bullet points. The slide is visually detailed, focusing on IPO activities and trends in the Asia-Pacific region for 2019.
Market Analysis and Trends
Financial Services
Analyzes IPO market trends in the Asia-Pacific region for 2019, including major stock exchanges, sector performances, and the impact of geopolitical and trade tensions on IPO activities.
Asia-Pacific, IPO, market insight, 2019, trends
false
Highlights from the market •Geopolitical and trade tensions took their toll on global IPO activityCould today’s uncertainty be your best opportunity to prepare?
Multiple Chart
EY
View slide
Side-by-side layout; left side features text with white font on blue background, right side shows horizontal bar chart with country comparisons (agree/disagree %)
Risk Assessment and Management
Artificial Intelligence
This slide presents the percentage of people in various countries who believe AI will worsen misinformation and disinformation. It shows a global average of 51% agreement, with Canada and New Zealand among the highest. The visual illustrates broad concern about AI's societal impact.
AI, misinformation, disinformation, public perception, survey, global comparison, risk, Ipsos, technology, ethics
false
For a majority, this entails that A.I. is going to make misinformation and disinformation worseGLOBAL VIEWS ON A.I. AND DISINFORMATION
Mixed Chart
IPSOS
View slide
The slide contains a column chart showing a path to a ROE target with annotations, using a simple and effective design with a monochromatic color scheme for emphasis on growth levers.
Strategic Planning
Financial Services
The slide outlines strategic growth initiatives for achieving mid-teens return on equity (ROE) targets. It showcases the progression of initiatives in transaction banking, wealth management, consumer services, and alternatives, likely meant for discussing long-term financial growth and investment strategies.
ROE target, Growth initiatives, Transaction banking, Wealth management, Investment strategies
false
Scaled Growth Initiatives Will Provide Levers to Mid-Teens ReturnsGoldman Sachs Presentation to Bernstein Strategic Decisions Conference
Single Chart
Goldman Sachs
View slide
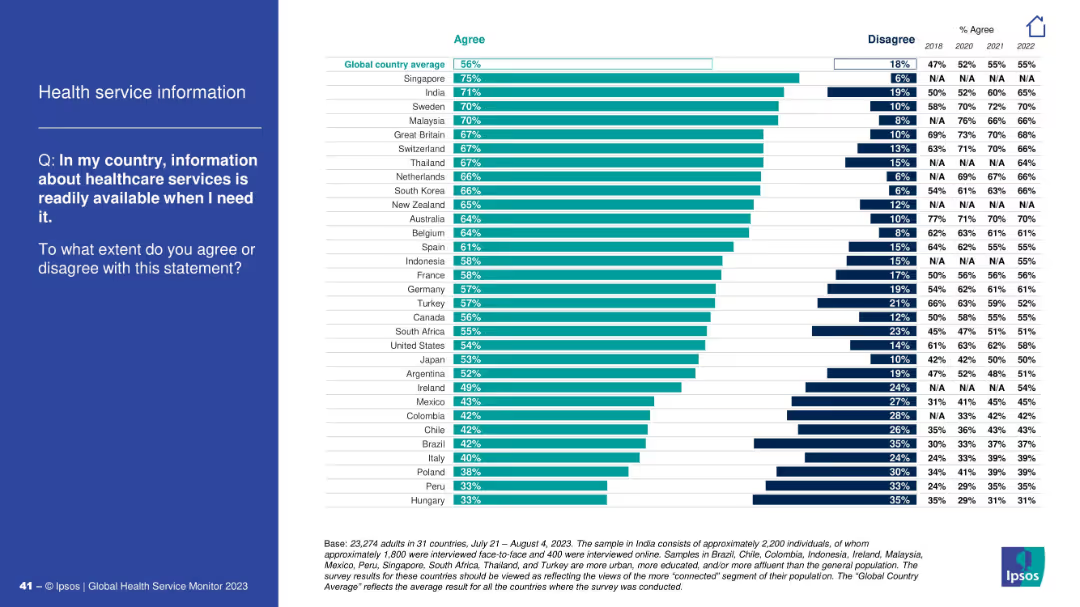
Ranked horizontal bar chart displaying agreement levels across countries about healthcare services info availability.
Operational Efficiency
Healthcare & Pharmaceuticals
The slide evaluates public perception of how accessible healthcare service information is across countries. Singapore and India top the list; Hungary and Peru rank lowest in perceived availability.
service info, healthcare accessibility, perception, country comparison, Ipsos, global average, information access
false
Health service informationIPSOS GLOBAL HEALTH SERVICE MONITOR 2023
Mixed Chart
IPSOS
View slide
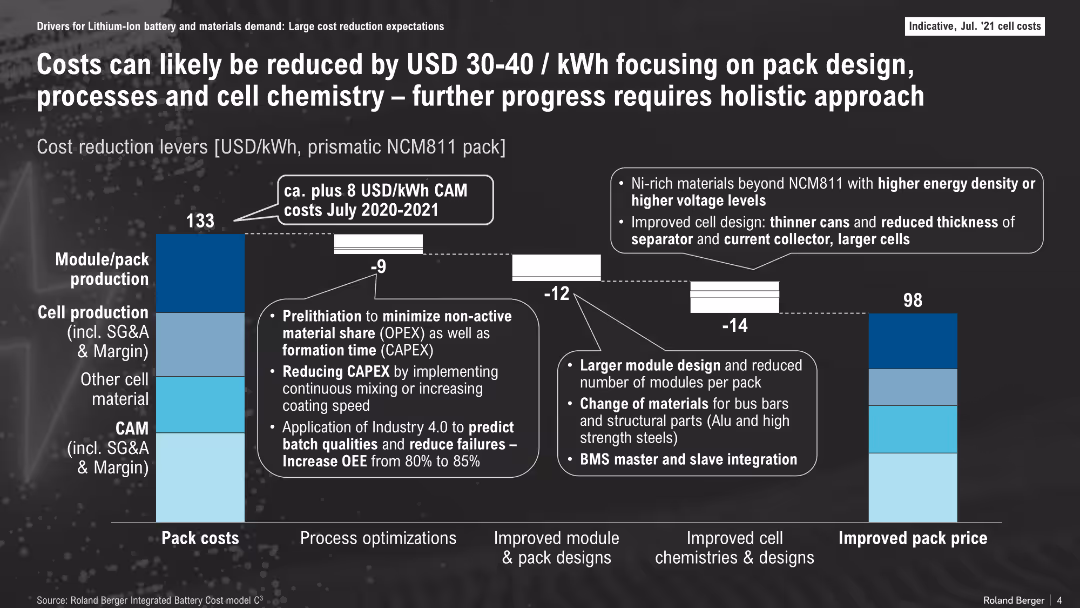
Bar chart comparing 2020-2021 and future cost breakdowns with annotations; segmented by cost areas
Operational Efficiency
Energy & Utilities
This slide breaks down battery pack cost components and shows how design, process, and material improvements can lower costs from $133/kWh to $98/kWh. Key levers include pack/module redesign, cell production optimization, and chemistry upgrades.
cost reduction, pack design, NCM811, cell production, BMS, energy storage, CAPEX
false
Costs can likely be reduced by USD 30-40 / kWh focusing on pack design, processes and cell chemistry – further progress requires holistic approachThe Lithium-Ion (EV) battery market and supply chain
Mixed Chart
Roland Berger
View slide
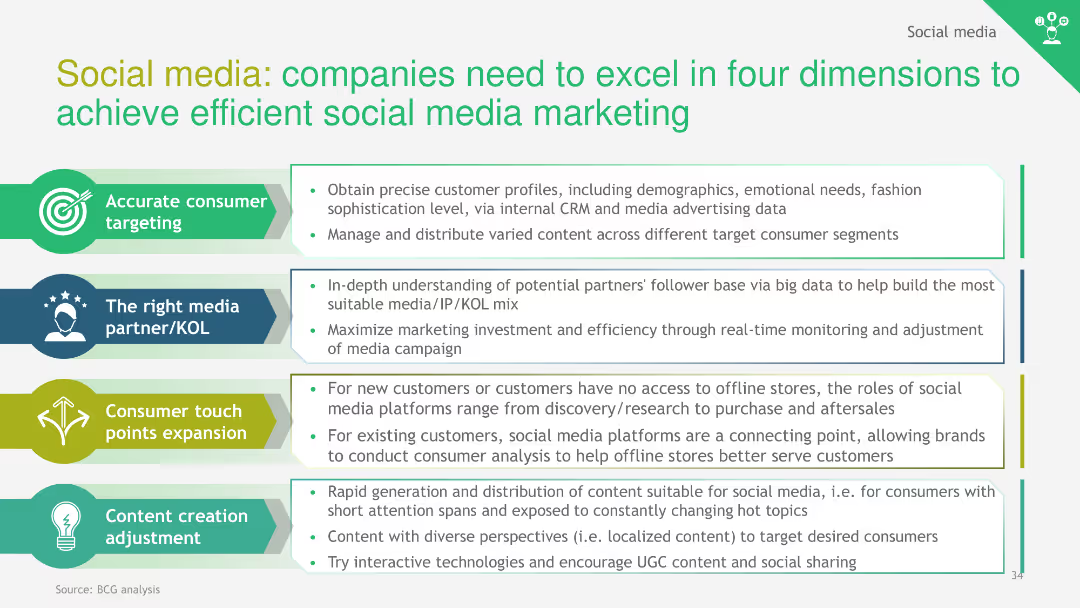
The slide displays a flowchart outlining four key dimensions for effective social media marketing: consumer targeting, media partners, touch points expansion, and content adjustment.
Sales and Business Development
Consumer Goods
This slide discusses four critical areas for successful social media marketing: accurate consumer targeting, selecting the right media partners, expanding touch points, and content creation.
social media, marketing strategy, consumer targeting, media partners, content creation
false
Social media:companies need to excel in four dimensions to achieve efficient social media marketingChina Luxury Digital Playbook
Table
BCG
View slide
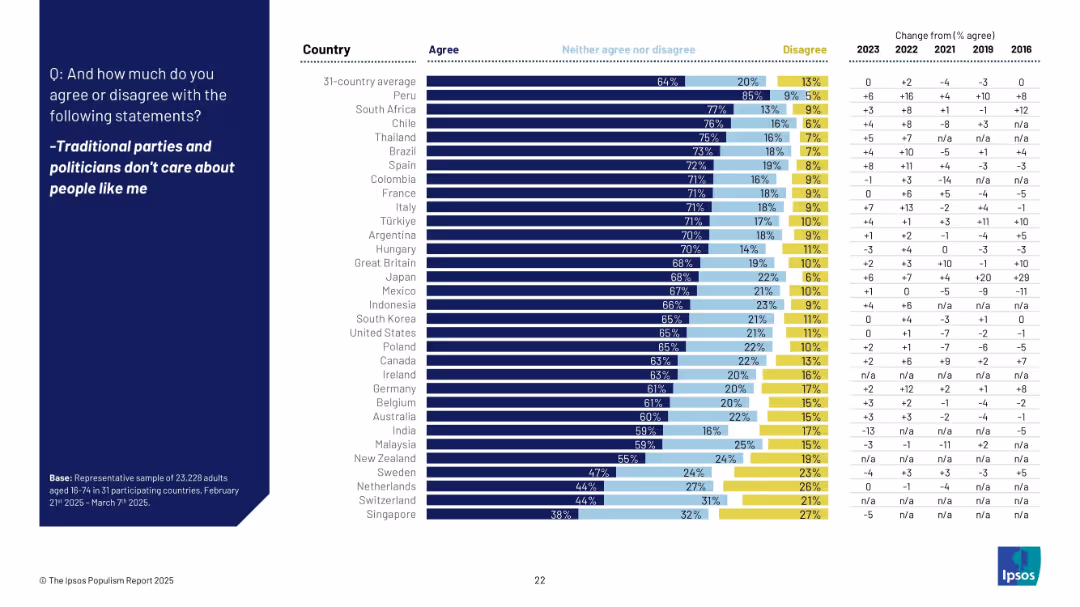
Horizontal bar chart comparing 31 countries' agreement rates on political alienation. Right-hand column includes multi-year trend comparisons.
Market Analysis and Trends
Government & Public Sector
This slide focuses on political alienation across countries. Agreement is highest in Peru, South Africa, and Chile, with sentiment increasing in many countries. Japan saw a 29pp rise since 2016, indicating growing distrust in traditional political institutions.
political alienation, distrust, Ipsos, traditional parties, public opinion, international trends, populism
false
Q: And how much do you agree or disagree with the following statements? -Traditional parties and politicians don't care about people like meTHE IPSOS POPULISM REPORT 2025
Mixed Chart
IPSOS
View slide
Contains bulleted lists, icons, small text, two columns
Industry Overview
Technology & Software
Explains benefits of CAI in customer service
CAI, customer service, ML models, CSAT
false
Transforming Customer Experience with Conversational AITrends & AI in the Contact Center
Header Vertical
Deloitte
View slide
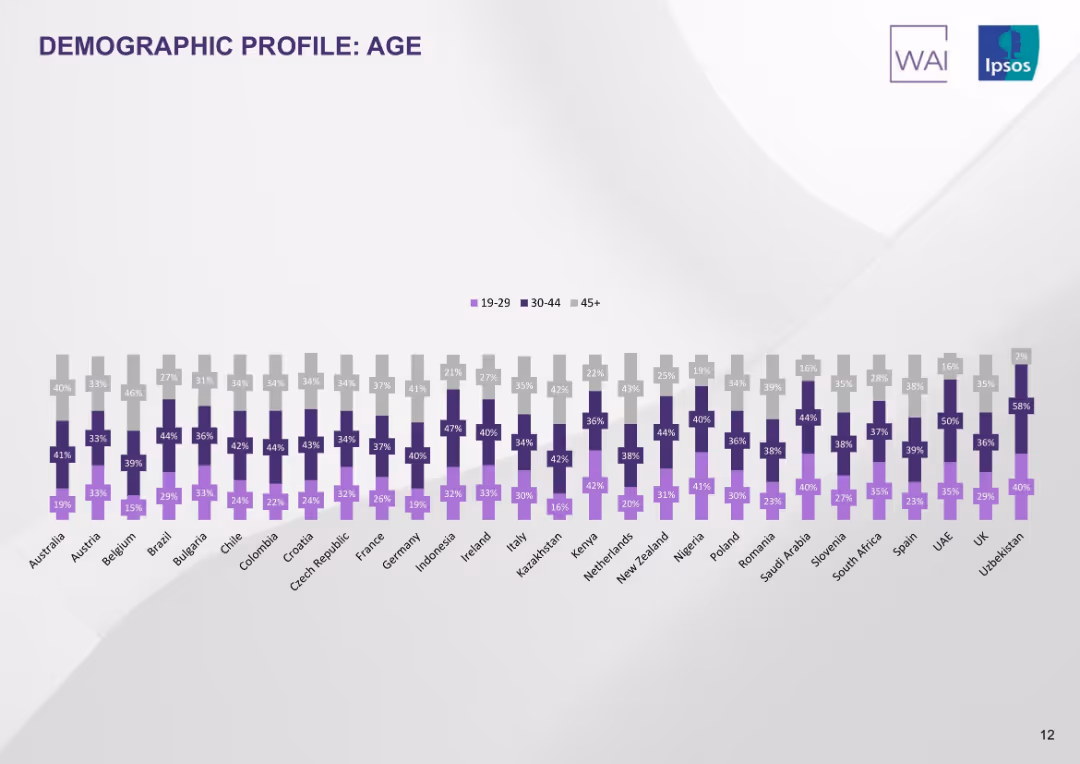
Triple bar chart per country showing proportions of age groups (19–29, 30–44, 45+). Uniform color scheme per age band.
Customer and Market Segmentation
Healthcare & Pharmaceuticals
This slide illustrates the age distribution of survey respondents across countries. Each country shows variation in age group proportions, revealing demographic representation in the study sample.
age profile, demographics, age distribution, respondent base, countries, tobacco users, Ipsos, segmentation
false
DEMOGRAPHIC PROFILE: AGEINNOVATION UNDER FIRE: A Global Alert on the Misperception Epidemic in Vaping Views
Single Chart
IPSOS
View slide
This slide includes a detailed process diagram of the IPO stages, with icons and text explaining each phase from pre-kickoff to post-IPO. The layout is clear and structured, enhancing comprehension.
Strategic Planning
Financial Services
Provides a comprehensive overview of the IPO process, detailing each phase including preparation, execution, and post-IPO activities, emphasizing transparency and structural needs of the company.
IPO process, public offering, preparation, execution, post-IPO, company structure, investment, financial planning
false
Overview of the IPO processReady to go public? Initial Public Offering (IPO)
Linear Flow
PwC/Strategy&
View slide
Consists of a world map, key facts list, and a pie chart showing sales distribution. The slide is visually dense with a high level of detail.
Operational Efficiency
Technology & Software
Provides an overview of Clarion's global presence, focusing on sales by region and the distribution of its manufacturing and development centers, emphasizing the company's operational scope.
Clarion, global, sales, manufacturing, development, automotive
false
Clarion profileDeutsche Bank Global Auto Industry Conference
Mixed Chart
Deutsche Bank
View slide
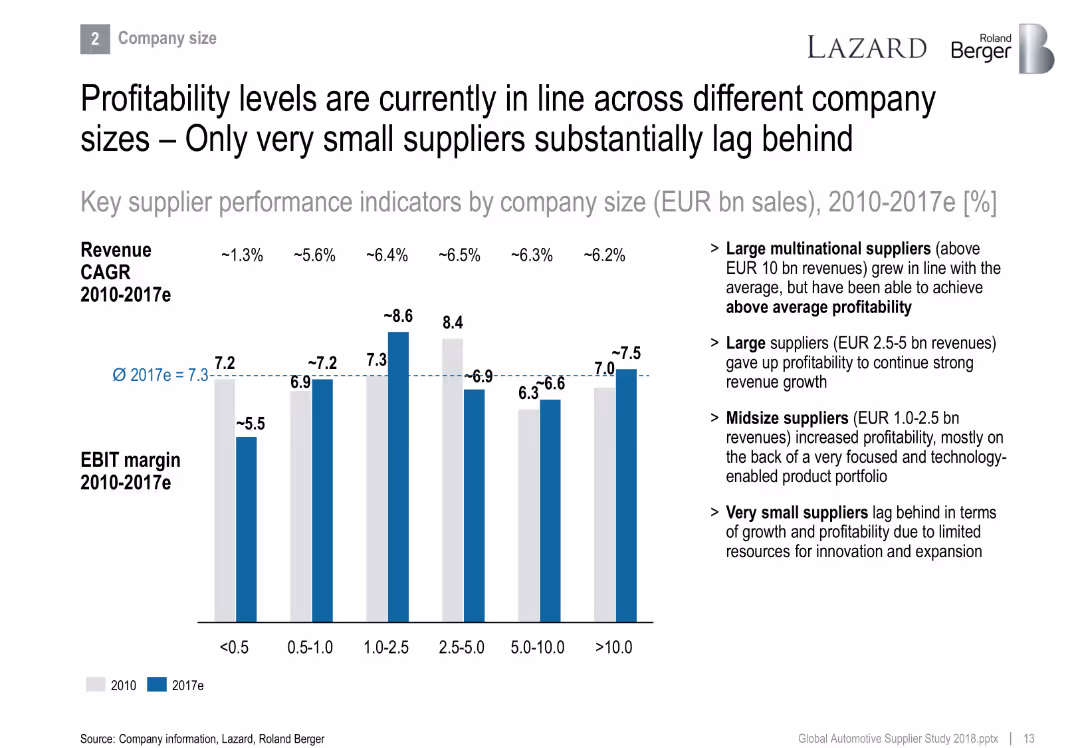
Bar chart showing EBIT margin and revenue CAGR by supplier size (based on revenue tiers), with commentary on performance by tier.
Financial Performance
Industrial & Manufacturing
Analyzes profitability across different company sizes. Midsize and large suppliers outperform very small ones. The insights emphasize benefits of scale, innovation, and focused portfolios in driving profitability.
company size, profitability, growth, EBIT margin, revenue tier, automotive suppliers
false
Profitability levels are currently in line across different company sizes – Only very small suppliers substantially lag behindThe overall positive sentiment was also reflected in the supplier valuation levels that still trade above their long-term average
Mixed Chart
Roland Berger
View slide
Contains column chart and detailed financial metrics, focusing on banking and wealth management sectors.
Financial Performance
Financial Services
Evaluates financial performance in personal banking and wealth management, focusing on net income and revenues.
personal banking, wealth management, financial performance
false
Personal Banking & Wealth Management ResultsFirst Quarter 2023 Earnings Results Presentation
Mixed Chart
Citigroup
View slide
This slide is focused on the Chinese luxury goods market, featuring a column chart that track consumption growth from 2012 to 2017, compared to non-Chinese markets. It uses contrasting colors like red for China and gray for other markets, effectively highlighting the differences in growth rates.
Market Analysis and Trends
Consumer Goods
Highlights the booming luxury goods consumption in China, contrasting it with more moderate growth in other global markets. Details the impact of increased consumer confidence and economic factors in China, while providing a broader view of global market trends.
China, luxury goods, market growth, consumer behavior, global comparison
false
BOOMING CHINESE CONSUMPTION PAIRED WITH HEALTHY GROWTH OF OTHER NATIONALITIESALTAGAMMA 2017 WORLDWIDE LUXURY MARKET MONITOR
Single Chart
Bain
View slide
Slide with a stacked column chart showing the growth of the SEA Internet economy GMV from 2015, projecting significant growth by 2025, categorized by sectors like e-Commerce and Online Travel.
Financial Performance
Technology & Software
Presents the growth trajectory of the SEA Internet economy, highlighting resilience and future potential in various digital sectors, important for investment and economic forecasts.
SEA, Internet economy, GMV, growth, e-Commerce, Online Travel, forecast, resilience
false
The SEA Internet economy will exceed $100B GMV this year despite headwindse-Conomy SEA 2020 At full velocity: Resilient and racing ahead
Single Chart
Bain
View slide
Column chart and multiple bar charts showing the loyalty of EV owners to charging providers based on location convenience, price, and power. It includes tariff usage and reasons for choosing different providers.
Customer and Market Segmentation
Transportation & Logistics
This slide analyzes the loyalty of EV owners to their charging providers, emphasizing factors such as location convenience, pricing tariffs, and power speed. It also discusses reasons for switching providers and typical tariff usage.
charging provider loyalty, location convenience, tariff usage, EV owners, provider comparison
false
EV owners are loyal to their charging provider, driven by the location closeness and tariff - subscription plans still show limited uptake4th edition eReadiness 2023
Multiple Chart
PwC/Strategy&
View slide
The slide presents a table with various economic indicators for different countries, including PMI, industrial production, business confidence, and more, with color-coded performance indicators.
Market Analysis and Trends
Financial Services
A comprehensive overview of economic health indicators for multiple countries, highlighting strengths and weaknesses in areas like manufacturing, business confidence, and inflation rates.
Economic health, PMI, business confidence, industrial production, country comparison
false
Recent data show improving economic momentum, but rising financial risks and persisting inflationary pressures continue to cloud the economic outlookMarch Macro Brief Financial fissures emerge
Table
Accenture
View slide
Composed of stacked column charts for purchase sales, EOP loans, and deposits with a key for interpreting the data. Blue and grey tones dominate.
Financial Performance
Financial Services
Reflects on the company's strategic impact, presenting year-over-year growth in sales, loans, and deposits to illustrate improved client engagement.
Strategy, Client Engagement, Sales, Loans, Deposits, Year-over-Year, Growth Metrics
false
Our Strategy is Driving Improved Client EngagementGlobal Consumer Banking
Multiple Chart
Citigroup
View slide
The slide displays multiple line graphs with color-coded lines representing different countries.
Strategic Planning
Healthcare & Pharmaceuticals
This slide compares COVID-19 case trends in various countries, categorized into groups like 'Continuation' and 'Crush and contain', useful for analyzing pandemic responses.
COVID-19, cases, trends, countries, graphs
false
COVID-19 has broad geographic reach today with countries at different stages in their fightWhat the Evolution of Travel Means for Business
Multiple Chart
BCG
View slide
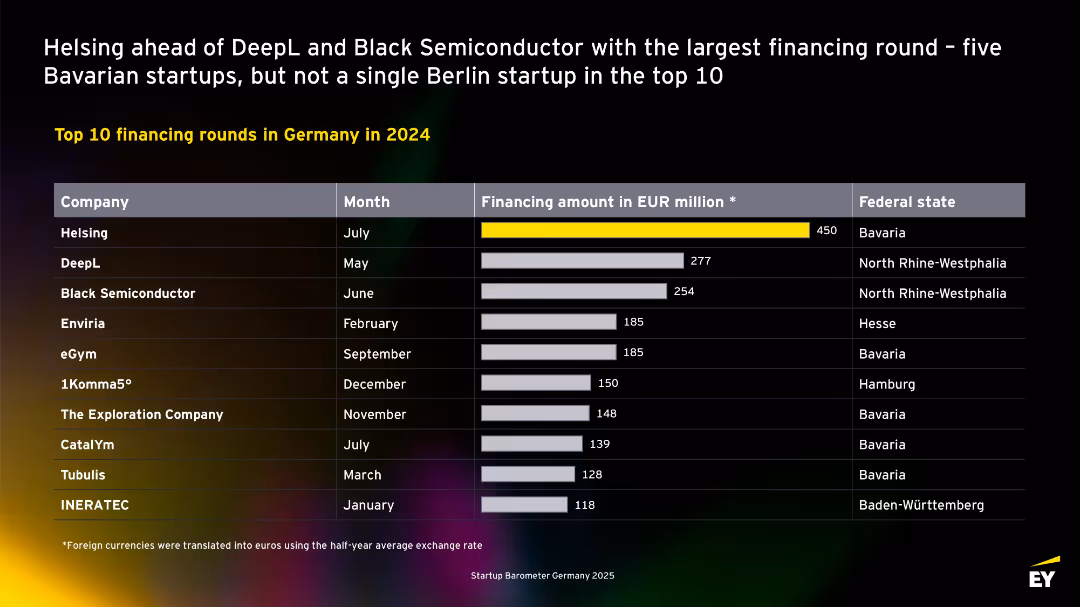
Table format with company names, months, financing amounts, and states. Highlights top deals of the year. No Berlin companies in the top 10, majority from Bavaria.
Investment Analysis
Technology & Software
Lists the top 10 startup financing rounds in Germany for 2024. Helsing leads with €450M, followed by DeepL and Black Semiconductor. Most top-funded companies are based in Bavaria and North Rhine-Westphalia. Berlin is notably absent from the list.
top deals, Bavaria, DeepL, Helsing, financing rounds, 2024, Germany, startups, investment
false
Helsing ahead of DeepL and Black Semiconductor with the largest financing round – five Bavarian startups, but not a single Berlin startup in the top 10EY Startup Barometer Germany
Single Chart
EY
View slide
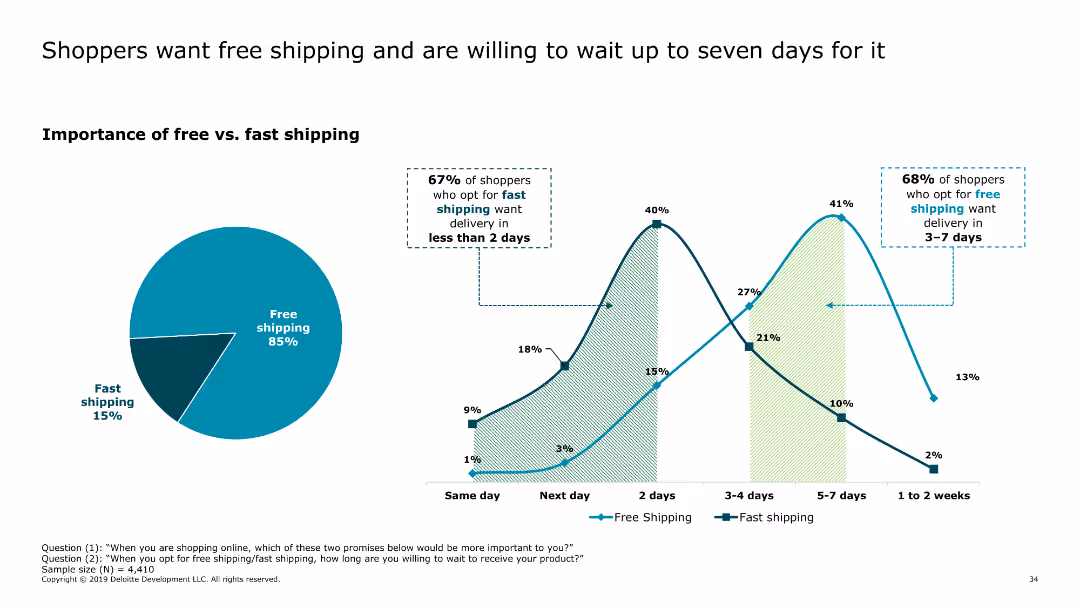
This slide includes a pie chart showing the importance of free versus fast shipping, along with a line chart illustrating delivery time preferences for free and fast shipping options.
Market Analysis and Trends
Retail & E-commerce
The slide highlights consumer preferences for free shipping over fast shipping, with many shoppers willing to wait up to seven days for free delivery. It provides insights into delivery expectations and preferences.
free shipping, delivery preferences, consumer behavior, online shopping, shipping options
false
Shoppers want free shipping and are willing to wait up to seven days for it2019 Holiday Survey of Consumers Keeping the good times rolling
Multiple Chart
Deloitte
View slide
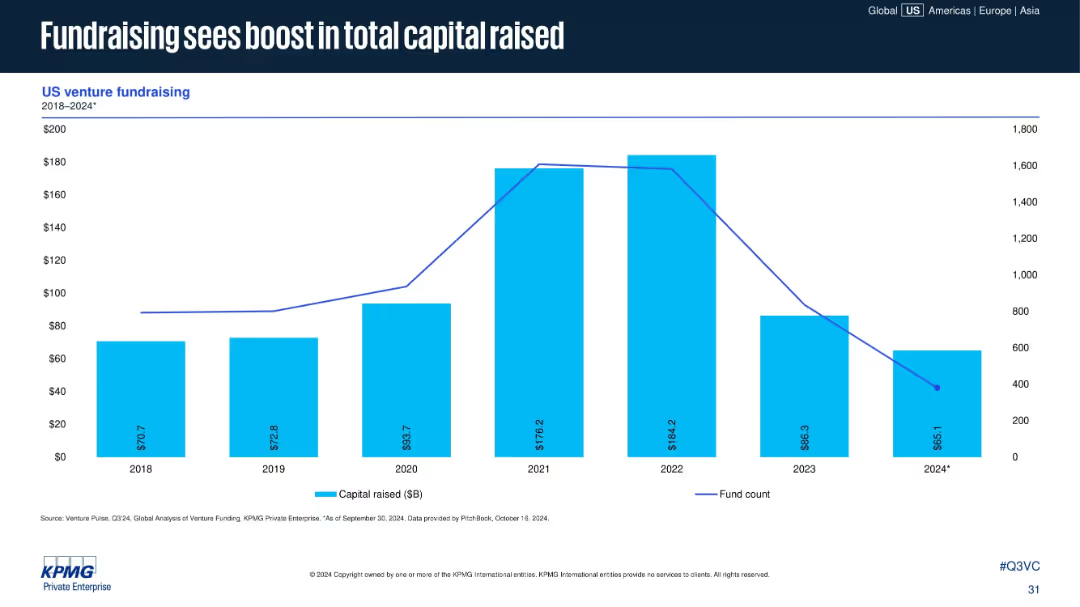
Bar-line combo chart with blue bars for capital raised ($B) and a line showing fund count. Covers years 2018–2024*.
Investment Analysis
Financial Services
Despite fewer funds being raised in 2024, total capital raised saw a notable increase, suggesting fewer but larger funds. The chart indicates peak capital in 2021–2022, followed by a decline in fund count through 2024.
fundraising, capital raised, fund count, VC funds, 2024 trend, venture capital, large funds, investment cycle
false
Fundraising sees boost in total capital raisedVenture Pulse Q3 2024
Single Chart
KPMG
View slide
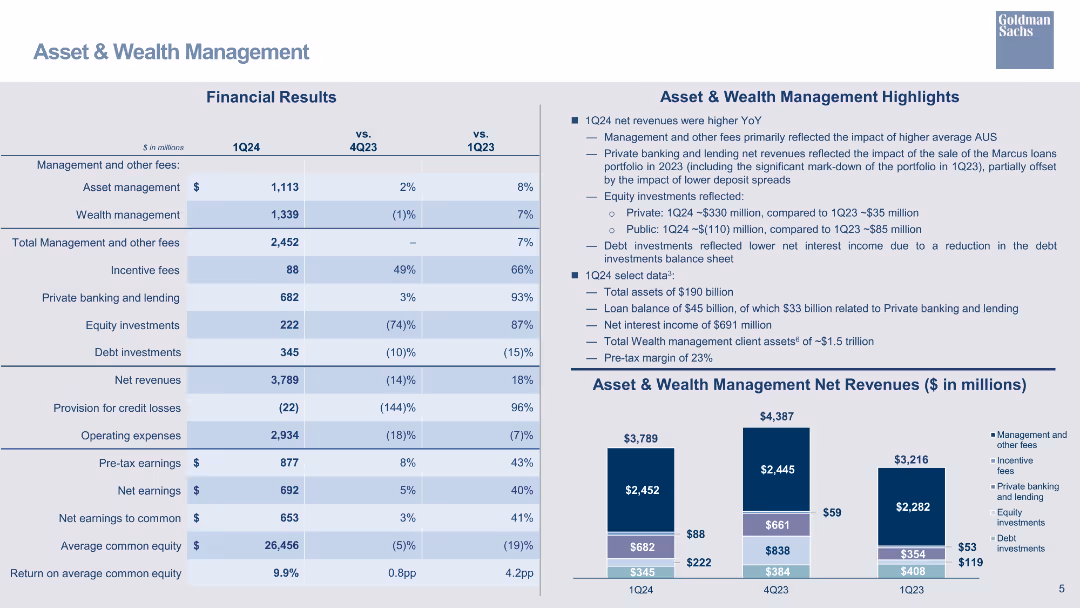
A table detailing financial results for the Asset & Wealth Management segment, accompanied by bar charts and key highlights.
Financial Performance
Financial Services
Presents financial results for the Asset & Wealth Management segment, highlighting revenues, operating expenses, and earnings.
asset management, wealth management, financial results, bar chart, net revenue, operating expenses, earnings
false
Asset & Wealth Management Asset managementFirst Quarter 2024 Earnings Results Presentation
Mixed Chart
Goldman Sachs
View slide
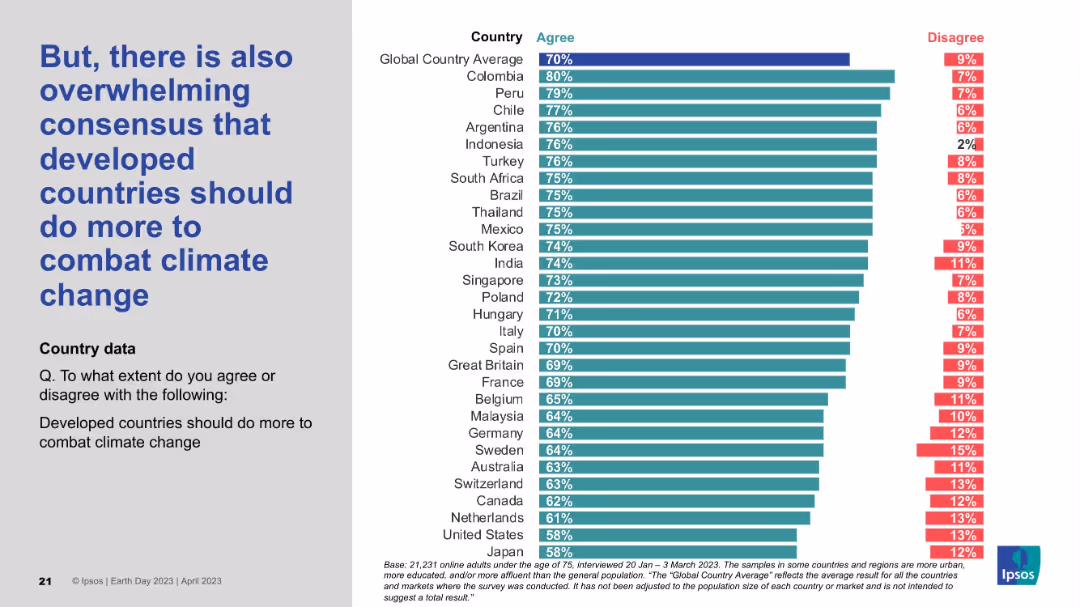
Left-side statement in bold blue; right side is a ranked horizontal bar chart by country with percentage agreement and disagreement.
Strategic Planning
Environmental Services & Sustainability
This slide highlights a strong international consensus that developed countries should take more proactive steps to address climate change. Most countries reflect agreement levels well above the global average, underscoring expectations for greater developed-world leadership.
climate action, developed nations, responsibility, global consensus, policy pressure, survey data, Earth Day 2023
false
But, there is also overwhelming consensus that developed countries...EARTH DAY 2023
Mixed Chart
IPSOS
View slide
Line chart showing quarterly performance of top luxury players in 2023 vs. 2022.
Competitive Landscape
Consumer Goods
Highlights the performance trends of leading luxury brands and the observed industry-wide slowdown.
Luxury, Performance, Trends, Brands, Industry
false
Sector Performance of Top Luxury PlayersGlobal State of Luxury 2024
Mixed Chart
Kearney
View slide
Bar chart focused on Nordics’ deal volumes by industry from 2001–H1 2024; industry segments are color-coded; growth/decline rates shown.
Market Analysis and Trends
Financial Services
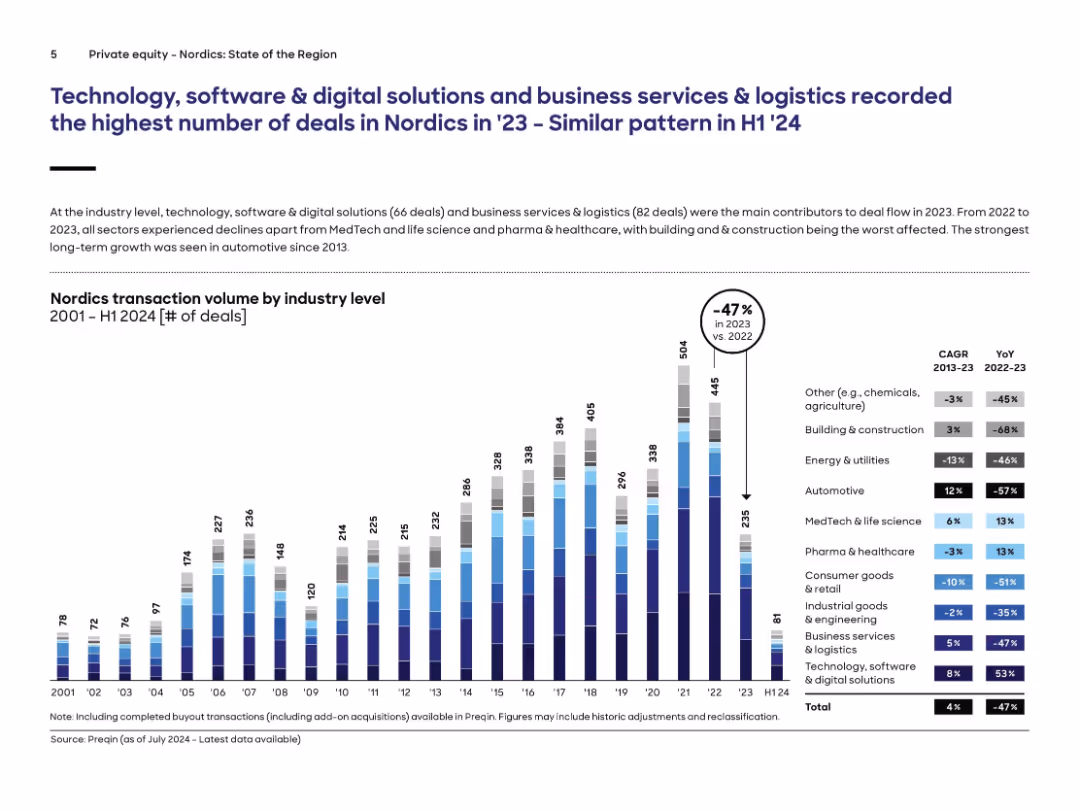
Nordics transaction volumes fell by 47% in 2023, driven by declines across most sectors. However, digital solutions and business services remained dominant. The only sectors with YoY growth were MedTech/life sciences and pharma. The long-term growth leader was automotive. The chart segments deal volume by industry, showing trends and relative contributions to overall volume.
Nordics, private equity, industry trend, transactions, decline, MedTech, digital solutions, logistics
false
Technology, software & digital solutions and business services & logistics recorded the highest number of deals in Nordics in '23 – Similar pattern in H1 '24When will the knot finally unravel?
Single Chart
Roland Berger
View slide
This slide features a line chart depicting the Global economic policy uncertainty index from 1997 to 2022, and a column chart showing year-over-year percent change in real GDP from 2019 to 2024 for various regions and countries. It uses a blue and white color scheme with clear labels and legends.
Market Analysis and Trends
Financial Services
The slide analyzes persistent inflation and elevated interest rates, showcasing global economic policy uncertainty and projected real GDP changes for different regions and countries, suggesting these as continued characteristics of the economic slowdown.
inflation, interest rates, economic slowdown, GDP, policy uncertainty
false
Persistent inflation and elevated interest rates are likely to be continued characteristics of this slowdown2023 Global Macroeconomic Outlook
Multiple Chart
EY
View slide
Bar chart comparing trade value with seven major countries; India trade section highlighted; use of black/red/gray with dotted annotation boxes
Strategic Planning
Government & Public Sector
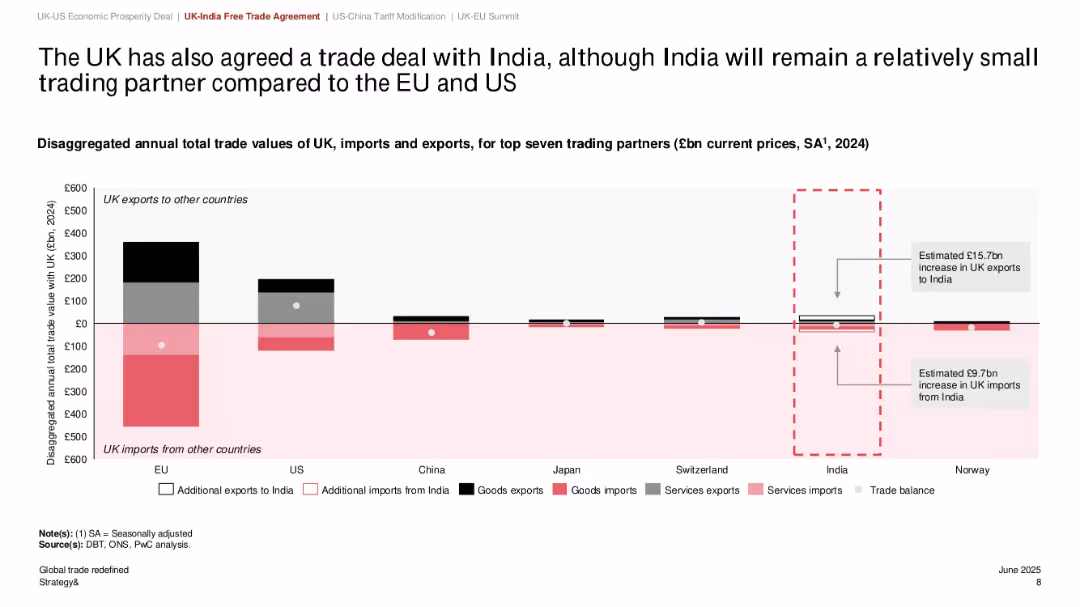
The slide outlines the UK's trade relationships with major countries, emphasizing a new trade deal with India. Though India remains a small trade partner compared to the EU and US, the deal is expected to add £15.7bn in UK exports and £9.7bn in imports. The chart helps position India's role within the UK's overall trade strategy.
UK-India trade, exports, imports, trade agreement, economic relations, top partners, global strategy
false
The UK has also agreed a trade deal with India...Global trade redefined: Early insights and economic impacts of new agreements
Single Chart
PwC/Strategy&
View slide
Four-part layout showing charts on fed funds expectations, Treasury yield curve, economic policy uncertainty, and breakeven inflation. Clean, with emphasis on policy impact indicators.
Regulatory and Compliance
Government & Public Sector
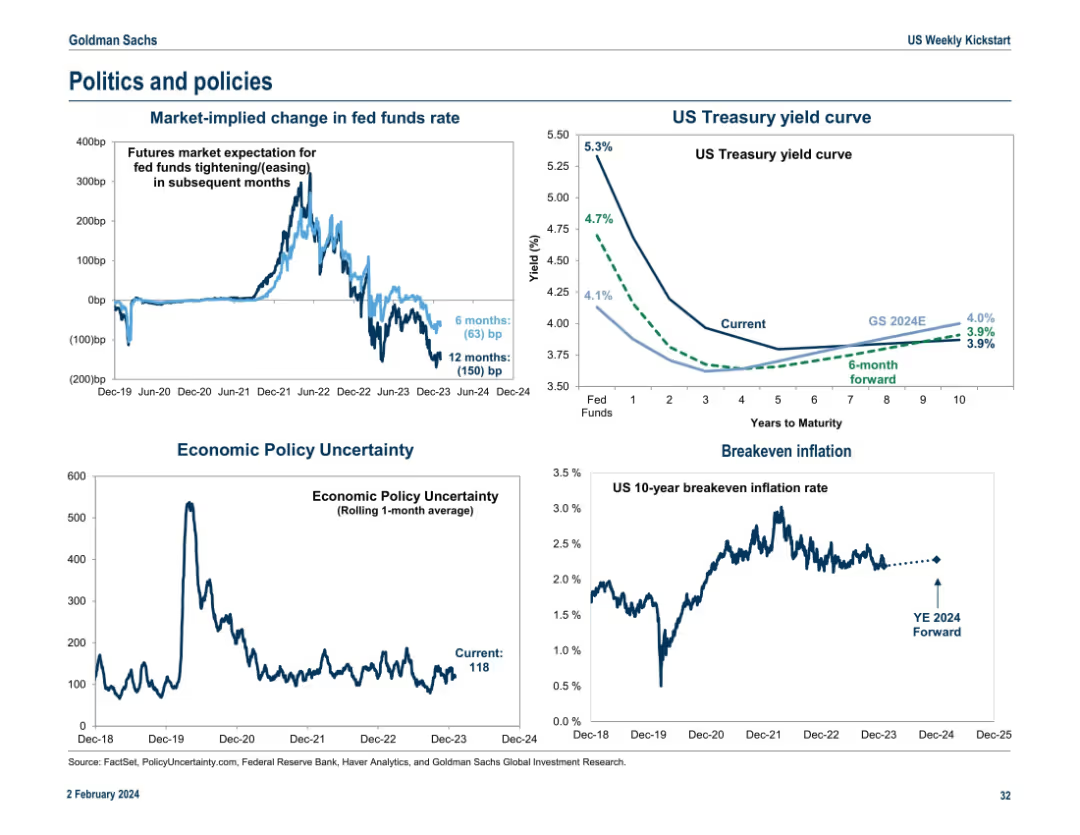
This slide illustrates the market's expectations for changes in interest rates, the yield curve, economic policy uncertainty, and breakeven inflation. It’s focused on projecting policy-related market impacts and assessing forward-looking economic and inflation expectations.
interest rates, yield curve, inflation, policy uncertainty, regulation
false
Politics and policiesUS Weekly Kickstart Fate of the ‘Magnificent 7’ stocks depends on their ability to deliver rapid revenue growth in 2024
Multiple Chart
Goldman Sachs
View slide
Three columns each with an icon at the top, detailing challenges and solutions in content distribution, advertising, and digital subscriptions.
Technology and Digital Transformation
Media & Entertainment
Discusses how digital advancements are reshaping publisher strategies in content distribution, advertising capabilities, and digital subscriptions.
digital, publishers, content distribution, advertising, subscriptions, first-party data, innovation, strategy, online
false
As readers spend more time online, publishers are innovating by improving first-party data, reimagining content distribution and mainstreaming digital subscriptionsWestern Europe News Media Landscape Trends
Pillar
Accenture
View slide
Graphically rich slide with column charts depicting capital usage and developments in regulatory capital efficiency, alongside explanatory texts and arrows for emphasis.
Strategic Planning
Financial Services
Details the bank's strategic adjustments in capital management aimed at enhancing long-term shareholder value and financial stability through sustainable investments and efficiency improvements.
capital management, long-term value, financial stability, shareholder value, regulatory efficiency
false
Shifting gears to drive long-term valueClient & Creditor Overview
Mixed Chart
Deutsche Bank
View slide
Flags and legal act titles from multiple countries categorized by legal status (in effect, passed, proposed).
Regulatory and Compliance
Government & Public Sector
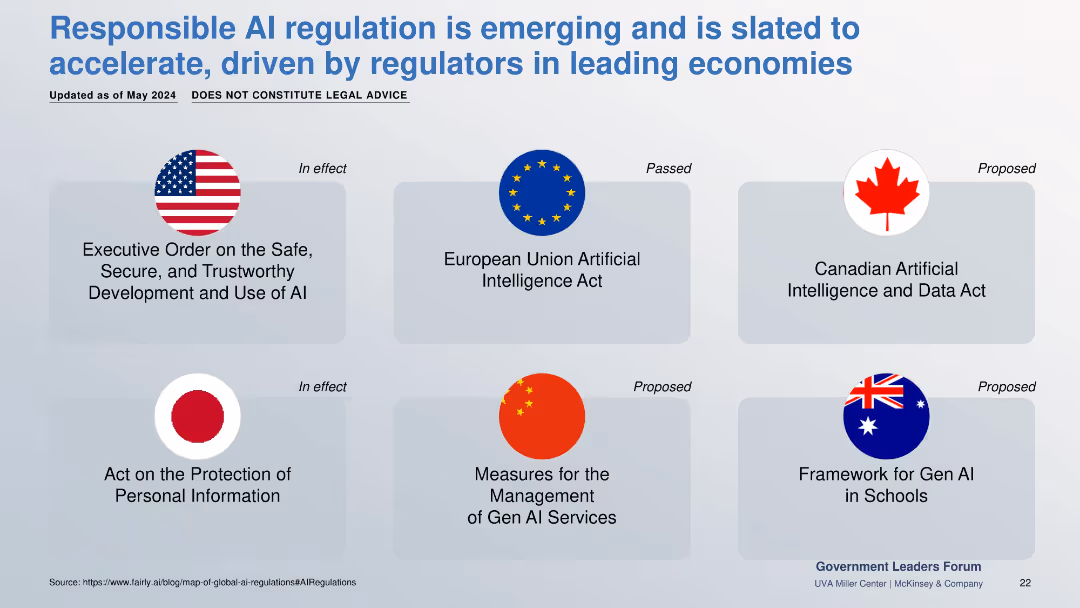
Overview of emerging and existing AI regulations across the US, EU, China, Canada, Japan, and Australia. Covers data protection, GenAI use in schools, and ethical governance frameworks.
AI regulation, global laws, compliance, policy, governance, GenAI law
false
Responsible AI regulation is emerging and is slated to accelerate, driven by regulators in leading economiesResponsible AI and Gen AI
Table
McKinsey
View slide
A column chart comparing current online privacy concerns to one year ago across various global regions, indicating changes in concern levels.
Risk Assessment and Management
Technology & Software
The slide assesses the change in online privacy concerns over the past year in different regions, showing the percentage increase or decrease.
column chart, online privacy, concern, comparison, regions, survey, global
false
Growing concerns towards online privacy are less pronounced in developed economies.MARKET DATA FROM SECONDARY SOURCES
Single Chart
IPSOS
View slide
Pie chart and bar chart detail where consumers prefer to charge EVs and their preferred public charging locations, respectively, using color coding and percentages.
Market Analysis and Trends
Transportation & Logistics
Assesses consumer charging behavior for electric vehicles, including most frequent charging locations and preferred charging station types, crucial for infrastructure planning in the automotive industry.
electric vehicles, consumer preferences, charging stations, public charging, infrastructure planning, home charging, station amenities
false
Consumer intent to use public charging options has grown YoY, but most electric vehicle intenders still plan to charge their vehicle at home, emphasizing the need for affordable home charging solutions as consumers may not have fully contemplated those extra costs.2024 Global Automotive Consumer Study
Multiple Chart
Deloitte
View slide
Features a line chart tracking the usage of channel partners by companies over a decade. Each point is annotated for clarity, and different sectors are highlighted with distinct colors. The layout includes a text box that provides additional insights and context to the trend depicted.
Operational Efficiency
Retail & E-commerce
The slide analyzes the long-term trend of companies moving towards direct marketing, reducing reliance on channel partners. This is relevant for discussions on operational strategies in marketing and sales, highlighting sector-specific behaviors and strategic shifts.
disintermediation, channel partners, marketing trends, operational strategy, direct marketing
false
Disintermediation trend: Percentage of companies using channel partners hits returns to historic lowThe CMO Survey The Highlights and Insights Report February 2022
Mixed Chart
Deloitte
View slide
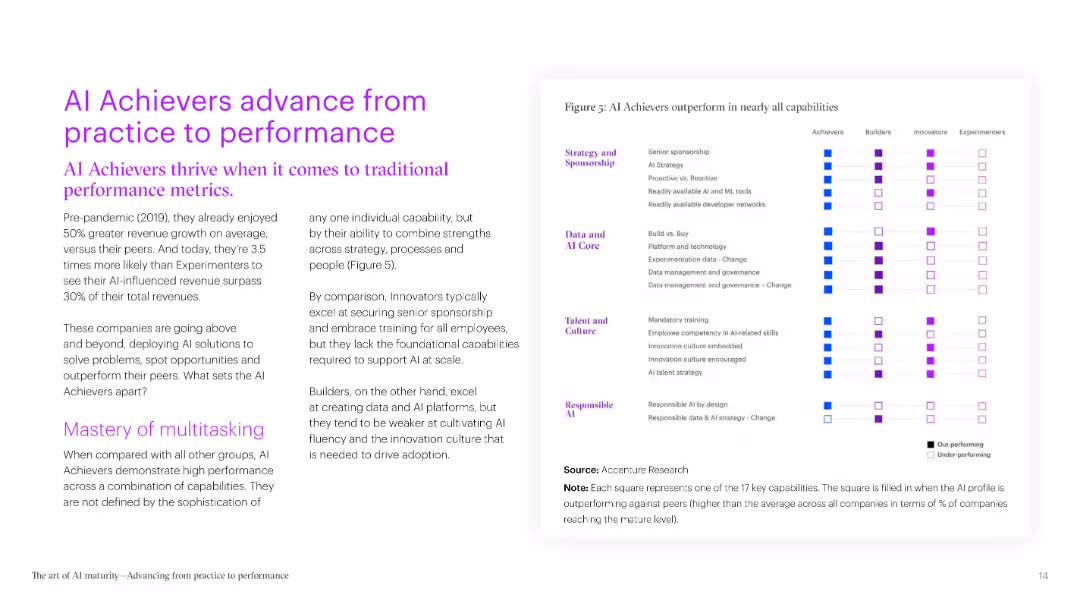
The slide includes a horizontal bar chart showing the stages of AI use in different functions. It features clear distinctions between Achievers and Experimenters, making the data easy to interpret.
Technology and Digital Transformation
Technology & Software
It discusses the transition of AI projects from pilot phases to full production, using Procter & Gamble as a case study. The slide highlights the effectiveness of scaling AI solutions across enterprises.
AI production, case study, scalability, implementation, pilot projects
false
AI Achievers advance from practice to performanceThe art of AI maturity Advancing from practice to performance
Boxed
Accenture
View slide
Contains multiple gears representing different economic indicators like unemployment rate, inflation, and GDP growth, alongside a map highlighting Namibia's geographical context.
Market Analysis and Trends
Government & Public Sector
Offers a comprehensive overview of Namibia's key economic indicators as of January 2018, useful for understanding the broader economic climate and its potential impacts on policy and investment decisions.
Economic, Statistics, GDP, Inflation, Map
false
Namibian Economic StatisticsRe-Imagine the Possible 2018/2019
Graphic
PwC/Strategy&
View slide
A grid layout with icons and text describes different technology implementation strategies. The design is instructional, with clear delineation between the models and a blue and black color scheme for readability.
Technology and Digital Transformation
Professional Services
This slide examines four archetypes of technology implementation within organizations. It's pivotal for leadership discussions about technology adoption, indicating the necessity for a strategic fit with existing business models and highlighting how ecosystems can facilitate technology integration.
Technology Implementation, Strategy, Business Model, Ecosystems, Organizational Fit
false
As you implement new technologies, pay attention to fit with business model and organizational capabilities...The top trends in tech - executive summary
Header Horizontal
McKinsey
View slide
A combination of a line chart and a stacked column chart. The line chart shows GDP per capita vs. urbanization. The stacked column chart shows middle-class growth contribution.
Market Analysis and Trends
Financial Services
The slide compares GDP per capita against urbanization ratios and forecasts the contribution of different regions to middle-class growth from 2024 to 2030.
GDP, urbanization, middle-class, growth, forecast, regions, contribution, financial trends, economic analysis, development
false
GDP per capita and middle-class growthGuide to Investing in Asia
Multiple Chart
JP Morgan
View slide
Column chart comparing departmental expenditures over two fiscal years. Departments like Education, Health, and Defense are highlighted with different colors for clarity.
Financial Performance
Government & Public Sector
Shows funding allocations to various government departments, useful for policy analysis and resource allocation discussions within public sector finance.
departmental spending, budget allocation, government finance
false
2023/24 Annual Budget Speech: Departmental ExpenditureDissecting the 2023/24 Annual Budget Speech
Single Chart
PwC/Strategy&
View slide
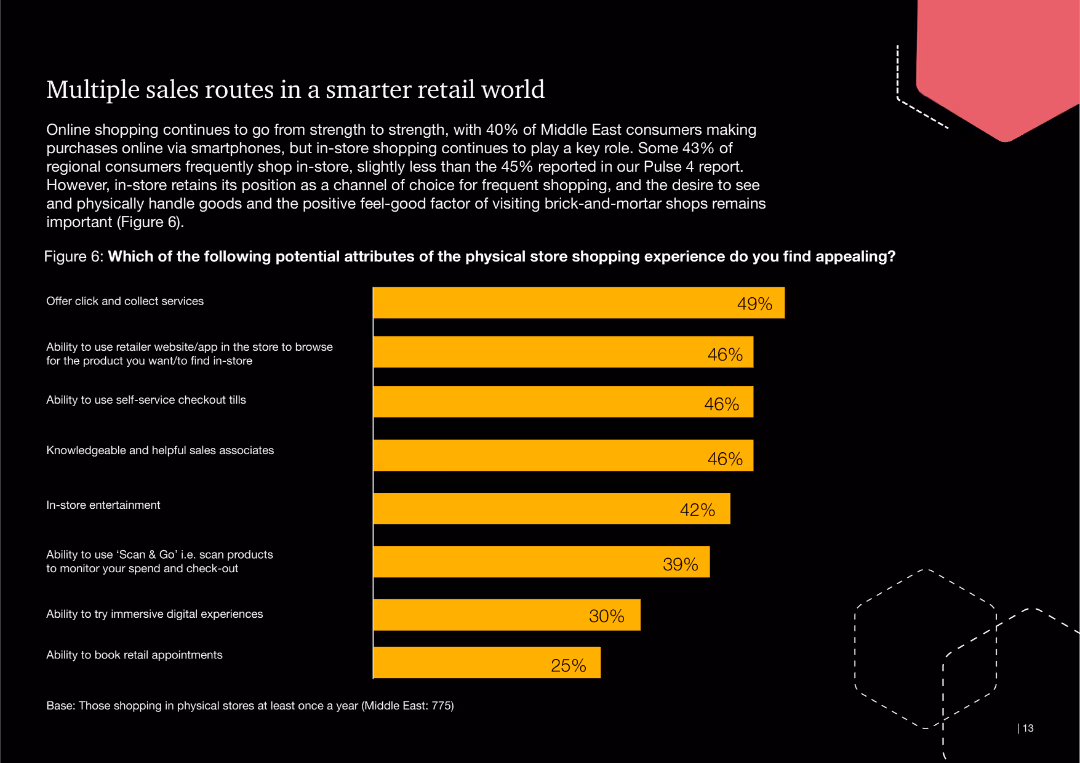
This slide includes a bar chart listing potential attributes of the physical store shopping experience that consumers find appealing, such as click-and-collect services and self-service checkouts.
Technology and Digital Transformation
Retail & E-commerce
The slide discusses the importance of various physical store features that appeal to consumers, emphasizing the role of digital tools and services in enhancing the retail experience.
retail, sales routes, physical store, consumer, click-and-collect, self-service
false
Multiple sales routes in a smarter retail worldInflation and rising prices shape a new hybrid Middle East consumer
Single Chart
PwC/Strategy&
View slide
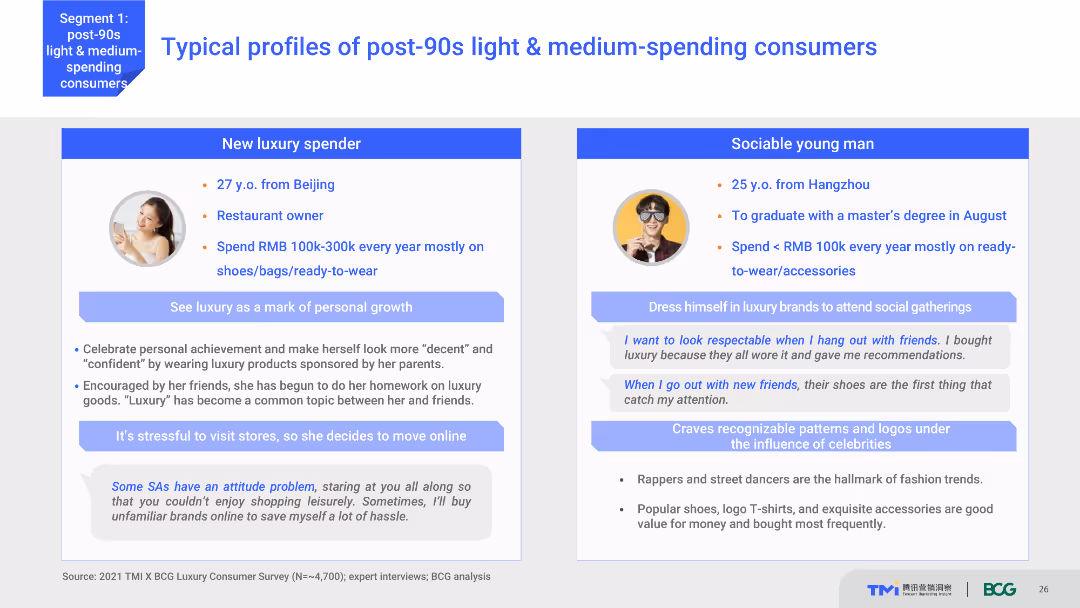
The slide features two detailed consumer profiles with personal information, spending habits, and preferences. It uses a content layout with text and images, providing a vivid portrayal of typical post-90s light & medium-spending consumers. The visual complexity is moderate, with clear, organized sections.
Customer and Market Segmentation
Consumer Goods
This slide presents detailed profiles of two typical post-90s light and medium-spending consumers, including their background, spending behavior, and luxury consumption habits. It aims to humanize market data through relatable examples.
consumer profiles, post-90s, spending habits, luxury market, consumer behavior
false
Typical profiles of post 90s light & medium spending consumersA New Generation of Chinese Consumers Reshaping the Luxury Market
Boxed
BCG
View slide
Slide contains three column charts showing growth in wealth management relationships, travel sales volume, and business banking clients from 2019 to 2022. The graphics are highlighted with arrows and percentage increase markers. The layout is clean and uses a blue color scheme to convey financial stability and trust.
Financial Performance
Financial Services
Analyzes investments across different business lines, showing growth in client relationships and sales volumes. It's likely used for illustrating the company's investment strategies' effectiveness and identifying areas of successful expansion and opportunities for further growth.
Investments, Wealth Management, Commerce, Business Banking, Client Relationships, Sales Volume
false
We are investing across our lines of business to serve more of our client needsInverstors Day 2023
Multiple Chart
JP Morgan
View slide
This slide includes a content layout with an organized table, icons for different aspects (People, Process, Technology), and a timeline outline. The slide is dense with text and data.
Regulatory and Compliance
Government & Public Sector
Slide includes implementation requirements, timeline outline, and risks. Features text blocks and icons for each section.
Discusses the development of in-state ITS residential options for individuals with complex care needs, outlining necessary steps and potential risks.
false
DD | ITS Residential Options | Summary (2 of 2)NH DHHS Operations Assessment
Table
Alvarez & Marsal
View slide
Graphs showcasing market indices and volatility trends, with side commentary on stock market recovery.
Investment Analysis
Financial Services
Reviews global equity market trends, emphasizing the volatility during the crisis and recovery patterns since lows in March.
equity markets, volatility, recovery, crisis, market indices, trends
false
Global equity markets have been highly volatile through the crisis, including their recovery since March lowsCOVID-19 BCG Perspectives Series Global Restart: Key Dynamics
Multiple Chart
BCG
View slide
This slide is a visual timeline from 2017 to 2020, showing major milestones and events in the company’s history. It uses a green arrow to depict progress over time, with text boxes providing details on key initiatives and changes.
Strategic Planning
Financial Services
The slide outlines the company’s strategic journey, showcasing major milestones such as acquisitions and corporate changes. It is useful for illustrating a company's evolution, strategy execution, and future plans.
Timeline, Strategic Journey, Milestones, Company Evolution, Future Plans
false
Our journey to deliver a focussed UK wealth management businessRMB Morgan Stanley Off Piste
Linear Flow
Morgan Stanley
View slide
A graphically dense slide with multiple data presentations, including bar charts, icons, and callouts to highlight key figures. The slide presents information in contrasting colors of blue and yellow, with clear demarcations for different sections. Visuals include statistics on battery electric vehicles (BEVs), charts showing a premium vs. overall market share, and highlighted quotations for emphasis. There is a clear hierarchy of information from top to bottom with a strong visual flow.
Technology and Digital Transformation
Industrial & Manufacturing
Discusses the advantage of the company's tires in electric vehicles (EVs) and presents data on the adoption of BEVs. It provides insights on market share and future sales projections, relevant for conversations on technology strategy in the automotive sector.
electrification, OEM, BEVs, market share, technology, tires, electric vehicles, sales projections, automotive
false
Electrification opportunity : differentiating with premium OEM segments, ready for attractive Replacement marketsRoad Show US West Coast Morgan Stanley
Mixed Chart
Morgan Stanley
View slide
This slide contains two column charts. The first chart shows MSCI Japan earnings growth estimates by sector for 2024 and 2025. The second chart shows MSCI Japan price-to-book ratios by sector. Color coding is used to differentiate data points.
Financial Performance
Financial Services
The slide analyzes sector earnings and valuations in Japan, focusing on earnings growth estimates and price-to-book ratios for different sectors. It is used for financial performance evaluation and investment decision-making.
Japan, sector earnings, valuations, MSCI, price-to-book, financial performance, investment
false
Japan: Sector earnings and valuationsGuide to the Markets Asia | 2Q 2024
Multiple Chart
JP Morgan
View slide
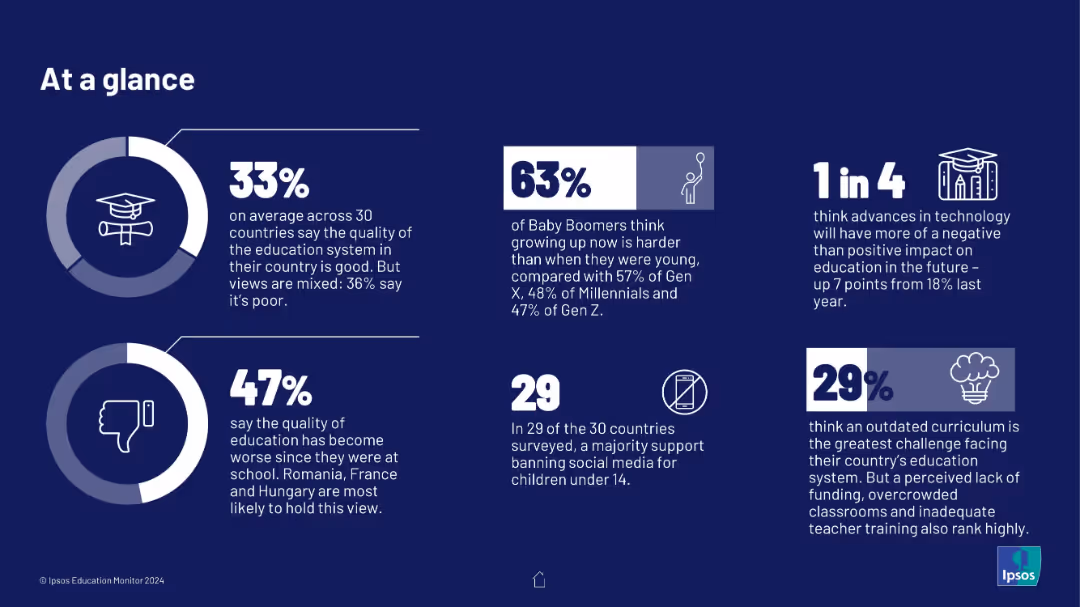
Grid of six statistic-based info-boxes on a dark blue background, each containing a percentage figure and icon, with minimal text explaining educational attitudes and perceptions.
Industry Overview
Education & Training
The slide provides a snapshot of global perceptions of education systems, tech’s impact, and social media concerns. It shows generational and geographic variances in confidence in education, curriculum quality, and views on childhood challenges.
education, perception, curriculum, technology, social media, quality, generational views
false
At a glanceIPSOS EDUCATION MONITOR 2024
Multiple Chart
IPSOS
View slide
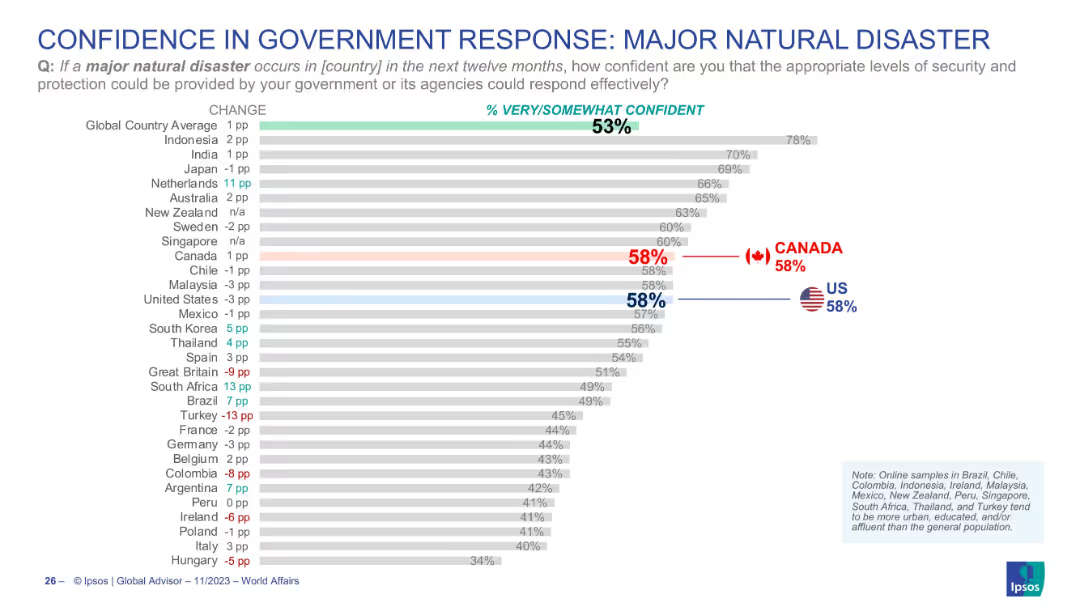
Horizontal bar chart indicating confidence levels in government response to natural disasters; Canada and US highlighted; global average shown.
Regulatory and Compliance
Government & Public Sector
This chart evaluates public confidence in how effectively their government could manage a major natural disaster. Canada and the US are both at 58%, slightly above the global average of 53%. It reflects perceived readiness and trust in national emergency management capabilities.
disaster response, government trust, crisis management, public perception, Canada, USA, Ipsos, emergency
false
CONFIDENCE IN GOVERNMENT RESPONSE: MAJOR NATURAL DISASTERWORLD AFFAIRS 2023
Single Chart
IPSOS
View slide
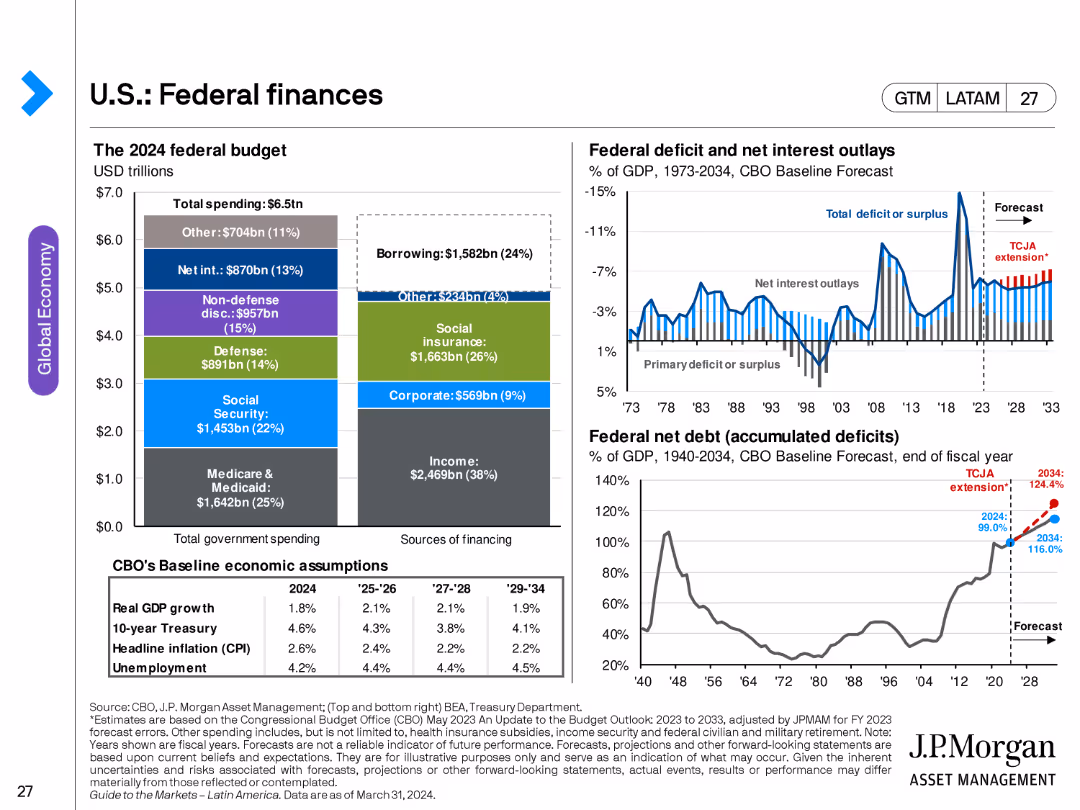
The slide features multiple charts: a pie chart showing the 2024 federal budget breakdown, a line chart for federal deficit and net interest outlays, and another line chart for federal net debt as a percentage of GDP.
Financial Performance
Government & Public Sector
This slide examines the U.S. federal finances, including budget allocation, deficit, and debt projections, providing insights into government spending and fiscal policy.
federal budget, deficit, debt, fiscal policy, government spending, U.S. finances
false
U.S.: Federal financesGuide to the Markets Latin America | 2Q 2024
Multiple Chart
JP Morgan
View slide
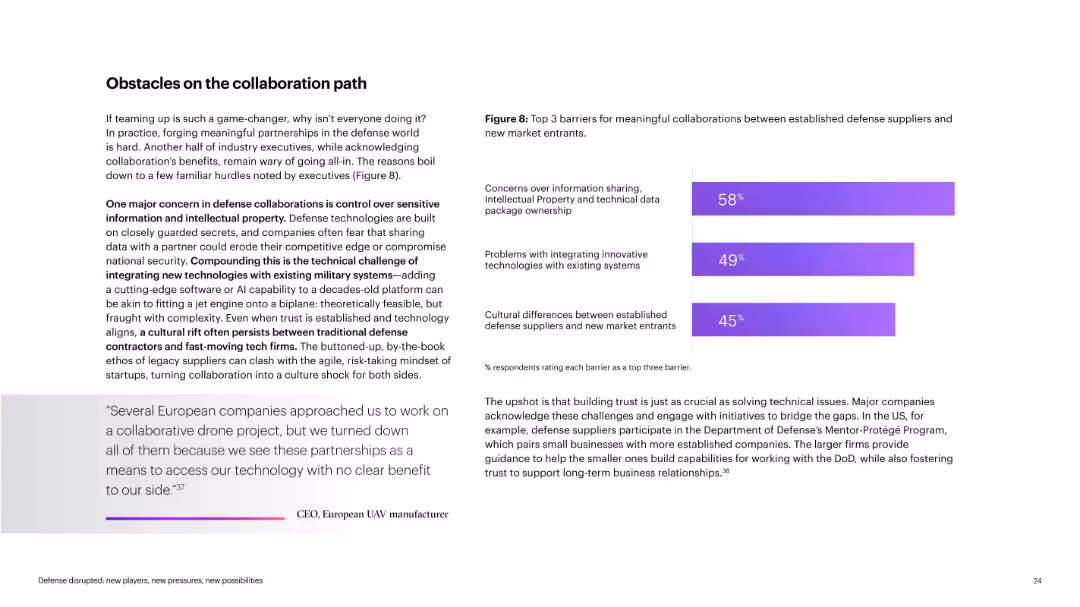
Text-heavy slide with quote at bottom; includes bar chart on right showing top three collaboration barriers. Clean layout with left narrative, right chart, and quote at bottom.
Regulatory and Compliance
Government & Public Sector
Outlines key barriers to collaboration between legacy defense firms and startups: IP concerns, system integration issues, and cultural mismatches. Includes executive quote and explanation of initiatives like the DoD’s Mentor-Protégé Program.
collaboration, IP concerns, system integration, culture, startups
false
Obstacles on the collaboration pathDefense disrupted: New players, new pressures, new possibilities
Mixed Chart
Accenture
View slide
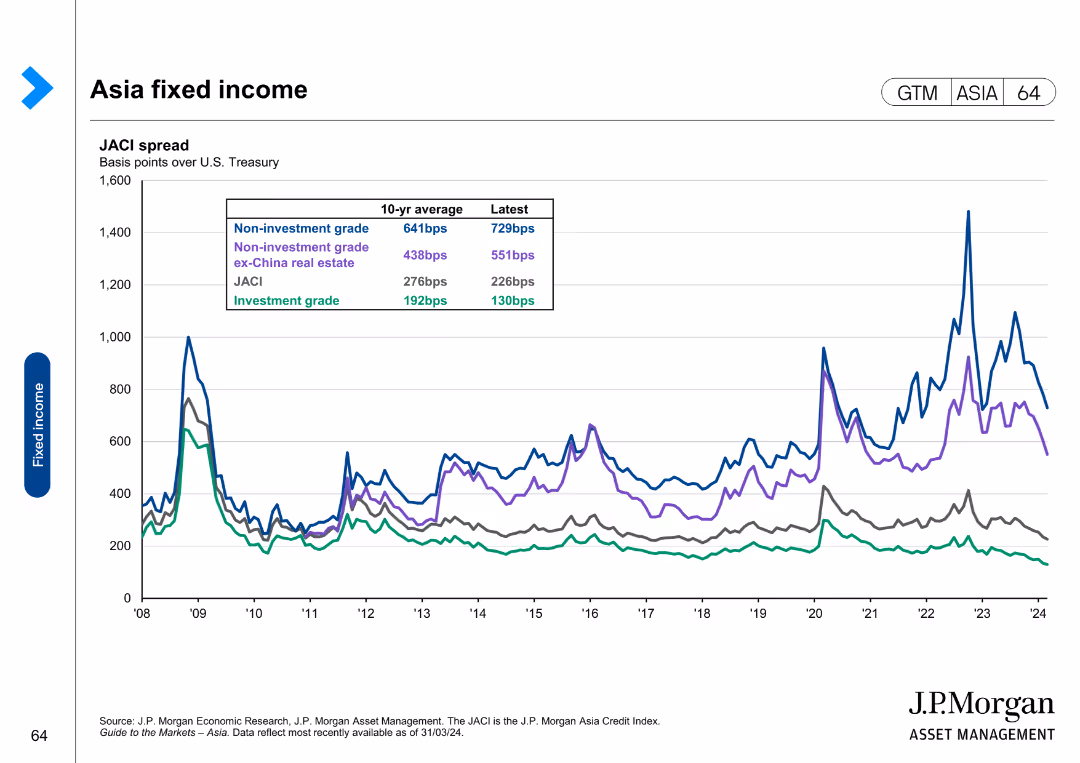
The slide includes a line chart with multiple series representing different categories of fixed income spreads in Asia.
Market Analysis and Trends
Financial Services
The slide examines fixed income spreads in Asia, differentiating between investment grade, non-investment grade, and specific sectors like ex-China real estate.
fixed income, Asia, investment grade, non-investment grade, financial analysis
false
Asia fixed incomeGuide to the Markets Asia | 2Q 2024
Single Chart
JP Morgan
View slide
This slide has a simple layout with a clear division between text sections and a central infographic. The infographic is a circular diagram with four segments, each containing an icon and label, indicating a strategic approach.
Organizational Structure and Change
Professional Services
The slide describes an organization's strategy and foundational elements for creating value. It could be used to explain a company's core objectives and strategic guideposts, such as purpose, mission, and impact on various stakeholders.
Strategy, Value Creation, Impact, Growth, Sustainability, Inclusivity
false
How we create valueAccelerating Sustainable and Inclusive Growth
Diagram
McKinsey
View slide
The slide shows a line chart comparing cement import volumes in Australia, the US, and France, with a table summarizing import penetration rates.
Market Analysis and Trends
Industrial & Manufacturing
Examines the differences in cement import reliance between Australia, the US, and France. Highlights import growth trends and provides context on market reliance and supply chain factors.
Cement imports, Australia, US, France, market analysis
false
Despite high growth in US cement imports, US and French markets are less reliant on imports than AustraliaInternational Comparison of Australia’s Freight and Supply Chain Performance Final Report - Cement
Mixed Chart
LEK
View slide
Slide features multiple column charts and textual information outlining financial targets and historical data. Layout is clear with a direct comparison of yearly data.
Financial Performance
Financial Services
This slide presents a financial overview, showing RoTE, total income, net interest income, cost:income ratio, and other financial metrics from 2021 to projections for 2026. Each financial aspect is broken down by year with targets for 2026 clearly highlighted.
financials, RoTE, income, cost, 2026 targets, banking
false
Today’s financials and 2026 targetsFY 2023 Results Announcement
Multiple Chart
Barclays
View slide
The slide includes column charts illustrating investment in business divisions over time with projected future growth.
Strategic Planning
Financial Services
Discusses the strategic investment across various business divisions aiming to drive future financial returns and operational efficiency.
investments, strategy, growth, divisions, returns
false
Better investments: facilitating growth in all divisionsFY 2023 Results Announcement
Mixed Chart
Barclays
View slide
A column charts illustrates the historical and projected Liquidity Coverage Ratio (LCR), while a side panel details EOP Available Liquidity Resources. Textual commentary is provided for context and explanation.
Regulatory and Compliance
Financial Services
The slide aims to communicate the bank's adherence to regulatory liquidity requirements, with a breakdown of various components contributing to the LCR. This data is essential for regulatory bodies and financial analysts.
Liquidity Coverage, Regulatory Compliance, LCR, EOP Liquidity, Financial Analysts, Regulatory Requirements
false
2Q23 Liquidity Coverage RatioEarnings Results Presentation Second Quarter 2023
Multiple Chart
Citigroup
View slide
Stacked bar charts by region showing share of communicable disease deaths (2016 vs. 2060); color-coded by disease
Industry Overview
Healthcare & Pharmaceuticals
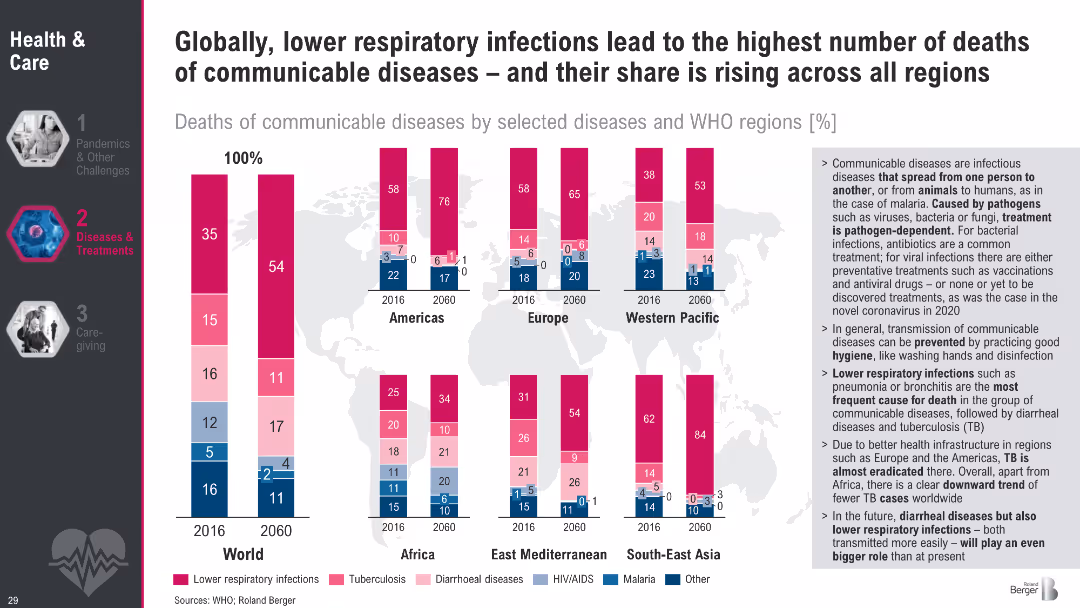
The slide shows that lower respiratory infections are the leading cause of communicable disease deaths globally. Despite progress in some areas, their share is expected to rise in most regions by 2060.
communicable diseases, respiratory infections, TB, WHO, global health, mortality trends, infection control, projections
false
Globally, lower respiratory infections lead to the highest number of deaths of communicable diseases and their share is rising across all regionsMegatrend 2 Health & Care
Multiple Chart
Roland Berger
View slide
Multiple column charts comparing the number of museums, music venues, theatres, and art galleries
Market Analysis and Trends
Media & Entertainment
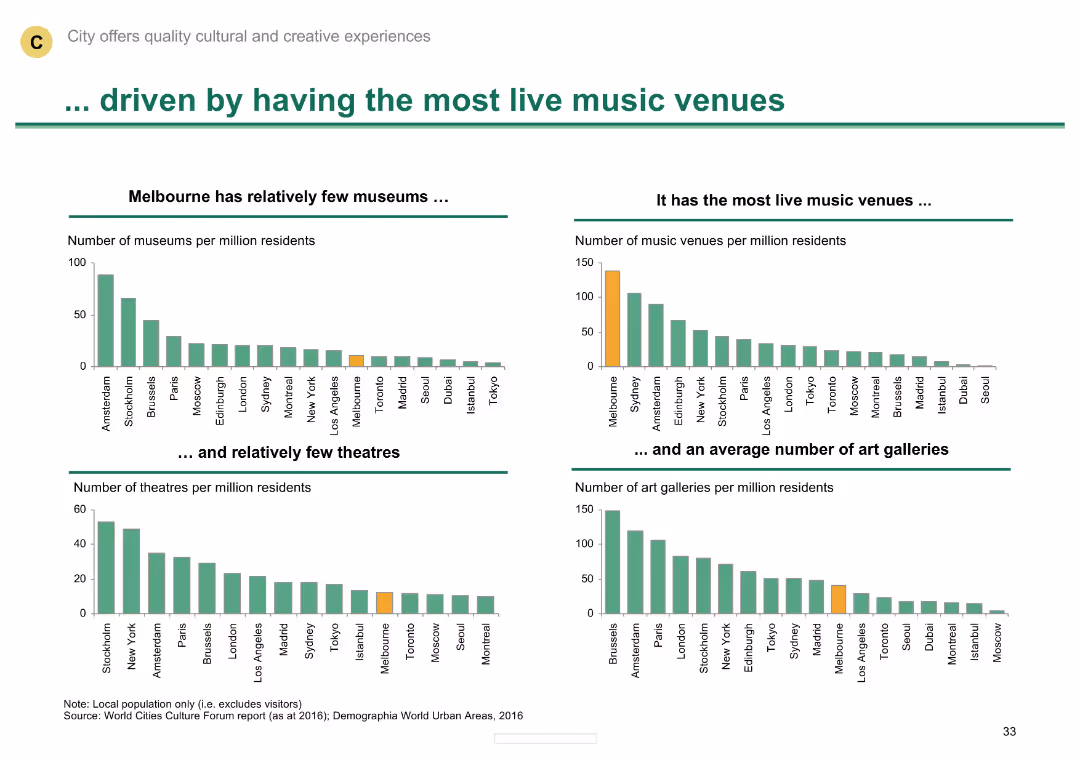
Shows Melbourne's leadership in live music venues and its relatively average number of theatres and galleries.
Live music venues, museums, theatres, art galleries, Melbourne
false
... driven by having the most live music venuesMelbourne as a Global Cultural Destination
Multiple Chart
BCG
View slide
Four-column layout with icons representing actions by UIC; includes quotes from stakeholders and summary of UIC's perceived value.
Organizational Structure and Change
Transportation & Logistics
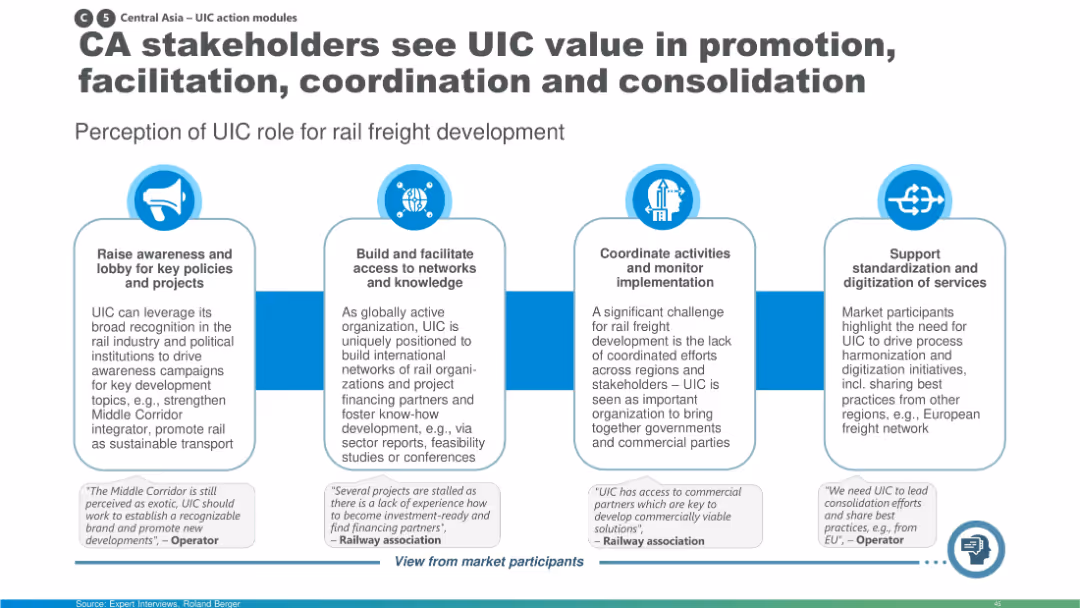
The slide presents market feedback on the role of UIC (International Union of Railways) in supporting Central Asia rail development. Stakeholders value UIC’s support in awareness-building, network access, coordination, and standardization efforts.
UIC, stakeholder input, coordination, rail development, Central Asia, rail freight
false
CA stakeholders see UIC value in promotion, facilitation, coordination and consolidation 45RAIL FREIGHT IN CENTRAL ASIA AND MIDDLE EAST
Pillar
Roland Berger
View slide
Dual-panel vertical bar segments across categories; dark blue background with white/orange accents.
Market Analysis and Trends
Consumer Goods
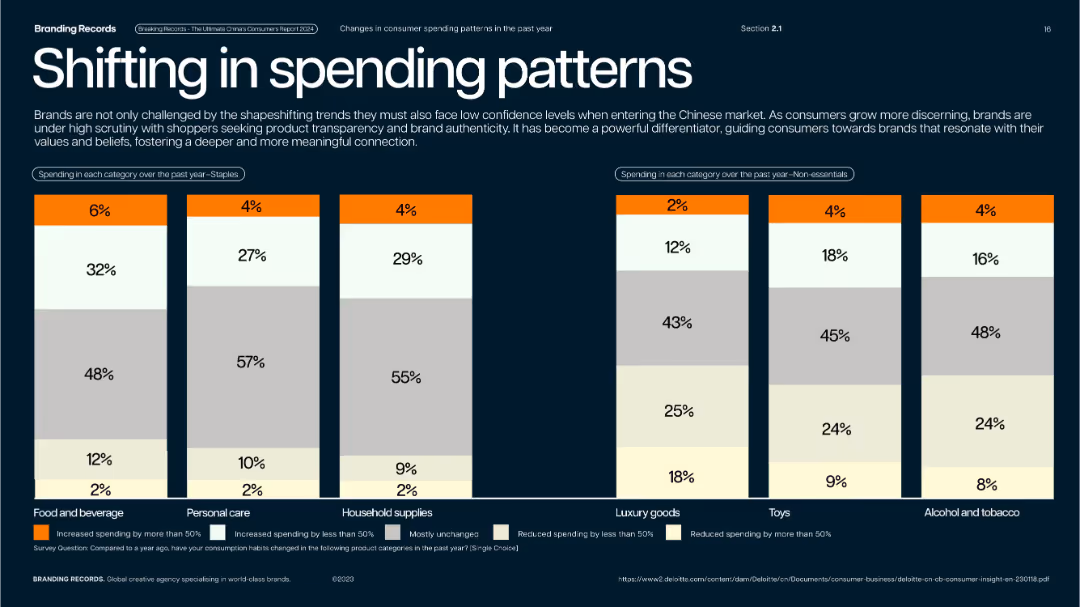
Shows how consumer spending in China has changed across both essential (staples) and non-essential categories. Highlights increases, stability, and declines across segments like personal care, luxury goods, toys, etc.
spending change, consumer behavior, staples, luxury, inflation, China retail
false
Shifting in spending patternsBreaking Records Everything Brands needs to know to breakthrough and dominate the Chinese Market in 2024
Single Chart
McKinsey
View slide
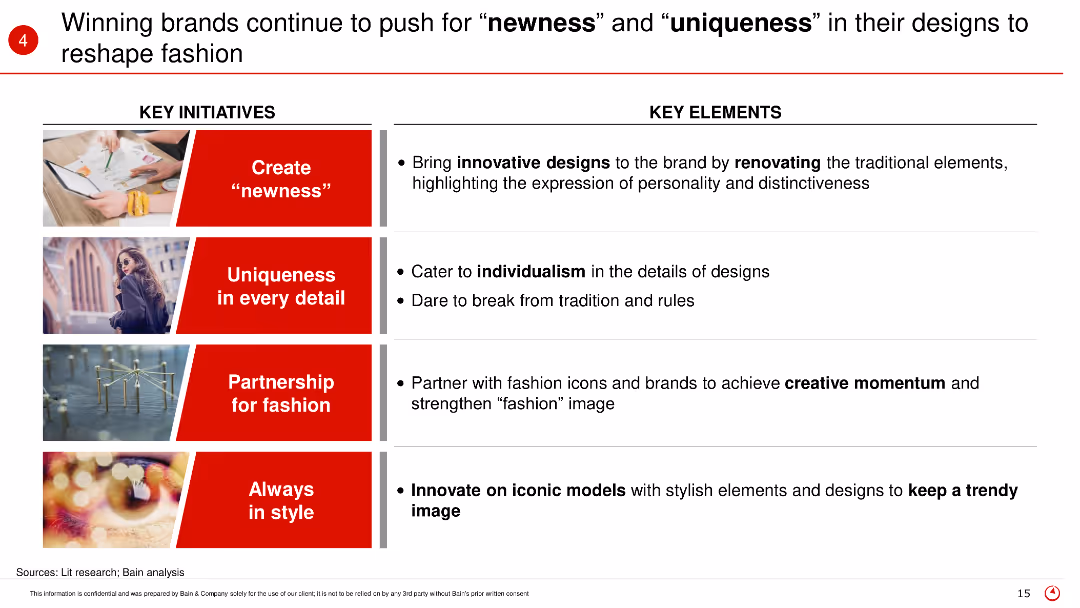
The slide highlights key initiatives and elements such as creating newness, uniqueness in every detail, partnerships for fashion, and staying in style, with supporting images for each point.
Product and Service Analysis
Retail & E-commerce
The slide discusses how winning brands in fashion are focusing on innovation, individuality, partnerships, and continuous style evolution to stay ahead in the market.
Fashion innovation, brand strategies, newness, uniqueness, design trends
false
Winning brands continue to push for “newness” and “uniqueness” in their designs to reshape fashion2017 China Luxury Market Study
Table
Bain
View slide
The layout includes values, icons, and a data flow diagram. The design is clean, with blue color accents and data-related imagery.
Technology and Digital Transformation
Technology & Software
Details how the breadth and scale of the firm's data are being transformed into value-added products for clients through various tools and services.
Data transformation, payment accounts, merchant acquiring, digital identity, data governance, biometrics, customer insights, identity verification
false
We are beginning to unlock value by transforming the breadth and scale of our data into value added products for our clientsInverstors Day 2023
Header Horizontal
JP Morgan
View slide
A content-rich slide with hexagonal icons linked to key industry trends such as digitalization and sustainable economy.
Financial Performance
Financial Services
Analyzes the impact of various industry trends on institutional banking, such as digitalization, market dynamics, and economic factors.
banking, trends, digitalization, economy, sustainability
false
Banking Industry Dynamics | Key Trends I mpacting Institutional Banking2022-2024 Bank Handlowy Group Strategy
Framework
Citigroup
View slide
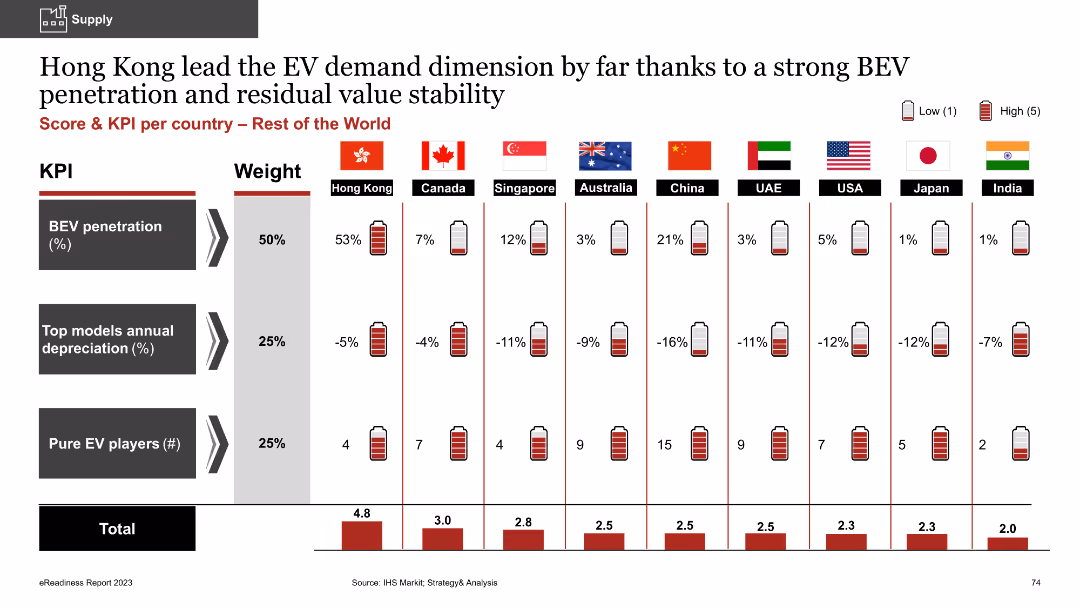
Column chart comparing BEV penetration, annual depreciation of top models, and number of pure EV players
Market Analysis and Trends
Energy & Utilities
The slide shows Hong Kong's leading position in BEV demand, comparing it with other countries based on metrics like BEV penetration, model depreciation rates, and the number of EV players
BEV penetration, demand, depreciation, EV players, comparative analysis
false
Hong Kong lead the EV demand dimension by far thanks to a strong BEV penetration and residual value stability4th edition eReadiness 2023
Multiple Chart
PwC/Strategy&
View slide
The slide features a hexagon-shaped diagram with six colored segments, each representing a foundational aspect to address in digital policy-making, like 'Data and Privacy' and 'Work and Wage effects'.
Strategic Planning
Technology & Software
It stresses the importance of certain foundational aspects in digital transformations, such as cybersecurity and skill gaps. This slide is apt for presentations on digital strategy, policy-making, or discussing the broad implications of digitization on society.
digital foundations, policy-making, cybersecurity, data privacy, skill gaps, diagram
false
Foundations to get rightDigital Economy: Trends, Opportunities and Challenges
Diagram
McKinsey
View slide
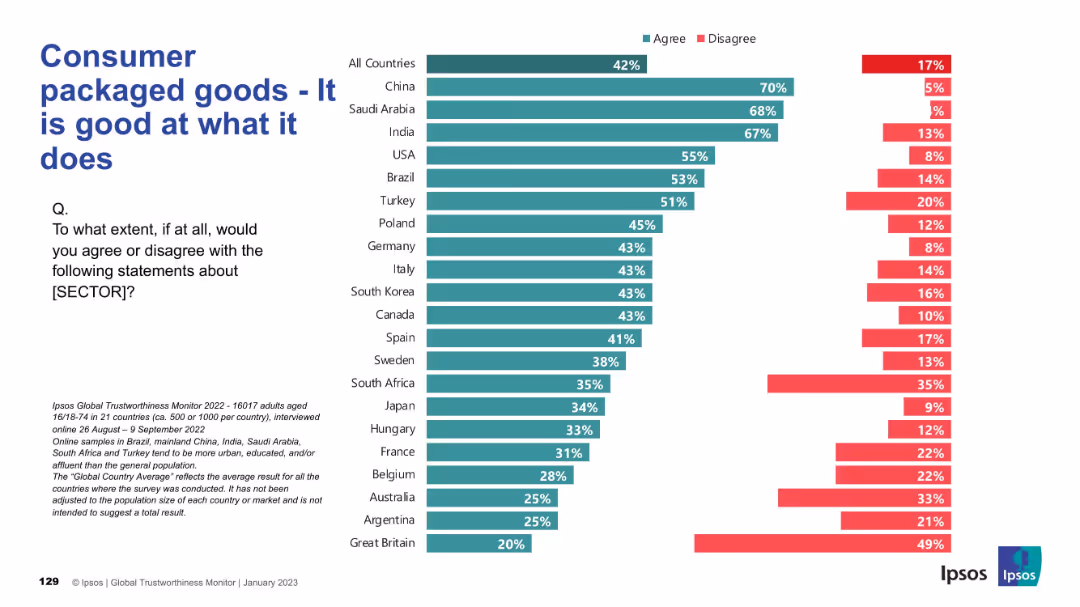
Horizontal bar chart format with country-by-country agreement/disagreement on competence of consumer packaged goods sector; new sector compared to earlier slides.
Product and Service Analysis
Consumer Goods
This slide evaluates the perceived competency of the consumer packaged goods sector. China, Saudi Arabia, and India report the highest agreement levels, while European countries display more moderate or skeptical views, suggesting varied confidence in product performance.
competence, product quality, consumer goods, global perception, Ipsos
false
Consumer packaged goods - It is good at what it doesIPSOS GLOBAL TRUSTWORTHINESS MONITOR January 2023
Mixed Chart
IPSOS
1
...
Next
Load More
Hold On!
We are searching in our database
If nothing, comes up, please try different filters!
Create a FREE account to continue browsing
Receive Instant Access to 1,000+ slides from companies like McKinsey, Google, and Goldman Sachs
First Name
Last Name
Email
Password
I agree to all
Terms & Privacy Policy
Thank you! Your submission has been received!
Oops! Something went wrong while submitting the form.
Have an account?
Sign in
Column Chart
Heatmap
Chevron
Org Chart
Infographic
Callouts
Timeline
List
Graphic
Picture
Process Flow
Diagram
Paragraph
Map
Table
Framework
Subtitle
Takeaway Box
Icon
Other Chart
Radar Chart
Waterfall Chart
Mekko Chart
Pie Chart
Scatter Plot
Line Chart
Bar chart
Bullet points